One hundred and forty two days before the 2012 US presidential election our final State-by-State Political-Economy Model gave an advantage to Barack Obama with 51.6% of the popular vote (error margin ± 4.47) and 324 electoral votes (Jerôme and Jerôme-Speziari Reference Jerôme and Jerôme-Speziari2012). On November 6, 2012, with 51.6%Footnote 1 of the vote and 332 electoral votes, the Democratic incumbent wins a second term. Regarding certainty of an Obama plurality, the model gave a probability of victory by 64%. In 2012, it seems that this was enough to ensure a good predictability.
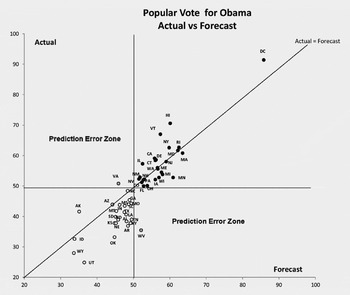
Thus, our model successfully predicted the correct Democratic/Republican balance of power. Moreover, this ratio was correctly forecast in 48 states (+DC) out of 50 (+DC) with the exceptions of Virginia (given to Republicans) and West Virginia (given to Democrats), for which an explanation of the gap between forecast and actual results should be provided. (See figure 1.)
State-by-State Political Economy Model Forecast for 2012 US Presidential Election

Note that the model correctly predicted the results in the main battleground states such as Colorado, Florida, Iowa, and Ohio. At last, it has been sensitive enough to forecast that Indiana and North Carolina would return to the Republican side.
The vote predictions based mainly on economic determinants (local change in unemployment) and political determinants (president's job approval and parties' local partisan dynamics) helped to correctly predict the election's outcome.
If we decode our results, it seems that the change in unemployment—and not the level—was a decisive factor in the vote, more or less amplified depending on the states. From a 10% peak in October 2009, the unemployment decreased to 7.8% in October 2012 (this rate was the same when Barack Obama took office). It should be added that Obama succeeded in keeping afloat his popularity. Over the long term, from 68% satisfied at the beginning of his term, his popularity decreased to 56% in October 2009 before reaching 51% in November 2012 (Gallup Poll).
At least, since 2008, partisan dynamics across the states seem to have been particularly stable given that only Indiana and North Carolina flipped back compared to the previous election.
As regards exogeneous parameters (e.g., not in the model) that could perturb it, it seems that “Obama's failure” in the first debate had no negative effect on the Democratic vote, neither was there a “Sandy” effect that might have had a particular impact within some kind of Rally-around-the-Flag effect. Similarly, the likelihood of an “anti Obama” referendum and the Romney's slogan “are you better off than four years ago” seem not to have been decisive, nor a “racial cost” possibly offset by the growth in the population of visible minorities and their high level of participation once again.
Finally, even if we obtained a very satisfactory performance, how could we improve our model to do even better in 2016?
First, we certainly have to pay more attention to two states, Virginia and West Virginia. First, in Virginia, the model failed because the partisan dynamics variable (establishing this state as a solid historical Republican stronghold) did not capture the silent change in the Virginian electoral sociology (in suburban areas especially). This means that the components of our state-level partisan dynamics index, which performs rather well but is still a black box, need to be more precisely measured. Second, the error on West Virginia comes from our Job Approval Index, measured at a national level, which overestimated Obama's popularity in a state where the incumbent has one of the worst job's approvals at a state level (32.7% according to Gallup) after Oklahoma, Utah, Idaho, and Wyoming. This suggests we should experiment the insertion of state-level job's approvals in our model if available in each state in the long run.
As a whole, subject to these limitations, unlike other forecasting methods, our State-by-State Political Economy Model correctly meets the main criteria of Lewis-Beck Quality Index,Footnote 2 that is, lead time, accuracy, reproducibility, and parsimony (see Michael Lewis-Beck Reference Lewis-Beck2005).