




Published online by Cambridge University Press: 22 November 2005
Agricultural distress in the 1920s is routinely quoted among the causes of the Great Depression. This article challenges the conventional wisdom. World agriculture was not plagued by overproduction and falling terms of trade. The indebtedness of American farmers, a legacy of the boom years 1918–1921, did jeopardize the rural banks, but the relation between their crises, the banking panic of 1930, and the Great Depression is tenuous at best.
The Great Depression has arguably been the major peacetime macroeconomic shock in world economy since the start of modern economic growth. From 1929 to 1933 the GDP per capita fell by a third in the United States and by about 9 percent in the Atlantic economy.1
Data are from Maddison, World Economy. The Atlantic economy includes Western Europe and its off-shoots (see the list of countries in Table 3).
Bernanke, Essays, p. vii
Most of the answers to these questions can be framed in two different interpretative traditions, the “real” and the “monetary” (or “financial”) story.3
For some additional references, see Balderston, “Introduction,” pp. 1–6, for the “real” story; and Calomiris, “Financial Factors”; and Randall “Overview,” pp. 9–14, for the monetary one.
Temin, Lessons, pp. 11 and 55. See also Temin, Did Monetary Forces, pp. 2 and 146–48.
Clavin, Great Depression, p. 78. See. also Kindleberger, World, pp. 70–74 and 90–92; Romer, “World War One,” p. 110; Pollard, Peaceful Conquest, pp. 500–01; Eichengreen, Golden Fetters, p. 227; Bairoch, Victoires, vol. 3, pp. 36–38; Koning, Failure, pp. 163–84; Foreman-Peck, History, pp. 187–88; Feinstein, Temin, and Toniolo, European Economy, pp. 71–76; James, End, pp. 63 and 105; Sheingate, Rise, pp. 76–77; and Findlay and O'Rourke, “Commodity Market,” pp. 44–45.
This article challenges this view. The conditions in agriculture on the eve of the depression, although far from ideal, were not as bad as suggested by the received wisdom. Therefore, the collapse of agricultural prices in 1930–1933 and the ensuing devastating crisis were not a necessary consequence of the farmers' behavior in the previous decade. Given the clear distinction between the two stories, they will be dealt with separately.
According to the “real” story, agriculture contributed both to the outbreak of the depression in 1929 and to its catastrophic worsening in the second half of 1930. In the short run, the downturn was accelerated by the poor conditions of the balance of payments of agricultural exporters such as Australia or Argentina. Vladimir Timoshenko primarily blames the poor 1929 crop, which reduced their exports, whereas William Lewis and Barry Eichengreen stress the effect of the 1928 American monetary squeeze on these heavily indebted countries.6
Timoshenko, World Agriculture, pp. 66–76; Lewis, Economic Survey, p. 58; and Eichengreen, Golden Fetters, pp. 227–28.
Hamilton, “Was the Deflation,” pp. 158–62; and Siklos, “Understanding the Great Depression,” pp. 35–36. Hamilton shows how the (poor) predictions of future markets for agricultural commodities also shaped expectation about the aggregate price level.
The alleged disequilibrium was, however, a long-run problem, dating back to World War One.8
The gist of this interpretation was put forward in two major works by the League of Nations, Agricultural Crisis (which voiced the opinions by agricultural experts from some 30 countries) and Course (a report written by Bertil Ohlin, with the advice of other eminent economists such as Hayek or von Morgestern) and in the highly influential book by Timoshenko, World Agriculture, pp. 8–32. See also Genung, Agricultural Depression, p. 21; Arndt, Economic Lessons, pp. 10–12; and Lewis, Economic Survey, pp. 151–52. See also the more skeptical views by Aldcroft, From Versailles, pp. 223–28; and Bernstein, Great Depression, pp. 9–12 and 103.
Lewis, “W. Arthur Lewis,” p. 9.
“Western Settlement” countries include the United States, Canada, Australia, and New Zealand.
Madsen, Agricultural Crises, p. 356.
How did the fall in agricultural prices affect the rest of the economy? Agrarian economists in the early 1930s used a proto-Keynesian argument: the fall in farmers' income reduced economy-wide demand. Lewis points out that the fall in prices benefited consumers—so that the net effect on domestic demand was likely to be small.12
Lewis, Economic Survey, pp. 46 and 56–57, and “W. Arthur Lewis,” p. 10. See in the same vein Fleising, “United States”; Aldcroft, From Versailles, p. 236; Kindleberger, World p. 91; and Atack and Passel, New Economic View, pp. 594–96. Temin (Lessons, p. 56) suggests that the net domestic effect might have even been positive.
Eichengreen, Golden Fetters, p. 246.
Madsen, Agricultural Crises. The figures are obtained from the coefficients of a set of dynamic equations for 15 countries in 1929–1936. They refer to the direct effect only, omitting the additional effects via the depression of land prices and the reduction in farmer's wealth.
This article will not try to replicate Madsen's work, nor will it try to assess the relative importance of overproduction versus slow growth in demand as cause of the (alleged) disequilibrium. The article will instead focus on the existence of a disequilibrium, a necessary, though not sufficient, condition for the whole “real” story. To this end, it will look at the evidence on prices, production, and stock in the 1920s. Before discussing the available data, it is necessary to stress how narrowly focused the traditional narrative is. First, it deals almost exclusively with the countries of the Atlantic economy. African and Asian countries appear only as suppliers of selected tropical imports, such as coffee and rubber. Second, even the coverage of temperate agriculture is decidedly selective, in all likelihood according to the available data. Cereals and industrial crops have a paramount role whereas livestock products are given very little attention. Last but not least, the existence of the disequilibrium is mainly inferred from the decline in nominal prices and the increase in stocks for specific commodities. Production data are seldom quoted, and sometimes dismissed, as they do not show any spectacular increase in the 1920s, with the exception of rubber and perhaps silk.
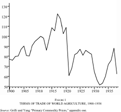
The data on relative prices do not confirm the conventional wisdom. Figure 1 reports the index of world agricultural terms of trade (ratio of prices of agricultural products to the unit values of manufactures) by Enzo Grilli and Maw Cheng Yang.15
The agricultural prices index is a weighted average of indices for food (0.85) and nonfood agricultural raw materials (0.15). Unfortunately, their series do not extend before 1900. From 1910 to 1929, prices declined at the yearly rate of –1.54 percent (significant at 15 percent).
FIGURE 1 TERMS OF TRADE OF WORLD AGRICULTURE, 1900–1938
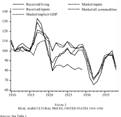
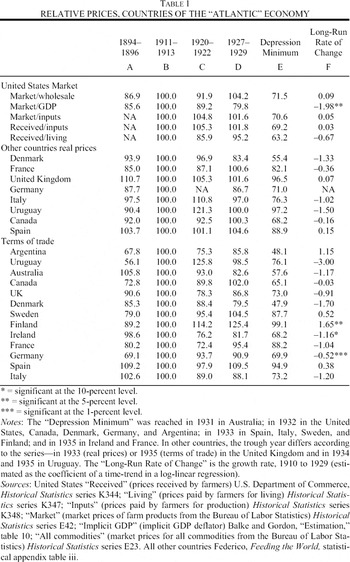
Grilli and Yang provide very few details about the computation of their indices. However, methods of computation can matter, as Figure 2 shows. It reports five series of agricultural prices for the United States, which are computed as ratios of four different basic series (farm-gate prices, wholesale price indices, implicit GDP deflator). Prices fluctuated a lot during the war and the 1920s: the wartime rise and subsequent fall was as great as the fall and subsequent recovery during the depression. Yet, in the long term, agricultural prices have remained constant. On the eve of the depression, they were back to their prewar level and, with one exception, the rates of change from 1910 to 1929 are not significantly different from zero (Table 1). These data cast serious doubts about the conventional wisdom, at least for the United States.
FIGURE 2 REAL AGRICULTURAL PRICES, UNITED STATES 1910–1938
What about other countries? Table 1 reports data on the agricultural terms of trade (ratio of prices of agricultural products/manufactures) and real agricultural prices (prices of agricultural products/overall price indexes) for as many countries of the Atlantic economy as possible at some relevant benchmark years. As expected, the terms of trade move more than real prices, which include the agricultural products in the denominator. The trends differ substantially among countries, possibly reflecting differences in coverage and methods of estimation of the series. The prices in 1927–1929 were lower than in 1910–1913 in six out of 13 countries and than in 1894–1896 in two only (Ireland and Denmark). As shown in column E of Table 1, in only three countries (all in Europe) was there a statistically significant downward trend in terms of trade from 1910 to 1929. In all other cases, short-term fluctuations swamped long-term trends. Price trends were even more favorable in the rest of the world.16
From 1911–1913 to 1927–1929, terms of trade improved in Punjab (+19 percent), Thailand (+11 percent), India (+4.5 percent), Korea (+4 percent), and Japan, while they decrease in Egypt (–1 percent), China (–1.2 percent), and above all Taiwan (–45 percent). Federico, Feeding the World, statistical appendix table iii.
Kindleberger, World, p. 93.
At first glance, the change in stocks seems to be strong evidence for the conventional wisdom. Both the series by Timoshenko (from 1923 onwards) and that by the League of Nations (from 1925 onwards) show a rapid increase in the late 1920s, at yearly growth rate of 7.5 percent and 11.3 percent respectively.18
Timoshenko, World Agriculture, table 10; and League of Nations, Memorandum, 1938–1939. Both sources reports estimate for different dates of the year. The growth rates in the text are computed with 1 June indexes for the period 1925–1929.
At least in the case of Timoshenko's index, this effect is worsened by a bizarre weighting, which bears no relationship at all with the composition of agricultural production. Textile material (cotton and raw silk) account for 40.4 percent of the total; tea, coffee, and sugar for 36.8 percent; and wheat for the remaining 22.2 percent. The League of Nations does not provide information on the weighting of its series.
From 1925 to 1929, the ratio for cotton remained stable, whereas those for wheat and sugar grew from 43 to 51 percent and from 34 to 48 percent, respectively (League of Nations, Memorandum, 1938–1939).
Output is from Bennet, “World Wheat Crops”; Davies “World Wheat Situation,” table 1; and Farnsworth, “Wheat,” table 2 (the series exclude Russia). The stock of wheat at 1 August is from Farnsworth, “World Wheat Stocks,” table 1. The author points out (pp. 57–58) that the increase of the share of output from the southern hemisphere increased the equilibrium stock/output ratio. The stocks were not unusually large in proportion to output for coffee as well. The ratio was 50.5 percent in 1883–1913 (Ukers, All About Coffee, p. 274) and 37.6 percent on average in 1923–1929 (League of Nations, Agricultural Crisis, table 9). It rose to 84.6 percent in 1928/29, which anyway was not the highest on record.
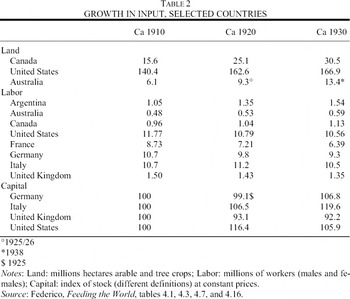
The available data on the use of inputs, although incomplete (Table 2), rule out a reckless expansion of productive capacity in the 1910s and 1920s. The number of workers remained stable or even declined in most countries, capital increased by 5–10 percent and the stock of land in only a few overseas countries was clearly on the rise. To be sure, productive capacity might have increased thanks to technical progress, and indeed the sources of the 1930s often quote mechanization as a major breakthrough brought about by the war. But the number of tractors remained very low as late as 1930, and the growth in Total Factor Productivity, although somewhat faster than before the war, was still modest. In the United States, the rate from 1919 to 1929 was 1.2 percent per year, corresponding to a cumulative increase by 13 percent.22
Kendrick, Productivity Trends, table 34. See Federico, Feeding the World, chapter 5 and statistical appendix table 4 for the productivity growth and table 4.11 for the number of tractors.
Russia accounted for 28 percent of world exports of cereals in 1909–1913 (Stern, “Century”) and for 12 percent of “world” gross output in 1913 (Federico “Growth,” table 5).
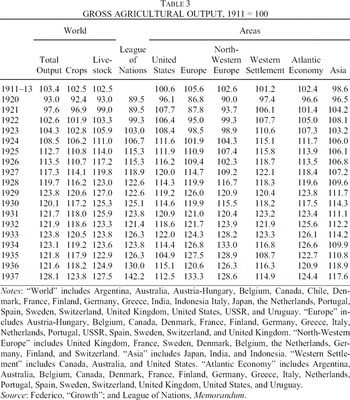
The evidence of a slow increase in productive capacity is consistent with the data on production (Table 3). In the 1920s and 1930s the League of Nations published a first index of world gross agricultural output, which, however, omits dairy and meat.24
League of Nations, Memorandum. The gross output is the total production available for human consumption or industrial processing after the deductions for seeds, cattle feeding, and other farm uses.
Federico “Growth.” The article covers the whole Atlantic economy, plus Eastern Europe (Russia and Austria-Hungary) and several South American and Asian countries.
See Federico, “Growth,” table 4.
The potential disequilibrium in the year t can be estimated as

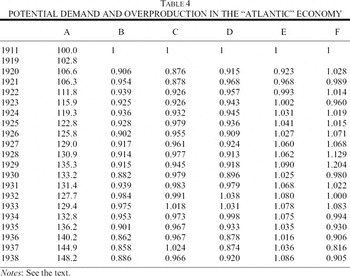
where S is an index of productive capacity and D is an index of potential demand—all expressed as a ratio to an equilibrium year. The data on productive capacity are too scarce to estimate S, which thus will be proxied with actual production. This is tantamount to assuming that productive capacity was fully utilized and short-term fluctuations of output reflected only the vagaries of the weather. The potential demand is computed as

where P is population and Cp is per capita consumption of agricultural products,

where A is a survival bundle of consumption (constant over time), Y is GDP per capita, [prod ] is an index of “world” real prices of agricultural products, and α and β are the relevant elasticities.
The equilibrium year is assumed to be 1911. The baseline estimate of R (Table 4, column B) is the ratio of aggregate production of the Atlantic economy (Table 3) to the baseline estimate of demand (Table 4, column A). This latter is computed by assuming a moderately inelastic demand, with α 0.6 and β –0.3.27
The index of real prices is computed as a weighted average of country series of Table 1, plus the ratio of food/consumer prices in the United States (U.S. Department of Commerce, Historical Statistics, series E 137/E135). These countries are fairly representative, as they accounted for about 85 percent of the population of the “Atlantic” economy. The national indices are weighted by population: using the country shares of gross output in 1913 (Federico “Growth,” table 6) instead does not affect the results. These series are wholesale prices, and thus they might not be representative of retail ones, which consumers faced. It is, for instance, possible that falls in prices of raw products such as wheat did not pass through to consumers because of the rise in processing costs (wages, etc.) or because of the market power of food companies. In the United States, the price of bread fluctuated much less than that of wheat (U.S. Department of Commerce, Historical Statistics, series E 188 and K 508). The divergence between wholesale and retail prices was a major concern for agricultural experts (League of Nations, Agricultural Crisis). The GDP and population are from Maddison, World Economy
As an alternative, one could hypothesize that elasticity was positive, but consumers adjusted spending to their expected permanent income. Clearly, no one could have predicted the Great Depression—so permanent income in the 1920s could be computed as the average of the years 1921–1929 or as an interpolation of income growth in the same years. In both cases, the production/demand ratio is lower than in the baseline case.
Wheat production is computed by summing up gross output in Argentine, Australia, Canada, the United States, Belgium, Denmark, Finland, France, Germany, Ireland, Italy, the Netherlands, Norway, Portugal, Spain, Sweden, Switzerland, and the United Kingdom, plus imports from Russia (Stern, “Century”). All the data are from Mitchell, International Historical Statistics, table D2—except for those for Belgium (Blomme, Economic Development), Italy (ISTAT, Sommario), and Portugal (Lains, personal communication). Prices are proxied by the ratio of price of wheat in the United States (U.S. Department of Commerce, Historical Statistics, series K 508) to wholesale price index (series E 53). The elasticities are assumed to be 0.2 for income and –0.1 for prices. The “overproduction” disappears totally if Atlantic demand is compared with total world production, from Bennett “World Wheat Crops.”
The statistical evidence discussed so far refers to agriculture as a whole, and thus it does not rule out differences by crop. According to Grilli and Yang, in the late 1920s the “terms of trade” for agricultural raw materials were 30 percent lower than before the war.30
Grilli and Yang, “Primary Commodity Prices.”
Prices of corn, wheat, and cotton are from U.S. Department of Commerce, Historical Statistics, series K504, K508, and K 555. Other products are from Strauss and Bean “Gross Farm Income,” series 85, 86, and 90. All prices are deflated using the index of the cost of living for farmers, U.S. Department of Commerce, Historical Statistics, K347.
See Federico, Feeding the World, table 3.7.
The production of the trees planted in the boom years of the early 1920s glutted the market in the late 1920s (Aldcroft, From Versailles, pp. 228–29). Even if the initial investment in a plantation was totally amortized, plantations should not have continued to produce if prices did not cover variable costs.
The share of livestock products of total “world” output increased from 43.6 percent in 1911–1913 to 45.8 percent in 1928–1930. The sum of fruit and livestock products (meat, dairy products, and eggs) increased from 62.2 percent of U.S. gross output in 1919–1921 to 70.1 percent in 1928–1930 (these data come from Strauss and Bean, “Gross Farm Output,” tables 10 and 27).
Liepmann, Tariff Levels, table AI (potential tariff levels). The duty was also lower in 1927 than in 1913 in the majority of countries for fruit and vegetables, whereas it was higher for the other categories such as livestock, animal foodstuffs, and other foodstuffs. The differences were anyway quite small. Furthermore, barriers to trade were even lower in the early 1920s (League of Nations, Agricultural Crisis, pp. 17–21; Clavin, Great Depression, pp. 81–86; and Federico, Feeding the World).
Summing up, the evidence rules out a major disequilibrium. This result should not be really surprising, if one considers how farmers in Western settlement countries behaved according the traditional story. They allegedly increased their productive capacity under the twin assumption that demand was to increase as fast as before the war and, crucially, that European agriculture would be unable to satisfy it. One can admit a collective error in prediction under the exceptional wartime circumstances, but the conventional wisdom implies that they went on erring throughout the 1920s, even after the great shock of 1920–1921 and the return to normalcy in international economic relations. In other words, they were betting on a price rebound, which did not materialize. Such a collective misjudgement is hardly credible, especially as farmers had the option to migrate to cities, where the economic growth offered plenty of job opportunities.36
In the United States, the market for labor was well integrated in the 1920s (Alston and Hatton “Earnings Gap”), and 0.63 millions farmers migrated to cities each year from 1921 to April 1930 (U.S. Department of Commerce, Historical Statistics, series C 78).
Agricultural distress would play an important role in the “monetary” story of the Great Depression if it caused or contributed to cause the banking panics. As is well known, Milton Friedman and Anna Schwartz, in their classic book A Monetary History of the United States, argue that the banking panic of October 1930, poorly managed by the Federal Reserve, turned the initial downturn into the Great Depression.37
Bank failures caused a substantial and unexpected reduction in the money stock, which the Federal Reserve was unable or unwilling to contain (Friedman and Schwartz, Monetary History pp. 299–311 and 338–341). See the reappraisal by Hamilton, “Causes”; or by Cole and Ohanian “Great Depression,” pp. 16–19. Other scholars, such as Bernanke (“Non Monetary Effects”), stress a different channel of transmission. The fall in supply of banking services and the more cautious lending policy of surviving institutions forced households to save more.
See Bernanke, “Macroeconomics”; and, on the causes of banking crises in other countries, Grossman, “Shoe.” On the indebtedness of German farmers, see League of Nations, Agricultural Crisis, pp. 171–72.
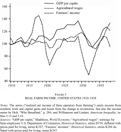
On the eve of the depression, the condition of American farmers was not terrible, although surely not very good. The 1920s had been quite an eventful decade (to say the least) for them (Figure 3). Farmers had profited handsomely from the war-time boom and were hard hit by the fall in prices. From 1917 to 1921, their real income fell by 55 percent—i.e., as much as from 1929 to 1932.39
See for an account of the crisis Shideler, Farm Crisis, pp. 36–52; and Johnson, “Postwar Optimism.”
FIGURE 3 REAL FARM INCOME, UNITED STATES 1910–1938
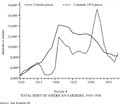
However, the real problem for American farmers was indebtedness. The real stock of debt had been growing steadily since the late 1890s but it really soared from 1918 to 1921 (Figure 4).40
Data are from U.S. Department of Commerce, Historical Statistics: on debt after 1910 (as of 1 January) series K361 and K376–K380; on net personal savings, series F 547; both deflated with prices received by farmers (series K 344). From 1897 to 1909, the real stock increased by 10 percent (nominal stock is from Goldsmith, Study, series M27 and A 23, deflated by wholesale prices of agricultural products from U.S. Department of Commerce, Historical Statistics, series E 42).
The nominal value of land is from Lindert, “Long-Run Trends,” table 1, deflated with prices received by farmers (U.S. Department of Commerce, Historical Statistics, series K 344). These yearly figures are unadjusted for the quality change related to the westward expansion. Lindert's adjusted figures are at ten-year intervals, and therefore unsuitable for a short-term analysis. The bias from the use of yearly data is, anyway, very small: from 1915 to 1930 unadjusted real prices fell by 39.2 percent and adjusted ones by 36.9 percent.
For the estimate of the gross output see Federico, “Growth.”
The main, official, mortgage usually amounted to about half the value of the farm, whereas these “junior” mortgages, backed with personal promissory short-term notes, could supply up to a further 40 percent in some cases (Johnson “Post-War Optimism,” pp. 184–85). These loans accounted for 15 percent of total farm debt in the 1970s (U.S. Department of Commerce, Historical Statistics, p. 478). It is conservatively assumed that they amounted to about a quarter of the known total in the 1920s.
FIGURE 4 TOTAL DEBT OF AMERICAN FARMERS, 1910–1938
The fall in prices, from June 1920, dramatically worsened the financial conditions of farmers. Real interest rates jumped to almost 50 percent and interest payments on mortgage-backed loans rose to 16.6 percent of farmers' income.44
Interest on mortgages is from U.S Department of Commerce, Historical Statistics, series K 372, income series K 284, plus interest payments. On the credit crunch, see Shideler, Farm Crisis, pp. 52–58; and for the policy of the Federal Reserve, see Metzler, History, pp. 114–15.
This figure is estimated assuming that unsecured loans paid the same interest rate as mortgage-backed ones. This is a conservative estimate (Clarke, Regulation, table 3.1).
Throughout the rest of the 1920s, the stock of nominal debt and the interest/income ratio decreased slowly but steadily. By 1929 the debt was 13 percent lower in nominal and 25 percent lower in real terms than it had been eight years before. However, this reduction was brought about almost exclusively by foreclosures, which increased from 3.2 percent of farms in 1913–1920 to 10.7 percent in 1921–1925 and to 17.7 percent in 1926–1929.46
Alston, “Farm Foreclosures,” table1; and Goldsmith, Study, table M 27. The data also include distress sale without formal procedure.
From 1922 to 1929, total financial assets remained constant (only increasing by 9 million), tax arrears increased by 110 million, mortgage-backed debts fell by 1.1 billion, and other debts fell by 1.3 billion (Goldsmith, Study, tables M 28, A-53, A-54, and A.65). The source reports figures at 1930 prices, which are converted in current prices with the index of prices received by farmers (U.S. Department of Commerce, Historical Statistics, series K 344). The author estimates the total value of debt on foreclosed farm assuming that each mortgage amounted to three-quarters of the average one.
Alston “Farm Foreclosures,” table 2; and Hamilton, “Causes.”
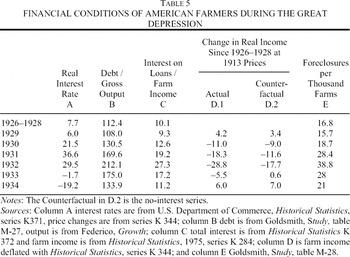
There is little doubt that indebtedness worsened the conditions of farmers during the Great Depression (Table 5). The nominal stock of debt fell somewhat from the precrisis level, but much less than gross output—so that the debt/output ratio doubled. Real interest rates soared, interests payments gobbled a growing share of income, and foreclosures (with some lag) increased to unprecedented heights.49
These figures are subject to a contrasting bias. They understate the burden of interests as they omit non-mortgage-backed loans and they overstate the burden, as they neglect interest rate delinquency, which was, on the contrary, quite diffused.
Alston, “Farm Foreclosures.” The rate of foreclosures was also positively related to the fall in income and to the extent of the previous land boom (measured with the increase in improved acreage from 1910 to 1925 and the increase in land prices from 1900 to 1912).
The effect of the farmers' financial plight on the banking system depended, ceteris paribus, on the share of credit to agriculture in the banks' total assets. From this point of view, the situation of the banking system as a whole was not so troublesome. In fact, most mortgages had been subscribed by individuals, insurance companies, and other non-banking institutions.51
By 1929, “individual and others” accounted for 47 percent of secured loans; insurance companies for 22 percent; Federal land banks, state credit agencies, and joint-stock land banks (monitored and guaranteed by the state) for 20 percent; and “commercial” banks for only 10 percent (including a tiny 1 percent for mutual saving banks) Goldsmith, Study, tables A-61 and A-62.
U.S. Department of Commerce, Historical Statistics, series X 684, less assets of private banks (series X 686). The total assets of “non-national banks,” which also included mutual savings, totalled 45 billion—10.4 of which was (urban and rural) real estate (U.S. Department of Commerce, Historical Statistics, series X 657 and 658).
See Alston, “Why do Banks”; and White, Regulation, pp. 14–17 and 127–32.
Alston, “Farm Foreclosure Moratorium.”
Goldsmith, Study, table A 53. These figures include deposits to other institutions. Rural banks were hit more than others, as depositors tended to shift funds to city banks—the so called seepage (Wicker, Banking Panics, pp. 101–02).
U.S. Department of Commerce, Historical Statistics, series X 580, X 683, and X 685 for the number of banks in 1929, and X 741 and X 743 for the number of failed banks. See Hamilton, From New Day, pp. 148–65, for the hesitant and ultimately failed attempts to help the distressed banks.
Thus, the two first conditions are established well enough: the crisis did jeopardize the financial situation of farmers and, as a consequence, of rural banks. The third condition, the relationship between the conditions of rural banks and the overall banking crisis (most notably the 1930 panic), is much more difficult to prove. Friedman and Schwartz, consistent with their overall interpretation, opt for a strong exogeneity. The 1930 panic was “neither foreseeable nor inevitable,” and it was not a consequence of a previous worsening in the “quality of loans.” They state that “a contagion of fear spread among depositors, starting from the agricultural areas, which had experienced the heaviest impact of bank failures in the 1920s.”57
Friedman and Schwartz, Monetary History, p. 308.
Wicker, “Reconsideration” and Banking Panics, pp. 32–36 and 152–54. See also Metzler, History, pp. 325–26.
Hamilton, “Causes.” His view is indirectly supported by Hamilton's results about price expectations (Hamilton “Was the Deflation”). The less anticipated price falls were, the more likely that they triggered a panic.
On the other hand, some econometric works suggest that agricultural distress and indebtedness can explain, at least partially, the rate of bank failures. In the 1920s agricultural distress, measured by the rate of foreclosures, had been the main determinant of differences among states in the rate of bank failures.60
Alston et al., “Why do Banks,” p. 421. See also Wheelock, “Regulation,” on Kansas; and Fischer, American Banking Structure, pp. 199–210.
Temin, Did Monetary Forces, pp. 83–90. He uses several measures of crisis—number of failures, proportion of failed banks, and so on. The concentration of failures in the South explains the strong effect of the variable share of cotton. The relationship is somewhat weaker for wheat, although wheat states had been the most hit by the wave of foreclosures of the 1920s. This shift in the trouble spots may have been a coincidence (or the consequence of the drought), but it might also reflect the effect of foreclosures, which had weeded out the weakest farmers in the wheat-growing states.
Thies and Gerlowski, “Bank Capital.” The rate of failure is negatively related to the size of the banks. The regression omits all real variables—including state income.
Mitchener, “Bank Supervision.”
Thies and Gerlowski (“Bank Capital”) consider all real estate loans, not just agricultural ones, in the denominator of their key explicative variable (on the role of loans to real estate in the Depression also see Eichengreen and Mitchener “Great Depression”).
Calomiris and Mason, “Fundamentals.” On the causes of failure among national banks also see White, “Reinterpretation.”
Summing up, the evidence for the “monetary” story seems insufficient. The war and postwar boom of the 1920s had saddled farmers with a huge amount of debt, which greatly reduced their ability to weather the fall in nominal prices ten years later. The agricultural crisis jeopardized the financial situation of the rural banks, and many of them failed. But it is quite difficult to prove the third condition—the existence of a causal link between the crisis of rural banks and the overall banking panic. The best guess rules out a strong relation between the crisis in the countryside and the outbreak of the 1930 panic. The poor conditions of rural banks are likely to have contributed to the overall financial crisis during the depression, but their specific contribution is difficult to disentangle from the more general boom and bust in real estate.
Relative agricultural prices did fall dramatically in almost all countries during the Great Depression (Table 1), while world agricultural production remained roughly constant (Table 3). In the conventional wisdom, these trends would be quite easy to explain as a dramatic consequence of the long-term disequilibrium, but as Table 4 shows, there is even less evidence of overproduction after the outbreak of the crisis than before. How, then, can the price fall be squared with the no-disequilibrium scenario? There are three possible answers to this question.
First, the Total Factor Productivity may have grown faster in agriculture than in the rest of the economy. This hypothesis seems highly unlikely. The gap in TFP growth rates between sectors would have to be implausibly large. Moreover, the available data suggest that from 1929 to 1937 TFP grew more slowly in agriculture than in the rest of the economy.66
The TFP growth of farming from 1929 to 1937 (0.8 percent) was the lowest among the main sectors of the American economy according to Kendrick (Productivity Trends, table 34). Field (“Most Technologically Progressive”) argues that Kendrick's figures underestimate nonfarm productivity growth.
Second, agriculture might have been hit more than other sectors by the fall in the supply of banking services.67
Bernanke, “Non Monetary Effects.” He remarks that big corporations could finance their investments with their funds, but this argument, however, does not apply to cash-strapped farmers. For a more critical view, see Bernstein, Great Depression.
The supply of credit to farmers was rationed by legislation for foreclosure moratoria, enacted by several states in 1932–1934 (Alston “Farm Foreclosure Moratorium”). For some additional evidence of the insufficient supply of credit to agriculture and for the measures to increase it, see Hamilton, From New Day, pp. 153–62.
From 1929 to 1932, prices received by farmers fell by 41.5 percent, while wholesale prices of farm products by 38.2 percent (U.S. Department of Commerce, Historical Statistics, series K 344 and E42). The fall might reflect productivity improvements in transportation and marketing.
The third, and most plausible, hypothesis focuses on the asymmetry between agriculture and the rest of the economy. Agriculture was a competitive sector and, in the peculiar conditions of the depression, its elasticity of supply was bound to be low. In fact the opportunity cost of farmers' labor was extremely low as it depended on the expected wages in other sectors. Real wages were rising, but the high rate of unemployment made the prospect of emigration to cities hardly attractive.70
The yearly net migration from the countryside (U.S. Department of Commerce, Historical Statistics, series C 78) to cities totaled 0.63 million from 1921 to April 1930 and 0.64 million from 1934 to 1939, but only 61,000 in 1931. From April 1931 to April 1933, 3.0 million people left farms and 3.74 returned, with a net immigration of 763,000 persons.
See, for example, among the many works, Bernanke and Carey, “Nominal Wage Stickiness”; Bordo, Erceg, and Evans, “Money”; the discussion by Cole and Ohanian, “Great Depression,” pp. 19–21; Kehoe and Prescott, “Introduction,” pp. 12–13; and Madsen, “Length,” pp.239–41.
Madsen, “Prices” and “Length.”
To sum up, this article largely exonerates agriculture from its alleged responsibility for the depression. The acquittal is complete for the charge of “overproduction” in the “real” story, and likely for the “monetary” story. In spite of their reckless borrowing spree, especially during the postwar boom, farmers were more a victim of the depression than a cause of it.
This article has been discussed in seminars at the Humboldt University (Berlin), Pompeu Fabra (Barcelona), Copenhagen and Carlos III (Madrid). The author thanks all participants, the editor, and two referees for their comments. They are not responsible for the remaining errors. He also thanks Jeff Williamson for having shared his database on terms of trade.

FIGURE 1 TERMS OF TRADE OF WORLD AGRICULTURE, 1900–1938

FIGURE 2 REAL AGRICULTURAL PRICES, UNITED STATES 1910–1938
TABLE 1 RELATIVE PRICES, COUNTRIES OF THE “ATLANTIC” ECONOMY
TABLE 2 GROWTH IN INPUT, SELECTED COUNTRIES
TABLE 3 GROSS AGRICULTURAL OUTPUT, 1911 = 100
TABLE 4 POTENTIAL DEMAND AND OVERPRODUCTION IN THE “ATLANTIC” ECONOMY

FIGURE 3 REAL FARM INCOME, UNITED STATES 1910–1938

FIGURE 4 TOTAL DEBT OF AMERICAN FARMERS, 1910–1938
TABLE 5 FINANCIAL CONDITIONS OF AMERICAN FARMERS DURING THE GREAT DEPRESSION