


1. Introduction
The glaciers on Spitsbergen, Svalbard, are characterized by the dry, cold climate of the high Arctic. Over 60% of the island is covered by glaciers and ice caps, which extend from elevations of 1000 m down to the shores where they calve into the ocean. An overview of the glaciers on Spitsbergen is given in an inventory by Reference Hagen, Liestøl, Roland and JørgensenHagen and others (1993). The typical Spitsbergen glacier is polythermal or Arctic-type. They move slowly, mostly due to internal deformation. A peculiarity is the large number of surge-type glaciers that exist.
The mass balance of glaciers on Spitsbergen has been widely studied for the past 50years (Reference Hagen and LiestølHagen and Liestøl, 1990; Reference Lefauconnier and HagenLefauconnier and Hagen, 1990; Reference Dowdeswell, Hodgkins, Nuttall, Hagen and HamiltonDowdeswell and others, 1995; Reference Hodgkins, Hagen and HamranHodgkins and others, 1999). These studies indicate a negative gradient of precipitation from east to west, with the driest areas in the centre of the island.
The annual net glacier mass balance is the sum of the winter accumulation and the summer ablation. Winter accumulation is the sum of precipitation, surface rime, snow and ice avalanches and wind-transported snow. A connecting link between the prevailing geostrophic winds, snowdrift and glacier mass balance was studied on Disco Island, West Greenland (Reference HumlumHumlum, 1987). It is generally assumed that the measured winter precipitation equally distributed over the terrain is not sufficient to explain all accumulation on the glaciers. The glacier locations must be favourable to gain more snow mass than the average surrounding terrain. Redistributed snow, moved by the wind, is suggested to be the most important factor for the additional input of mass to the glaciers. On western Spitsbergen it can be observed that during periods of high wind speeds, all snow is cleared from exposed areas in the mountains, while on the glaciers accumulation of 10–20 cm wind-transported snow (rounded grains) can be found after such storm events (Reference Jaedicke and SandvikJaedicke and Sandvik, 2002).
Detailed study of drifting snow shows that saltation and suspension are the major transport modes (Reference Budd, Dingle, Radok and RubinBudd and others, 1966; Reference Pomeroy and GrayPomeroy and Gray, 1990). The wind has to reach a certain threshold velocity before the snow particles loosen from the surface (Reference SchmidtSchmidt, 1972) and begin saltation along the snow surface. With increasing wind speed, lighter particles are picked up by the turbulent eddies of the boundary layer and become transported in suspension. Airborne snow particles surrounded by unsaturated air will start to sublimate. This is a major loss of snow mass to the atmosphere, typically 15-25% of the total wind-transported snow mass (Reference SchmidtSchmidt, 1972; Reference Pomeroy, Marsh and GrayPomeroy and others, 1997; Reference BintanjaBintanja, 1998; Reference Déry, Taylor and XiaoDéry and others, 1998).
The objective of this study is to investigate the connection between the location of glaciers on Spitsbergen and the dominating wind field in the area. The wind field in a 60×50 km2 study area is simulated with the help of a meteorological mesoscale model. The wind model is coupled to a snowdrift model. The model results are compared to the glacier locations, mapped from the 1990 aerial photography survey of the Norwegian Polar Institute.
2. Study Area
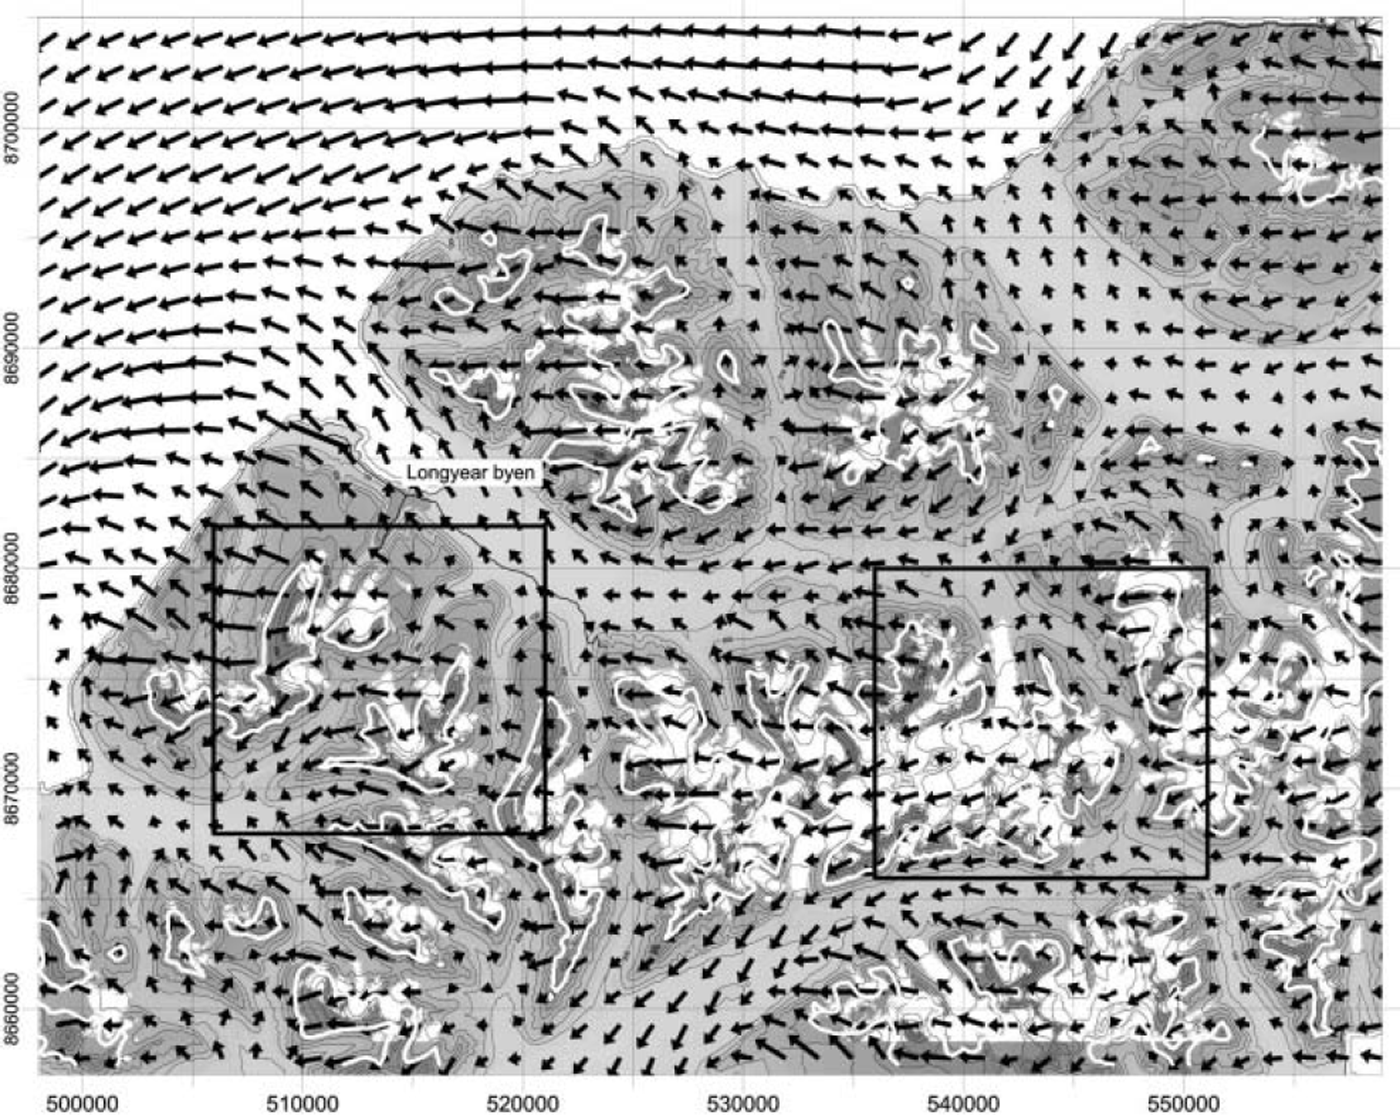
The study area is located on the island of Spitsbergen at about 78° N. The area is 60 × 50 km2 and extends from sea level to mountains up to 1100 m a.s.l., with glaciers covering 15% of the land area (Fig. 1). The glacier-free areas consist of moraine materials and sedimentary rocks. Vegetation is sparse and consists of mosses and low grasses. Wind conditions in the area are dominated by easterly winds, with frequent storms lasting several days. Due to the lack of tall vegetation, wind velocity at ground level is high, causing considerable snow mass fluxes during storms. The glacier equilibrium-line altitude (ELA) in this area is estimated from aerial photography by Reference HumlumHumlum (2002) and varies between 450 and 800 m a.s.l. (Fig. 1). The annual precipitation in the area is estimated to be ∼400 mm a-1 from precipitation maps provided by Reference Hagen, Liestøl, Roland and JørgensenHagen and others (1993) and Reference HumlumHumlum (2002).
Map of the study area. The glacier-covered areas are white. The estimated ELA (Reference HumlumHumlum, 2002) is marked by a white line. Arrows show the simulated mean wind vectors. The two rectangles show the example areas.
The digital elevation model (resolution 25 m) used in the numerical simulations is provided by the Norwegian Polar Institute and is derived from the aerial photography survey during summer 1990.
3. Wind Model
Winds were modelled using the Advanced Regional Prediction System from the Center for Analysis and Prediction of Storms (CAPS), University of Oklahoma, USA (Reference Xue, Droegemeier, Wong, Shapiro and BrewsterXue and others, 1995). This non-hydrostatic mesoscale model uses fully compressible equations and runs on a terrain-following staggered grid. To generate typical wind fields, the model was first run on a 5 9 × 5 9 × 2 5 point grid with a horizontal resolution of 4 km and vertical layers approximately 10-800 m above ground level. Only two surface types were used: snow-covered land with a roughness length z 0 = 0.05 m, and ocean with z0 = 0.002 m. The results from the 4 km grid were used as boundary conditions for a second grid (89 × 89 × 25 points) with a higher resolution of 750 m in the study area.
Because of model expenses it is not possible to simulate time-spans covering decades, which would be most interesting for glacier studies. Therefore, we have to work with a limited number of idealized weather situations.
Twelve years of atmospheric soundings from Ny-Ålesund, approximately 100 km northwest of the study area, were used to find typical atmospheric profiles for 24 weather classes. For each class an average profile of wind speed and direction, air temperature and relative humidity was calculated to initialize the wind model. The model was run once for each of the 24 classes, resulting in 24 wind fields that are coupled to long-term wind statistics of the area using records of mean sea-level pressure from the US National Center for Atmospheric Research (NCAR) for 60 years, 1938-97 (Fig. 2). This dataset gives monthly values of air pressure at a 5˚ grid for the entire globe. The wind speed and direction are calculated from the pressure data at 75-80˚ N, 5-30˚ E, providing the general wind characteristic of the archipelago and avoiding the influence of local topography on the wind statistics.
Wind direction distribution and monthly mean wind speeds at Svalbard, 1938–97. The data are generated from the NCAR re-analysis of monthly mean sea-level pressure.
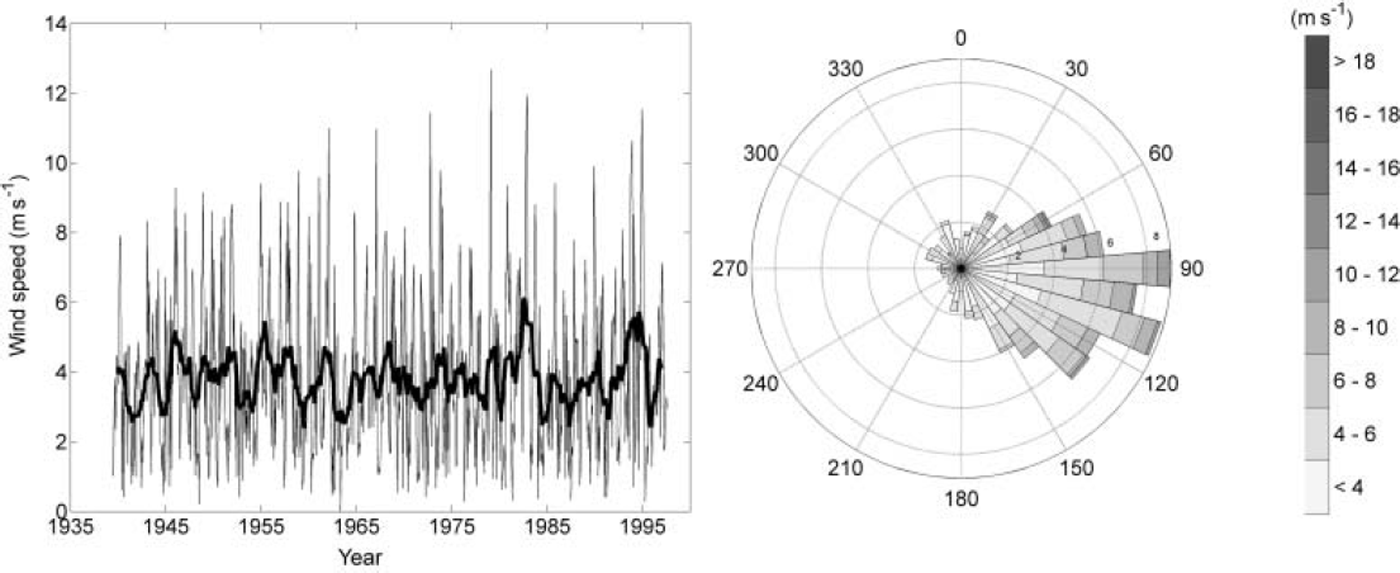
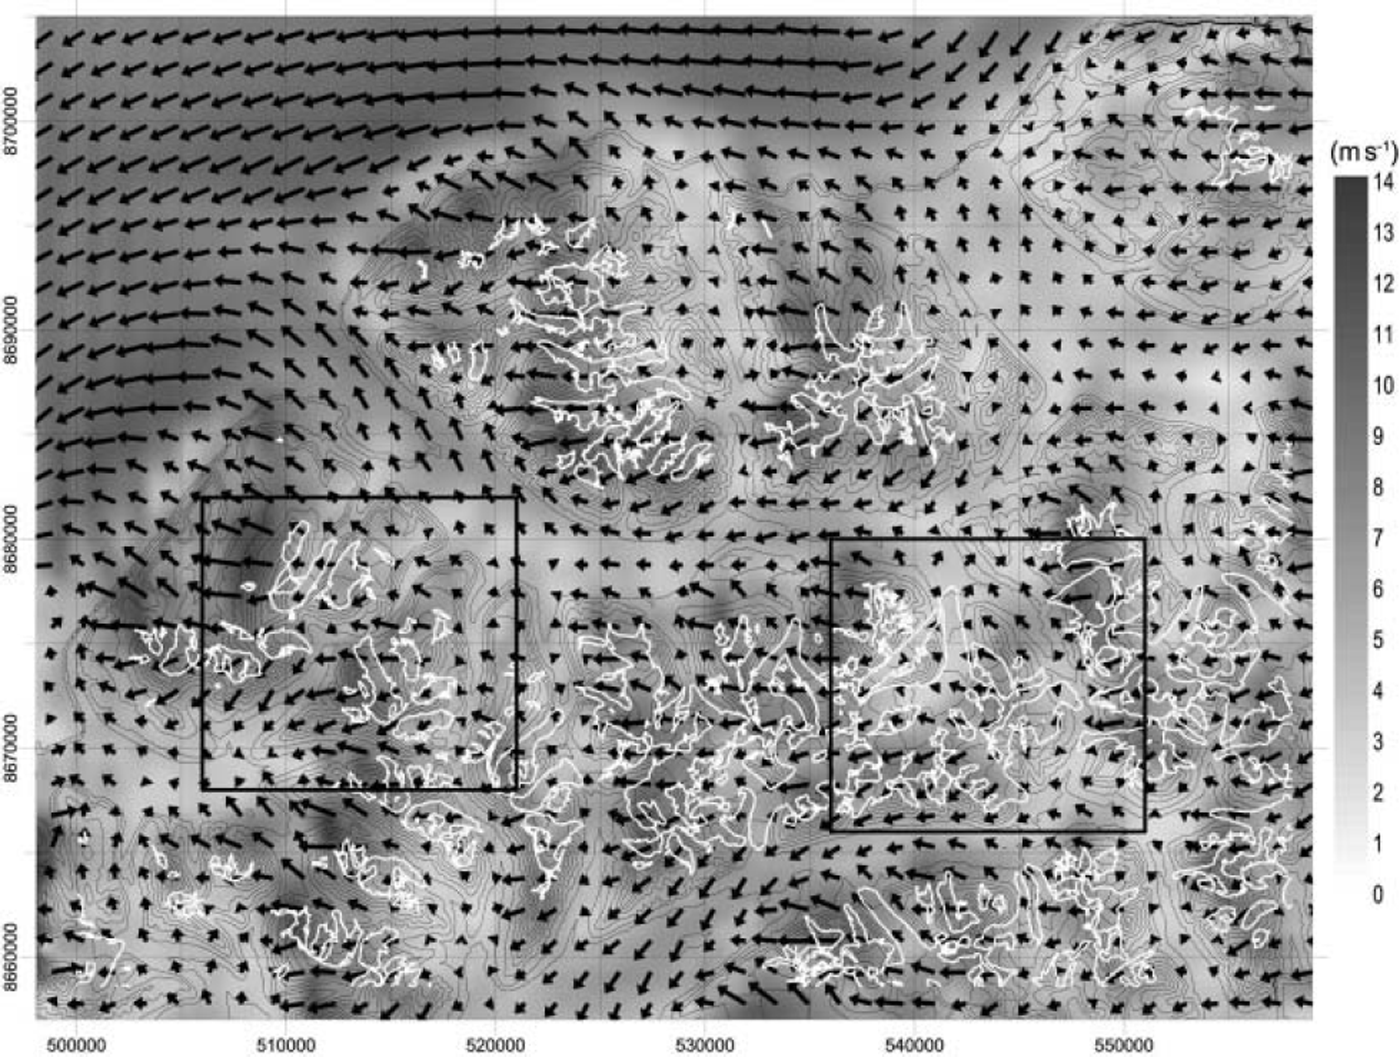
The results from the NCAR analysis are put into the same weather classes as for the sounding data. The distribution is then used to calculate a mean wind field for the study area, which represents the prevailing wind conditions in the study area for the past 60 years (Fig. 3).
Mean wind field, weighted by the NCAR re-analysis and glaciers in the study area. White lines indicate the glacier boundaries. The shading indicates the wind speed, arrows the wind vectors.
4. Drift Model
The applied snowdrift model, based on Reference Liston and SturmListon and Sturm (1998), is a one-dimensional model that calculates the equilibrium snowdrift flux in each gridcell based on the modelled wind fields. The drift model consists of two layers, a saltation (Reference Pomeroy and GrayPomeroy and Gray, 1990) and a suspension layer (Reference KindKind, 1990). The layers are coupled by boundary conditions defined by Reference Liston and SturmListon and Sturm (1998). The model includes a sublimation routine, which simulates the sublimation from the transported snow particles in the vertical column (Reference SchmidtSchmidt, 1972). The code was programmed following the formulation given by Reference Liston and SturmListon and Sturm (1998).
The model was run once for each of the 24 simulated wind fields, with the following parameters held constant: threshold friction velocity (0.25 m s–1), particle fall velocity (0.3 m s–1), air temperature (–15˚C) and relative humidity (80%).
By calculating the snowdrift flux gradients in the x and y directions, the change of mass M in time for each gridpoint is given by:

where Q salt is the snow mass flux due to saltation, and Q susp the snow mass flux due to suspension.
5. Results
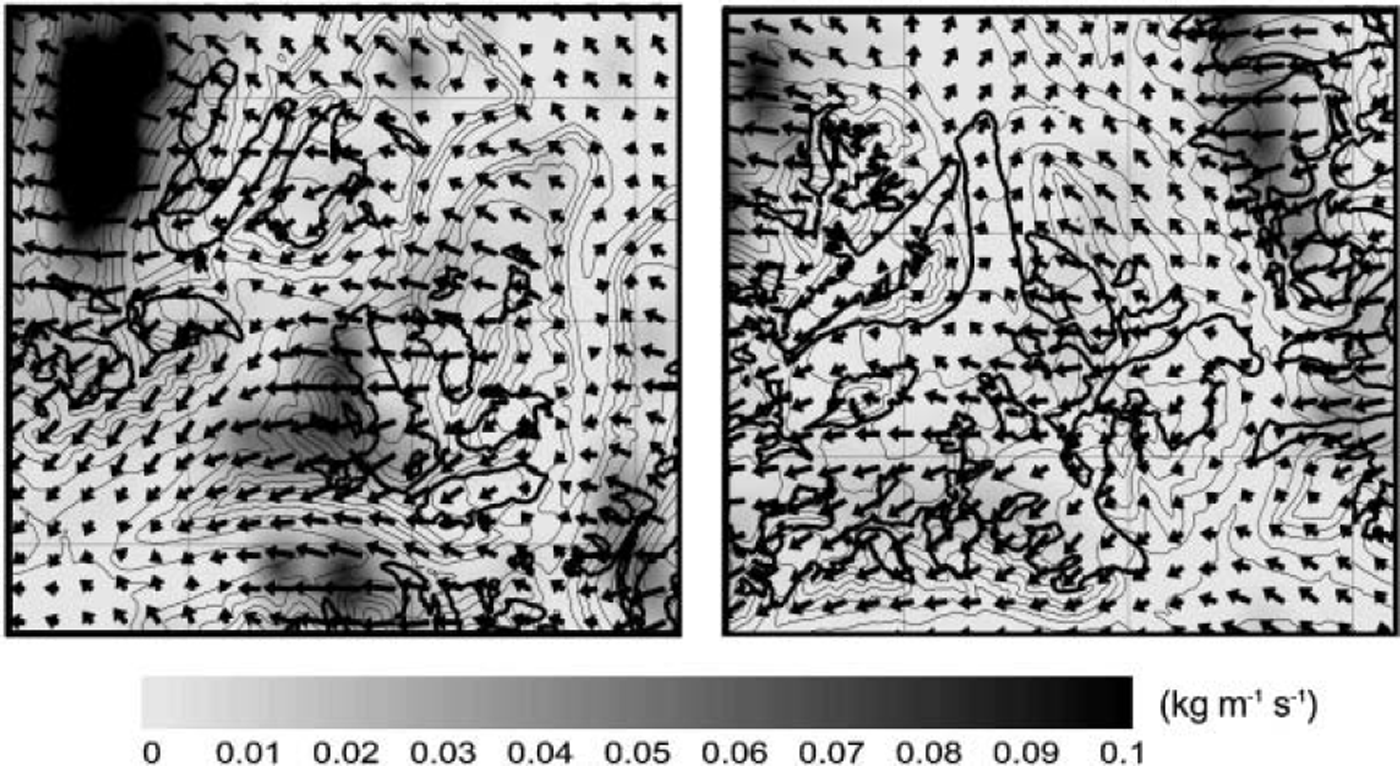
The wind model simulated 24 wind fields for three wind speeds and eight wind directions. The mean wind field, weighted by the NCAR wind speed and direction distribution, is shown in Figures 1 and 3. Wind speeds range from 2 to 14 ms–1 at 10m above ground. High wind speeds can mainly be observed on the mountain ridges, while low wind speeds occur in valleys and lee zones. The wind direction varies considerably, indicating canalized flow through the valleys as well as several recirculation zones (Fig. 3).
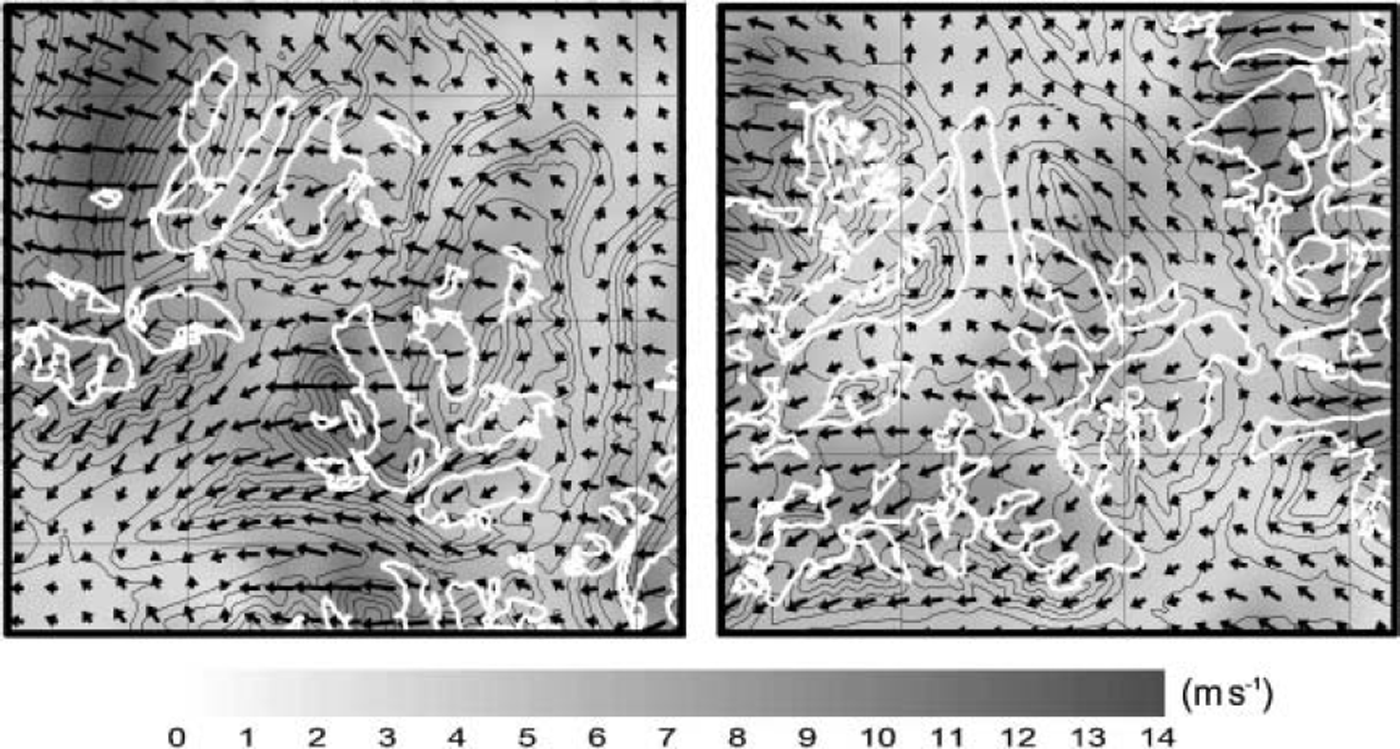
A detailed view of the mean wind field is given for two example areas (Fig. 4). A quantitative analysis of the model results (Table 1) shows that 78% of the glacier accumulation areas have wind speeds <8ms–1, while 80% of the nonglacierized areas are exposed to winds >8ms–1. At some locations, high wind speeds are observed on lee slopes.
Details of the wind field in the two example areas. The shading indicates the wind speed (ms–1). Black arrows show the wind vectors, white lines the glacier boundaries.
Results from the quantitative analysis of the model results. The results are given in per cent of the respective area
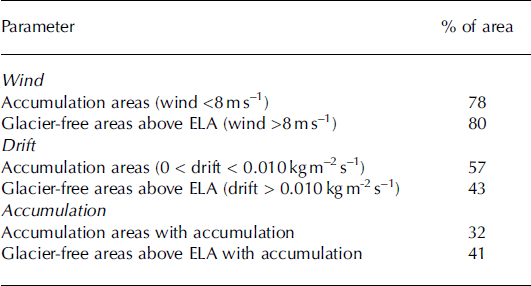
Figure 5 shows the drift fluxes in the two example areas. Since the drift fluxes are exponentially proportional to the wind speed, the differences between areas with low and high drift flux are much more pronounced than in the wind field. In areas with wind speeds under the threshold velocity ( ≈ 6 m s–1) no snowdrift occurs; 57% of the glacier accumulation areas show little or no drift.
Details of the drift flux in the two example areas. The shading indicates the flux concentration. Black arrows show the wind vectors, black bold lines the glacier boundaries.
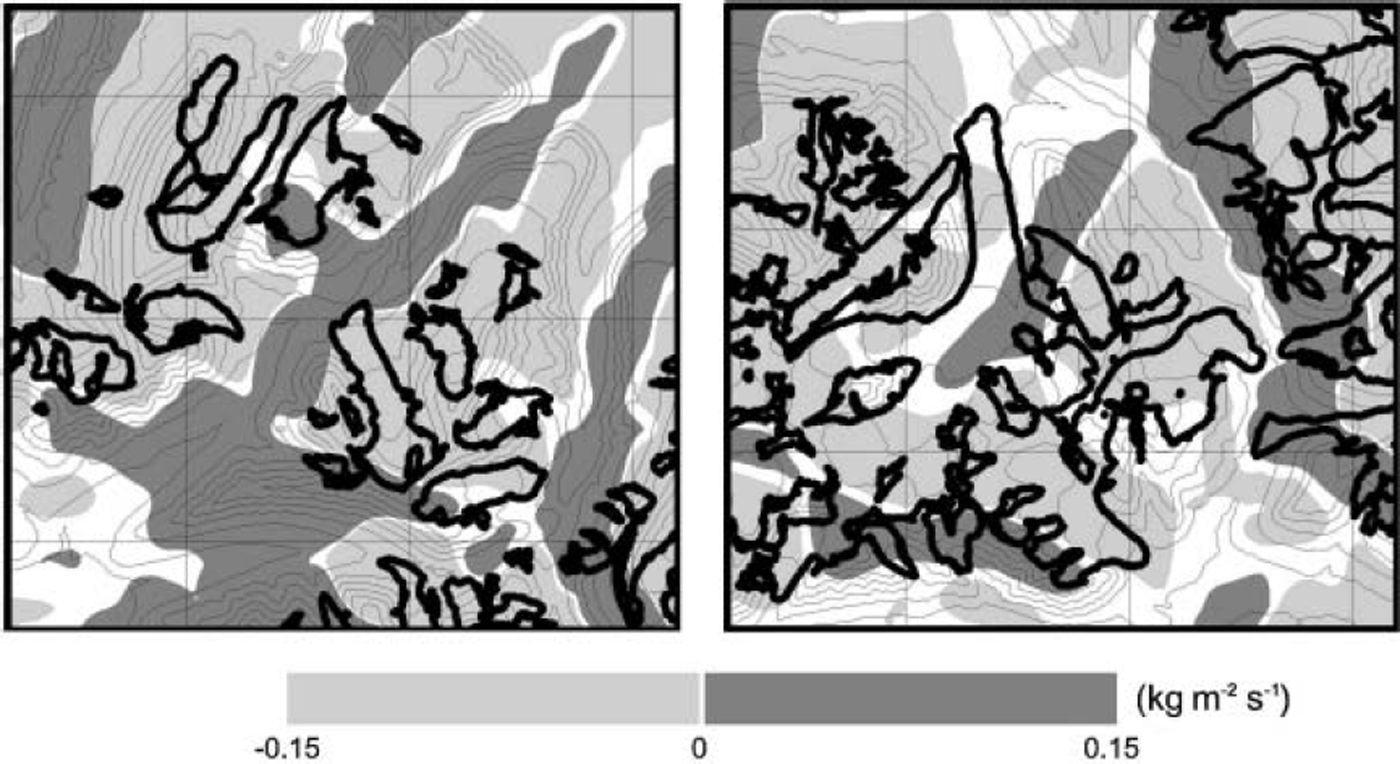
The erosion field in the two example areas is illustrated in Figure 6. Erosion occurs where the wind-speed gradient is positive, and the snow accumulates where the wind is slowing down, which occurs mainly on mountain slopes facing the local wind direction. The valleys are generally depicted as accumulation areas, while elevated areas such as mountain ridges experience erosion. The model produces accumulation only in 32% of the glacier accumulation zones, while 42% of the non-glacierized areas above the ELA experience accumulation.
Details of the accumulation/erosion pattern in the two example areas. Snow is accumulated in the dark shaded areas (positive) and eroded in the light shaded areas (negative). Black bold lines show the glacier boundaries.
6. Discussion
Since the erosion field was only calculated once for each of the 24 wind fields, there is no time development of the drift model parameters. During the winter, the threshold velocity should actually change with the changing snow surface properties, air temperature and relative humidity. The results presented in Figure 5 only depict a momentary picture of the drift fluxes in the mean wind field.
Nevertheless, the wind simulations for the study area represent a reasonable wind field; dominant winds from the east as well as known channelling effects along the valleys are well reproduced. A comparison with observed mean wind speeds at stations around Longyearbyen shows that wind speeds range within ± 3 0% of the observed long-term mean values. This is a very good result considering the relatively low resolution of the wind model.
The wind speed and direction vary significantly on lee slopes behind mountain ridges. High wind speeds often occur on lee slopes behind large mountains (Fig. 3). The wind speed alone explains about 80% of the glacierized and glacier-free areas above the ELA, yielding a very good model result for the relatively low model resolution of 750 m.
The drift model calculates the equilibrium snow mass transport at each gridpoint. Reference TakeuchiTakeuchi (1980) demonstrated that an equilibrium profile can be expected after a fetch of 200-400 m. Therefore, equilibrium is a fair assumption at a grid of 750 m as used in the simulations.
Since the wind speed often falls under the threshold value in large parts of the study area, the flux gradients here are close to zero, implying little or no snow transport in these areas, which is true for 57% of the glacier accumulation areas. In reality, much snow is transported during gusts, which are not included in the modelling. Most snow is accumulated on the west-facing slopes of the terrain (Fig. 6), which compares well to measurements of the snow distribution in the study area (Reference Jaedicke, Thiis, Sandvik, Gjessing, Hjorth-Hansen, Holand, Løset and NoremJaedicke and others, 2000).
When the accumulation and erosion areas (Fig. 6) are compared with the location of glaciers above the ELA, the results show poor agreement. Only 32% of these areas are modelled as snowdrift accumulation zones. Nevertheless, this only gives an indication of the snowdrift effect. Glaciations are still possible if the annual mass balance is positive in these areas.
The local topography influences not only the wind field but also the snow avalanche activity, the summer melting and winter precipitation. These factors are not considered in this study but might be the dominant processes for some locations.
7. Conclusion
The simulated wind speeds and drift fluxes show a close connection to the observed wind in the terrain and the location of glaciers in the study area. A significant transport of snow mass from erosion areas on the mountainside down to the glacier valleys can be found in the simulations. The simulation portrays maximum accumulation on west-facing slopes, in accordance with field observations. The highest spatial correlation is found between glacier locations and the modelled mean wind field. For a detailed erosion and accumulation pattern, a model resolution much higher than the applied 750 m is needed. On the other hand, it will be even more difficult to couple high-resolution simulations of local wind field to observed long-term wind climate. For some glacier locations, terrain properties as well as local variations of precipitation and melting appear to dominate over the influence of snowdrift.
In future studies, it will be possible to quantify the amount of snow mass added to the glaciers by drifting snow with the help of high-resolution regional meteorological models that also include the effects of temperature and precipitation.
Acknowledgements
Thanks to O. Brandt for field assistance, and the technical department at The University Courses on Svalbard (UNIS) for support. We also thank H. Bjørnsson and J. Kohler for constructive remarks, and an anonymous referee for help in improving the manuscript. The Norwegian Polar Institute provided the topographic data. The work was funded by the Norwegian Research Council, and Norwegian Geotechnical Institute. The wind-field simulations were made using the Advanced Regional Prediction System developed by CAPS, University of Oklahoma. CAPS is supported by the US National Science Foundation and the Federal Aviation Administration through combined grant ATM92-20009.



