I. INTRODUCTION
Plastic deformation in nanocrystalline metals is known to be strongly time-dependent. This viscoplasticity manifests itself as a high degree of strain rate sensitivity (SRS) and susceptibility to creep and stress relaxation even at room temperature. Numerous studies have reported on creep behavior Reference Wang, Wang, Aust and Erb1–Reference Cai, Kong, Lu and Lu5 and SRS Reference Wei, Cheng, Ramesh and Ma6–Reference Li, Mueller, Höppel, Göken and Blum10 of nanocrystalline materials using conventional tensile or compression tests on bulk specimens. Stress relaxation properties, on the other hand, have not received as much attention, with very few studies Reference Wang, Hamza and Ma9,Reference Wang, Hamza and Ma11,Reference Lu, Zhu, Shen, Dao, Lu and Suresh12 reported. Time-dependent deformation is an important criterion for designing microcomponents made up of nanocrystalline materials. Both creep and stress relaxation contribute, in a convoluted manner, toward the failure of nanocrystalline metal microcomponents when placed under contact stresses.
Typically, time-dependent deformation like creep, stress relaxation, and SRS are measured at constant stress, strain or strain rate conditions, respectively, on multiple samples, and often at various temperatures. The extracted activation parameters from these measurements are referred to as “apparent” activation parameters (apparent activation energy, apparent activation volume). They are termed as “apparent” parameters because the microstructure, comprising of dislocation density, grain boundary arrangements, grain sizes, etc., is not held constant in these tests. Consequently, for the same material, their values can vary depending on the microstructural state of the specimen during the test. In contrast, the “effective” (also referred to as “true” or “physical”) activation parameters, which are obtained from constant microstructure tests, are considered to be more consistent and reliable. The apparent activation parameters can be remarkably different from the effective activation parameters in certain cases, e.g., rapidly evolving microstructure. Using the apparent activation parameters for interpreting the operative deformation mechanisms can be misleading in such cases. To overcome this limitation of conventional time-dependent tests, repeated transient tests were developed to extract effective activation parameters directly.
Repeated transient tests refer to any time-dependent (transient) test in which one of the boundary conditions is changed instantaneously while keeping the microstructure constant. One of the first systematic boundary condition change tests was reported by Cottrell and Stokes Reference Cottrell and Stokes13 where they varied the temperature of the aluminum specimens by purging the sample bath with oil preheated to different temperatures. This enabled them to separate and study the reversible and irreversible changes in flow stresses with temperature. Although this was an interrupted test, the core idea of a sudden boundary condition change was subsequently extended to design strain rate jump tests Reference Bochniak14 and repeated stress relaxation and creep tests Reference Caillard and Martin15 because changing the temperature instantaneously during a test is not possible.
With electrodeposition and sputtering emerging as promising techniques for fabrication of controlled nanocrystalline and nanotwinned microstructures in thin films and coatings, it has become imperative to adapt these repeated transient tests to smaller length scales. With unprecedented load and displacement resolution, instrumented indentation offers a unique opportunity to study the small strain rates (or stress changes) typically associated with time-dependent transient tests. It offers the additional advantage of obtaining better statistics on measurements in a high throughput manner since sample preparation is not exhaustive and sample-to-sample variation is not a concern any more. Numerous studies have reported on creep Reference Wang, Zhang and Nieh16,Reference Asif and Pethica17 and SRS Reference Schwaiger, Moser, Dao, Chollacoop and Suresh18–Reference Wheeler, Maier, Durst, Göken and Michler20 exponents using nanoindentation. The most noteworthy among these is the strain rate jump test technique developed by Maier et al. Reference Maier, Durst, Mueller, Backes, Höppel and Göken19 that demonstrated the first successful extraction of SRS parameters using nanoindentation which matched with bulk compression test results. With respect to the other two transient test types, there is still lack of consensus in the nanomechanics community on the validity and interpretation of the parameters extracted using nanoindentation. Reference Goodall and Clyne21 Nanoindentation stress relaxation data for metals are almost non-existent. One study did report on the viscoelastic properties of polycarbonate using nanoindentation stress relaxation and creep. Reference Schiffmann22
While the indentation method is particularly useful for thin films, where conventional testing is difficult or impossible, the interpretation of the indentation results can be difficult due to the complex graded stress state, and the nearly instantaneous onset of large-strain plasticity. The micropillar compression technique, also performed with a nanoindenter by changing the pyramidal or spherical tip with a flat punch, is advantageous due to the relatively simple, well understood uniaxial stress state in pillars. It has emerged as a novel technique to investigate mechanical properties in small volumes. Reference Uchic and Dimiduk23,Reference Uchic, Shade and Dimiduk24 There have been numerous studies on uniaxial creep measurements on micropillars. Reference Wang, Lai, Huang and Nieh25,Reference Özerinç, Averback and King26 Wang et al. Reference Wang, Lai, Huang and Nieh25 compared micropillar and nanoindentation creep behavior of nanocrystalline Ni and found similar creep exponents. Özerinç et al. Reference Özerinç, Averback and King26 used a MEMS (micro-electro-mechanical system) doubly-fixed cantilever beam arrangement to apply constant force on the micropillars to study creep behavior of an amorphous alloy under ion irradiation. Mohanty et al. Reference Mohanty, Wheeler, Raghavan, Wehrs, Hasegawa, Mischler, Philippe and Michler27 demonstrated micropillar strain rate jump tests on nanocrystalline Ni from 25 to 100 °C and successfully extracted SRS exponents and activation parameters as a function of temperature which closely matched with existing literature values. Wehrs et al. Reference Wehrs, Mohanty, Guillonneau, Taylor, Maeder, Frey, Philippe, Mischler, Wheeler and Michler28 extended this study by directly comparing strain rate jump test results from miniaturized tensile, micropillar compression, and nanoindentation measurements performed on the same nanocrystalline nickel specimen to get rid of sample-to-sample variation. They found almost identical strain rate exponents and apparent activation volumes conclusively validating the microcompression technique as a method to explore SRS of thin films. However, to the best of our knowledge, the micropillar technique has not yet been used to study stress relaxation behavior of hard materials. The only reported study utilizing the micropillar technique for studying stress relaxation properties deals with measuring viscoelasticity in soft materials, such as polydimethylsiloxane. Reference Lin, Liao, Chen and Zhang29 The forces were quite large (∼20 N), test duration really short (5 s) and the time-dependent evolution was substantial (10% force decay in 5 s)—all factors less demanding on the test instrumentation. No validation was performed with bulk test results to compare the accuracy of extracted parameters from microcompression in this case. This leaves the field wide open for development and validation of small scale stress relaxation tests, in particular for micropillars.
The current work aims to develop micropillar stress relaxation test and demonstrate the validity of this technique on electrodeposited nanocrystalline nickel film, an extensively studied material that can be considered as a model material for this study. For comparison purposes, stress relaxation measurements will also be performed on miniaturized tensile specimens to provide “reference” experimental data from “bulk testing” conditions. The experimental considerations, micropillar testing technique, and data analysis methodology involving such a micrometer-scale study will be discussed. Repeated stress relaxation tests will be used to directly extract effective activation parameters. These will be compared with the apparent activation parameters deduced from single relaxation segments to understand the offset between these two parameters. Finally, the results from micropillar stress relaxation will be compared with micropillar strain rate jump tests, Reference Wehrs, Mohanty, Guillonneau, Taylor, Maeder, Frey, Philippe, Mischler, Wheeler and Michler28 performed previously on the same batch of samples as reported here, to compare the two microscale repeated transient test methods directly. It is hoped that this study will establish micropillar stress relaxation test as a reliable technique for studying time-dependent properties in metals at small length scales.
A. Theory of time-dependent metal plasticity
Stress decay tests have been used for well over half a century to understand time-dependence of deformation. The theoretical basis for the interpretation of these tests has been the subject of several reviews Reference Dotsenko30,Reference Guiu and Pratt31 and a book. Reference Caillard and Martin15 Because the data analysis is central to the current study, the core concepts will be briefly reviewed.
In the classical context of a network of mobile dislocations that glide in a forest of obstacles, the Orowan equation shows that the shear strain rate
 $\dot \gamma$
on a slip plane is directly proportional to the mobile dislocation density ρm and the average dislocation velocity v:
 $$\dot \gamma = A{\rho _{\rm{m}}}bv\quad ,$$
where A is a geometric factor and b is the dislocation Burgers vector. The Orowan equation, therefore, correlates the external experimental variable (shear strain rate) with the internal microstructure (mobile dislocation density and their average velocity). At constant strain rate, either both ρm and v are held constant or both of them are changing in such a fashion that their product is constant. At certain strain value (or an infinitesimally small change in strain) in a constant strain rate test, both ρm and v, and consequently, the internal microstructure, can be assumed to be held constant. In other words, ensuring constant strain rate across the boundary change in a repeated transient test is necessary for a constant structure test. This condition is invalidated in a repeated strain rate jump test, the most widely studied transient test, because the strain rate is varied. In such a scenario, it is not possible to specifically attribute the observed change in stress to variation in mobile dislocation density or average dislocation velocity, or both, which precludes extraction of effective activation parameters from a strain rate jump test. In contrast, these can be determined from a repeated stress relaxation test which makes these tests attractive for studying operative deformation mechanism(s).
Up to this point, the discussion mainly involved thermal activation of dislocations in a classical context which is more applicable to large-grained metals. However, intragranular dislocation activity might not be the dominant contributing mechanism toward overall strain in nanocrystalline metals that have very small grain sizes. Dislocation propagation hindered by grain boundaries, Reference Van Swygenhoven, Derlet and Frøseth32–Reference Brandstetter, Budrović, Van Petegem, Schmitt, Stergar, Derlet and Van Swygenhoven34 grain boundary sliding, grain boundary migration Reference Gianola, Van Petegem, Legros, Brandstetter, Van Swygenhoven and Hemker35 and possibly dislocation nucleation, and grain boundary diffusion might be operative as well. Therefore, a more general framework for thermally activated mechanisms will be considered henceforth to accommodate all of these possible mechanisms into the analysis framework.
For any thermally activated deformation mechanism, the shear strain rate can be expressed in terms of an attempt frequency in an Arrhenius form as:
 $$\dot \gamma = {\gamma _0}\,{\rm{exp}}\left( {{{ - \Delta G} \mathord{\left/ {\vphantom {{ - \Delta G} {kT}}} \right. \kern-\nulldelimiterspace} {kT}}} \right)\quad ,$$
where ΔG is the Gibbs energy barrier for the thermally activated deformation mechanism to overcome its obstacle/barrier, k is the Boltzmann constant, and T is the absolute temperature. This energy barrier can be reduced by the application of stress, such that:
 $$\Delta G = \Delta {G_0} - \tau V\quad ,$$
where ΔG 0 is the stress-free energy barrier, τ is the applied shear stress, and V is the activation volume. The activation volume, strictly speaking, is the derivative of Gibbs free activation energy with respect to applied stress. For the time being, a generic activation volume V will be used. Subsequently, in the discussion, apparent and effective activation volume will be distinguished. The activation volume can be inferred from strain rate jump tests, creep tests, or stress relaxation tests. In all three methods, V is deduced from the following manipulation of Eqs. (2) and (3):
 $$V = kT{{\partial \ln \,\dot \gamma } \over {\partial \tau }}\quad .$$
It should be noted that Eqs. (2) and (3) apply to any thermally dependent plasticity mechanism, as stated before. The activation volume is therefore a generic concept for all deformation mechanisms. Typically, the activation volume is denoted in terms of cubic Burgers vector and can be used to identify the operative deformation mechanisms: dislocation kinks have small activation volumes in the range of 10 b 3 whereas dislocation–dislocation interactions in forest hardening have much larger activation volumes, characteristically around 1000 b 3. Reference Meyers, Mishra and Benson36
While the values obtained for the activation volume should be similar for the three methods (assuming that the same rate-controlling mechanism is operative in all), they may not be identical due to differences in the boundary conditions for evolution. The activation volume associated with stress relaxation under constant-strain conditions will be considered here. With constant strain, the decay in shear stress Δτ varies with time t according to Reference Caillard and Martin15 :
 $$\Delta \tau = - {{kT} \over {{V_{\rm{a}}}}}{\rm{ln}}\,\left( {1 + {t \over c}} \right)\quad ,$$
where V a is the apparent activation volume under stress relaxation conditions and c is a time constant. This apparent activation volume is only an approximation for the effective activation volume associated with plasticity, in part because the material microstructure (e.g., dislocation content, grain boundary arrangement, etc.) is evolving during the measurement.
The repeated relaxation test method was developed to measure the effective activation volume directly under nominally “constant” microstructural conditions. In a repeated relaxation test, constant-strain relaxation is measured 4–6 times in sequence, and in between each relaxation segment, the sample is reloaded under nominally elastic loading back to the initial stress condition.
Reference Spätig, Bonneville and Martin37
The effective activation volume during the jump is estimated by the ratio of the shear strain rate at the beginning of the next relaxation segment,
 ${\dot \gamma _{{\rm{i2}}}}$
, relative to the shear strain rate at the end of the first relaxation segment,
 ${\dot \gamma _{{\rm{f1}}}}$
, where the two segments are separated by nominally elastic loading and an increase in stress
 $\Delta {\tau _{{\rm{i2}} - {\rm{f1}}}}$
:
 $${V_{\rm{e}}} = kT{{\ln \,\left( {{{{{\dot \gamma }_{{\rm{i2}}}}} \mathord{\left/ {\vphantom {{{{\dot \gamma }_{{\rm{i2}}}}} {{{\dot \gamma }_{{\rm{f1}}}}}}} \right. \kern-\nulldelimiterspace} {{{\dot \gamma }_{{\rm{f1}}}}}}} \right)} \over {\Delta {\tau _{{\rm{i2}} - {\rm{f1}}}}}} = kT{{\ln \,\left( {{{{{\dot \tau }_{{\rm{i2}}}}} \mathord{\left/ {\vphantom {{{{\dot \tau }_{{\rm{i2}}}}} {{{\dot \tau }_{{\rm{f1}}}}}}} \right. \kern-\nulldelimiterspace} {{{\dot \tau }_{{\rm{f1}}}}}}} \right)} \over {\Delta {\tau _{{\rm{i2}} - {\rm{f1}}}}}}\quad .$$
The shear strain rate is related to the shear stress rate in a relaxation test by the following equation:
 $$\dot \gamma = {{ - \dot \tau } \over M}\quad ,$$
where M is the elastic modulus of the sample-machine assembly. M is calculated from the loading/unloading stiffness without performing any instrument compliance correction.
Within a given relaxation transient, the instantaneous rate of change in the shear stress can be estimated from the derivative of Eq. (5), and the fit values for the apparent activation value and time constant:
 $$\dot \tau \left (t \right) = - {{kT} \over {{V_{\rm{a}}}}}{1 \over {\left( {c + t)} \right}}\quad .$$
This nearly instantaneous measurement of effective activation volume is also less sensitive to sources of instrumentation error such as drift. It should be noted that it is possible to extract the effective/true activation volume from a repeated stress relaxation test because previous studies Reference Caillard and Martin15 have demonstrated that the plastic strain rate does not change across a stress jump segment suggesting that the microstructure is held constant.
II. EXPERIMENTAL
A. Material
A thick film of nominally pure nanocrystalline nickel was electroplated on a silicon wafer using a proprietary deposition process. The UV-LIGA method (Ultraviolet Lithographie, Galvanoformung, Abformung) Reference Saile, Saile, Wallrabe, Tabata and Korvink38 was utilized to produce individual free-standing, dogbone-shaped microtensile bars, as shown in the inset of Fig. 2. The samples had a gauge length of 3.0 mm, gauge width of 0.15 mm, and thickness of 0.25 mm. The top surface of the deposited samples was fine polished using standard metallographic techniques to reduce surface roughness. Film chemistry was measured by Glow Discharge Optical Emission Spectroscopy (GDOES) using a JY 5000 RF instrument (HORIBA Jobin Yvon SAS, Longjumeau Cedex, France). The composition was measured to be Ni = 99.81, S = 0.06, C = 0.04, remainder = 0.09 (mass%).
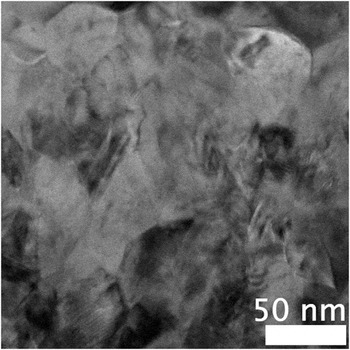
To characterize the material's microstructure and grain size, transmission electron microscopy (TEM) was performed. TEM lamellae were fabricated by the focused ion beam (FIB) lift-out technique Reference Giannuzzi and Stevie39 using a Vela dual-beam FIB (TESCAN s.r.o., Brno, Czech Republic). To limit the extent of ion beam damage, the surface of the deposit was coated with a 2 µm platinum protective layer, using a gas injection system. For final polishing of the lamellae, a 5 kV ion beam was used at 1° incidence to the lamellae surfaces. The sample was imaged with a JEM-2200FS TEM (JEOL Ltd., Tokyo, Japan) operated in scanning transmission electron microscopy (STEM) mode at 200 kV and 0.7 nm spot size. As can be seen from Fig. 1, the material has a homogeneous nanostructure without showing any anomalously large grains. The grain size distribution, with an average grain size of 26 ± 10 nm, was calculated for over 50 grains applying grain area analysis using ImageJ software package.
Grain structure of electroplated nanocrystalline Ni characterized by bright field scanning TEM.

B. Miniature tension experiments
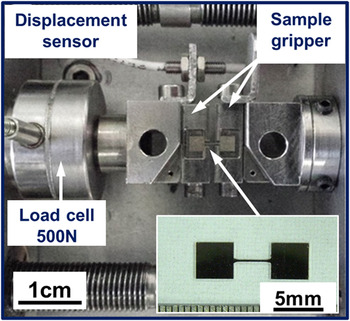
Displacement-controlled miniature tensile experiments were performed to provide an independent verification of the “bulk” mechanical response of the nanocrystalline Ni that can be compared with the micropillar tests. A commercially available Kammrath & Weiss in situ tensile stage with a nominal maximum load capacity of 25 kN was adapted for testing the aforementioned microtensile bars. Reference Philippe, Schwaller, Bürki and Michler40 The setup consists of a spindle driven crosshead as shown in Fig. 2. Displacement speeds can be set in the range from 0.05 to 20 μm/s. A compact load cell (Measurement Specialties Ltd., Hampton, VA) with a noise floor of 0.03 N and a maximum load of 500 N was installed for load measurements. Custom-made hard metal sample grippers allow easy sample mounting from the top without locking or clamping. This prevents accidental damage of the fragile gauge sections. An inductive displacement sensor is directly attached to the sample grip support. However, this sensor is only used as a reference signal for applying desired displacement rates during the experiment.
Miniaturized tensile stage with 500 N load cell, displacement sensor, and hard metal grippers. The inset shows a nanocrystalline nickel microtensile bar produced using LIGA process.

Reference measurements at the desired testing load were conducted on zero gauge tensile bars cut from hot rolled maraging steel by means of micro electrical discharge machining. The steel samples did not show any stress relaxation since their grain size is in the range of several micrometers. Due to the much larger gauge cross section, the applied load resulted in stresses well below 10% of the maraging steel's elastic limit.
C. Micropillar compression experiments
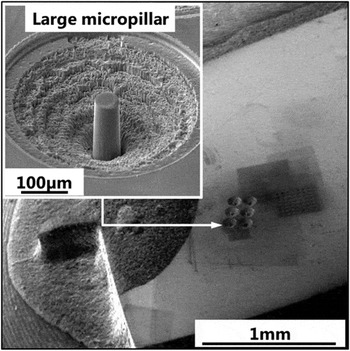
Micropillars were milled in the undeformed gripping section of one of the tested tensile bars using a Tescan Lyra Gallium FIB system (Fig. 3). A four step milling procedure was chosen beginning with coarse milling at 16 nA beam current and followed by two intermediate milling steps at 4.2 and 1 nA, respectively. Final surface polishing was done at 0.25 nA. The approximate pillar dimensions were 30 μm tall and 10 μm diameter, as shown in the inset of Fig. 3. These pillars are much larger than most pillars produced by FIB, requiring ∼10 h each of dedicated FIB time for the manufacture. The large size was chosen to minimize the impact of thermal drift on the short-term relaxation measurements. This allows us to perform multiple experiments on one single sample and enhances the comparability of experimental results between the bulk tensile and microcompression tests by reducing variations in microstructure and composition.
A large FIB milled micropillar of nanocrystalline Ni machined in the undeformed gripping section of a microtensile bar after it was tested in tension for stress relaxation.

Micropillar compression experiments were performed using a custom in-situ scanning electron microscope (SEM) micromechanical testing system based on a commercial micro- and nano-indentation system from Alemnis, the details of which have been reported previously. Reference Wheeler and Michler41 The Alemnis system is particularly well suited for load-relaxation experiments because it is intrinsically a displacement-controlled device, and is very stable over long periods of time with little susceptibility to time-dependent drift. The SEM has the advantage of a direct visual observation before, during, and after the relaxation experiment. This allows direct confirmation of reasonable alignment (at least in one axis), quality of the pillar, and absence of unwanted spurious features such as debris. It also allows for the observation of surface evolution during deformation, such as the emergence of slip steps, shear bands, or grain boundary relief.
By providing sufficient stabilization times (∼12 h), it was ensured that the load and displacement drift rates were below 10 µN/min and 5 nm/min, respectively. For comparison with experimental data, the drift rates were 0.1% and 0.8% of the load and depth, respectively, for the first relaxation segment. Similar to the tensile tests, a dummy steel sample was elastically loaded to assess machine frame relaxation which was found to be extremely small. Nevertheless, this was subtracted from the experimental data. A 15 μm diameter diamond flat punch was used to compress the pillars. The compression tests were performed in displacement-controlled mode. Multiple repeated stress relaxation tests were performed on these micropillars with each repeated relaxation segment separated from others by sufficient plastic strain. The loading strain rate was 0.001 s−1 in all cases.
III. RESULTS
A. Miniature tension
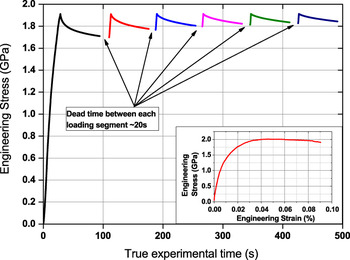
We discuss the results of miniature tension experiments, which are more conventional and extensively studied tests, before moving on to the microcompression results. A consecutive series of six load-relaxation sequences were performed in uniaxial tension on a total of three microtensile specimens. Figure 4 shows a representative example of the experimental results obtained from one specimen where the engineering stress is plotted over the true experimental time. Due to limitations of the experimental setup, the relaxation segments had to be performed individually. As a consequence of that, a dead time of approximately 20 s between each segment. Each segment starts at the same stress of 1.925 GPa with a duration of 60 s. As shown in the inset of Fig. 4, which shows the stress–strain curve of the examined nanocrystalline nickel obtained from a constant strain rate tensile test, this stress is well above the 0.2% offset yield strength of 1.25 GPa but is still in the low strain regime where substantial work hardening is observed.
Repeated stress relaxation test on miniaturized tensile bar of nanocrystalline Ni. A consecutive series of six relaxation sequences were performed. The inset shows the stress–strain curve for this sample.

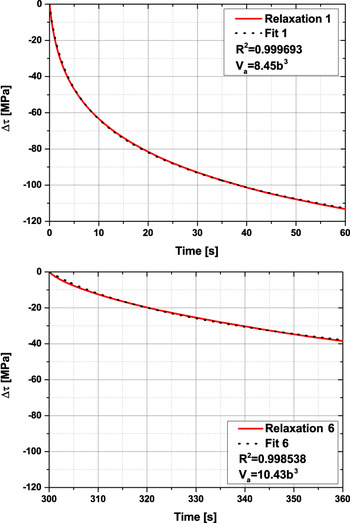
Each individual relaxation segment was fit to the logarithmic decay function suggested by Eq. (5) by applying a least squares algorithm. Figure 5 shows two representative examples of the fit for the first and the last relaxation segments for this specimen, respectively. The raw data (red curve) and the fit (black dots) are in excellent agreement, providing correlation coefficients of R 2 > 0.99 in all cases.
Examples of the fit to extract the apparent activation volume and time constant for two different relaxation segments. The apparent activation volumes for these two fits were 8.5 and 10.4 b 3, respectively.

B. Micropillar compression
A series of several repeated relaxation experiments were performed on each micropillar. In total, up to 25 relaxations were measured on each pillar, in groups of five repeated stress relaxations. An example of the repeated pillar relaxation curves is shown in Fig. 6. The dwell time for each relaxation measurement was 60 s. After measuring the relaxation for the first 60 s, the pillar was reloaded to the same stress level and another 60 s relaxation measurement was performed. The 25 relaxation measurements were identified by a two-digit index—for example, R11 corresponds to the 1st relaxation segment of the 1st group of 5, and R53 corresponds to the 3rd relaxation segment of the 5th group of 5, as shown in Fig. 6.
Multiple repeated stress relaxation tests performed on a single micropillar of nanocrystalline Ni. Note that the stress-strain curves have been corrected for instrument compliance. This results in constant displacement relaxation segments to show up as increasing strain segments during the relaxation hold period. Examples of relaxation segments below the 0.2% offset yield and in the fully plastic flow regime are shown.

Nearly all prior stress relaxation studies only examined time-dependent plasticity in the work hardening regime at strains >>1%. However, in this study, stress relaxation was measured even at stresses below the 0.2% offset yield strength. The observed stress relaxation was found to be significant under constant displacement: even well below the 0.2% offset yield strength, the stresses relax by ∼4% within a min; in the work hardening regime, stress relaxes by ∼9% in 1 min. Substantial relaxation at such low strains provides further confirmation that plasticity readily occurs well below the typically reported values for yield strength in nanocrystalline metals.
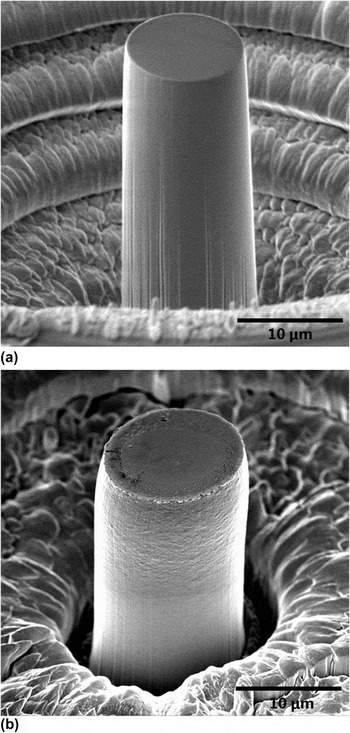
The SEM allows the direct observation of the shape of the micropillar during all stages of the compression experiment. Predeformed pillar and a pillar compressed up to 10% strain are shown in Fig. 7. The images were carefully analyzed during the relaxation segments and, as expected, there was no discernable change in the pillars during relaxation.
SEM images of the micropillar (a) before compression and (b) at strain of 20%.

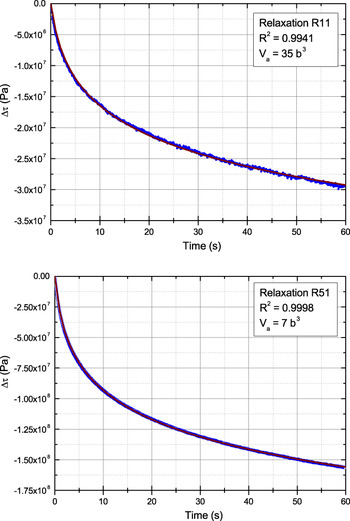
Each of the individual relaxation segments was fitted to the logarithmic decay function using a minimum least squares method to estimate the values for the apparent activation volume and the time constant. Examples of the fit are provided in Fig. 8. Generally the correlation coefficients for the fits for each relaxation curve were very good, with R 2 > 0.99. Only in a few cases were the correlation coefficients <0.99. Specifically, the relaxation segments R13, R14, and R15 had correlation coefficients of 0.97–0.90, likely because the relaxation behavior was very shallow (∼0.2 MPa/s), such that contributions from instrumental drift were no longer negligible. These suspicious relaxation curves were excluded from detailed analysis of activation volume.
Examples of raw data and fits for two relaxation segments (R11 and R51). The correlation coefficients for these fits were 0.99.

IV. DISCUSSION
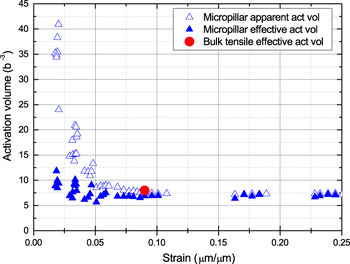
For both tensile and micropillar compression tests, the apparent activation volume was determined for each stress relaxation segment by fitting the experimental data to Eq. (5), while the effective activation volume was determined based on the jumps between relaxation segments using Eq. (6). The plot of apparent and effective activation volume as a function of engineering strain, for both the test methods, is shown in Fig. 9.
Apparent and effective activation volumes from micropillar multiple repeated stress relaxation tests. The effective activation volume obtained from tension test is also shown.

The apparent activation volume shows a strong strain dependence in the low strain regime, transitioning from ∼35 to 40 b 3 at ∼2% strain, to values of 11–13 b 3 at ∼4% strain. In spite of this sharp transition, the apparent activation volume becomes remarkably stable at strains in excess of 8%, always producing a value of 7–8 b 3. The effective activation volume, on the other hand, shows little or no strain dependence over the entire range of strain. The effective activation volume is always lower than the apparent activation volume, but the difference is large at low strains and becomes almost negligible at strains ≳8%. This observation is important in the context of nanoindentation and micropillar transient tests, particularly at low strains closer to the elastic regime. Drawing conclusions on the operative deformation mechanisms from apparent activation volumes from such tests can be highly erroneous. This might also partly explain why nanoindentation results from shallow depths result in large creep exponents and higher activation volumes. These micropillar results also suggest that for development of indentation based stress relaxation tests, particularly with spherical indenters, repeated transient tests seem the most promising way forward.
One possible interpretation of Fig. 9 is that the operative deformation mechanisms do not change significantly over the entire range of strains from 1 to 25%, hence, the stable effective activation volume measured using essentially instantaneous jumps. The elevated apparent activation volumes at small strains can be visualized as an artifact induced by the evolving microstructure. At such low strains, the deformation microstructure (e.g., dislocation content, grain boundaries, etc.) is limited and evolves rapidly during the 60 s transient used to measure the apparent activation volume. At higher strains, more deformation sources become activated, and, therefore the microstructural evolution is, relatively, not as substantial over the same period of time. Moreover, at these high strain levels, the deformation substructure is relatively constant, and there is no strain-dependent evolution analogous to forest hardening in large grained metals. In fact, nanocrystalline metals do not exhibit strain hardening behavior. Reference Meyers, Mishra and Benson36
The stress relaxation test described in the current study is one of several manifestations of viscoplasticity. The mechanism that gives rise to stress relaxation will also give rise to SRS and creep behavior. Thus, a similar activation volume for the viscoplastic mechanism should be attainable through constant-strain stress relaxation tests, constant-stress creep tests, or strain rate jump tests. In fact, Eq. (6), which was initially presented for the interpretation of repeated stress relaxation segments, can also be applied to estimate the activation volume for a strain rate jump test where the instantaneous change in strain rate leads to an abrupt change in flow stress. Since strain rate jump test cannot be considered as a constant microstructure test, as explained earlier due to varying strain rates across the jumps, the extracted activation volumes will be apparent volumes. Micropillar strain rate jump tests Reference Wehrs, Mohanty, Guillonneau, Taylor, Maeder, Frey, Philippe, Mischler, Wheeler and Michler28 were previously performed on the same batch of electroplated nanocrystalline nickel and yielded apparent activation volumes of 10 b 3 (more specifically, 9.9 ± 0.6 b 3). In agreement with the stress relaxation results presented here (Fig. 9), the apparent activation volumes from strain rate jump tests are slightly higher in comparison to the stress relaxation effective activation volumes. Directly comparing micropillar strain rate jump and stress relaxation test results on the same batch of nanocrystalline Ni samples provides an additional internal consistency on the validity of the developed stress relaxation technique.
The activation volume provides a scalar metric that can be used to interpret the most dominant deformation mechanism(s). While the current technique of micropillar stress relaxation is new, apparent activation volumes on nanocrystalline nickel in the range of 10–20 b 3 have previously been reported from other groups using both bulk and micromechanical strain rate jump tests. Reference Wang, Hamza and Ma9,Reference Maier, Durst, Mueller, Backes, Höppel and Göken19 These results also compare reasonably well with effective activation volume of ∼10 b 3 reported by Wang et al. Reference Wang, Hamza and Ma11 from bulk repeated stress relaxation measurements. Activation volumes of ∼10 b 3 have also been reported for other nanocrystalline face centered cubic (fcc) metals. Reference Wei, Cheng, Ramesh and Ma6 Due to differently prepared electrodeposited Ni samples used in the literature, with varying grain sizes, grain size distributions, and impurity content, it is not possible to directly compare the activation volume values in a one-to-one manner. It is sufficient to state that the extracted activation volume values in the current study match well with those from the literature. It should be noted that a change of activation volume from 10 to 20 b 3 is not generally interpreted as a substantial change in the deformation mechanism.
Multiple deformation mechanisms like dislocation–grain boundary interactions (by dislocation propagation and/or nucleation), grain boundary diffusion and grain boundary sliding can have activation volumes in the vicinity of ∼10 b 3. Unlike activation energy, that can be used to interpret the rate-controlling/limiting deformation mechanism, activation volume represents the sum total of all operative deformation mechanisms. Therefore, activation volume by itself, particularly in this range where so many deformation mechanisms overlap, cannot be used to assign or rule out a particular deformation mechanism as the dominant one. There is ambiguity in the literature on rate-controlling deformation mechanisms in nanocrystalline materials. Previous elevated temperature micropillar strain rate jump tests Reference Mohanty, Wheeler, Raghavan, Wehrs, Hasegawa, Mischler, Philippe and Michler27 on nanocrystalline Ni yielded similar apparent activation volumes and the calculated apparent activation energy suggested grain boundary diffusion to be the rate-controlling deformation mechanism. The deformed pillar (Fig. 10) showed evidence of both dislocation slip steps and clear grain boundary ledges associated with grain boundary sliding. Previous atomistic simulations Reference Van Swygenhoven, Derlet and Frøseth32,Reference Bitzek, Derlet, Anderson and Van Swygenhoven33 and in situ x-ray diffraction studies Reference Brandstetter, Budrović, Van Petegem, Schmitt, Stergar, Derlet and Van Swygenhoven34 support the idea that dislocation propagation resulting from dislocation–grain boundary interactions is the rate limiting step in these metals, rather than nucleation. Both of these viewpoints suggest activation volumes ∼10 b 3. Clearly, the activation volume is not sufficient to resolve the operating deformation mechanisms. Additional experiments, in terms of elevated temperature stress relaxation tests and other techniques, as well as atomistic simulations might be needed to further our understanding of deformation mechanisms in nanocrystalline metals during stress relaxation.
Slip steps and grain boundary ledges apparent after room temperature strain rate jump tests on nanocrystalline Ni to a strain of 25%. Reproduced from Ref. 27 with permission of Philosophical Magazine.

As expected, results for time-dependent plasticity are relatively independent of the test method (tension versus compression) or the sample size. While coarse-grained or single crystal metals show size dependent plasticity in the micrometer-regime, in nanocrystalline metals, the plasticity mechanisms are governed instead by the length scale of the grain structure, which is much smaller than the present pillars. For comparison, a 10 µm diameter and 30 µm height pillar will contain ∼256 million grains for a grain size of 26 nm. Since millions of grains are interrogated in these micropillar stress relaxation tests, these tests can be considered to be “bulk” compression tests and hence, compare favorably with the microtensile tests. Successful demonstration of micropillar stress relaxation tests to successfully extract activation parameters for deformation opens up the way for performing size effect studies on smaller pillars or larger grained metals.
While stress relaxation tests are often used as a means to understand the underlying plasticity mechanisms, it is also of practical relevance in several applications. For example, springs are often relied upon to exert a constant restoring force while held in a flexed position for sustained periods of time. However, springs made from nanocrystalline Ni, with similar grain size, will lose their restoring force over time: when loaded near the yield point, the restoring force will decay by ∼3–5% even within 1 min, and further decay ∼10% within a week. Alloying strategies need to be explored for nanocrystalline materials to suppress dislocation and diffusion based processes in these materials. Stress relaxation is also relevant to applications that rely on residual stresses for functionality, such as shot peening and laser shock peening used to induce compressive residual stresses for fatigue crack initiation suppression. It can also be important in solid state electronics and microdevice fabrication, where an evolving stress state can lead to distorted shapes or altered performance.
V. CONCLUSIONS
Microcompression stress relaxation experiments were successfully demonstrated on electrodeposited nanocrystalline Ni sample and the results were directly compared with bulk tensile relaxation measurements. The results are in good agreement with each other, suggesting that microcompression relaxation experiments can be used to extract time-dependent properties of thin films and small length scale features. Nanocrystalline Ni showed appreciable stress relaxation even below the 0.2% offset yield strength confirming that plasticity occurs below the typically reported yield strength values in these materials. The effective and apparent activation volume values diverged at lower strains, particularly in the so-called elastic regime. However, the effective activation volume remained constant as a function of strain suggesting that the operative deformation mechanisms do not change. Activation volumes obtained from these experiments were also found to be in good agreement with previous studies using micropillar strain rate jump tests on same batch of samples providing further proof that the developed stress relaxation experimental technique and data analysis methodology are correct and reliable. To the best of our knowledge, this is the first demonstration and validation of this technique for extracting time-dependent relaxation plasticity using microcompression. Although a displacement-controlled machine was used, similar tests can, in principle, be performed with load controlled indenters by using a fast feedback loop to keep the displacement constant during stress relaxation. It is hoped that these tests will pave the way for development of similar indentation based stress relaxation tests.
ACKNOWLEDGMENTS
Funding by Strength-ABLE (EMPIR 14IND03), an EURAMET joint research project funded by the European Community's Seventh Framework Programme, ERA-NET Plus, under Grant Agreement No. 217257 is gratefully acknowledged. Gaurav Mohanty, Aidan Taylor and Madoka Hasegawa would like to acknowledge funding from EMPA Postdoc program cofunded by FP7: Marie Curie Actions. BLB was funded by The United States Department of Energy, office of Basic Energy Science (BES).