I. INTRODUCTION
Lightweight intermetallic two-phase titanium aluminides, γTiAl, represent a prospective alloy for numerous structural engineering applications, where high temperature (about 700 °C) is the prime operating condition such as given in stationary turbines and aerospace engines. Among the various microstructures, lamellar γTiAl is most attractive for engineering applications due to its relatively high fracture toughness in translamellar direction and good oxidation resistance.
The microstructural deformation mechanisms of two-phase lamellar γTiAl are complex and depend on the lamellar orientations, their spacing, and size of colonies. During the last few decades, numerous experimental investigations, such as scanning electron microscope(SEM)/transmission electron microscope/electron backscatter diffraction analyses etc., have been performed for investigating the mechanics and deformation mechanisms of the material, for instance the anisotropy of strength, elongation to failure, fracture toughness, as well as the influence of colony boundaries and lamellar orientations.Reference Appel and Wagner1–Reference Maruyama, Yamada and Sato6 Depending on the lamellar colony orientation, size, and spacing, inhomogeneities and local property variations occur, e.g., from the surface to the core of a component. Their statistical and/or systematic distributions in the volume affect the global elastic–plastic response.Reference Arata, Kumar, Curtin and Needleman7–Reference Werwer and Cornec9 Numerical methods have also been developed for understanding micro and macro deformation as well as fracture behavior using crystal plasticity or continuum damage models.Reference Grujicic and Zhang10–Reference Lapin12
Systematic property variations on a macroscopic scale, e.g., resulting from an inhomogeneous distribution of alloying elements in an ingot or from the effect of heat treatments, are important for practical applications. Conventional hardness testing is often insufficient since it gives only an indication on local strength variation but neither a correct picture on the variation of the yield strength nor on the stress–strain behavior. Consequently, there is a need for a reliable indentation approach to determine local material properties, which yield results comparable to expensive and time-consuming macroscopic tension or compression experiments.
Existing literature on the characterization of TiAl alloys by indentation techniques beyond measurement of modulus and hardness is limited to a few publications. For example, indentation creep behavior of TiAl between 705 and 1050 °C has been measured using a flat punch indentation. The stress as well as the temperature dependence of the flat punch results (punch diameters of 1 or 2 mm) and uniaxial creep data were in good agreement.Reference Dorner, Röller, Skrotzki, Stöckhert and Eggeler13 Axisymmetric indentation at single crystal scale (indentation depths of 300 nm) and AFM imaging of the indented surface has been combined with crystal plasticity modeling and finite element (FE) simulation to determine the plastic anisotropy of γTiAl.Reference Zambaldi and Raabe14 Experiments and simulations were combined to study the orientation-dependent surface pileup. The crystal plasticity model used in Ref. Reference Zambaldi and Raabe14 considers also viscoplastic deformation. However, the rate sensitivity was not the scope of the presented work.
Indentation on the meso level, i.e., by testing of a few grains, has already been successfully applied to a number of alloys with cubic crystal structure in previous work. It has been found that the combination of spherical indentation with Artifical Neural Network (ANN) toolsReference Huber and Tsakmakis15–Reference Klötzer, Ullner, Tyulyukovskiy and Huber17 provides a powerful approach for the identification of the constitutive material behavior. Examples for the successful application to various advanced engineering materials are the characterization of the rate-dependent behavior of nanocrystalline nickel,Reference Tyulyukovskiy and Huber18 the cyclic loading behavior of a ferritic steel Eurofer97,Reference Huber, Tyulyukovskiy, Schneider, Rolli and Weick19 and the stress–strain behavior of the high-strength aluminum alloy Al2024-T351.Reference Heerens, Mubarok and Huber20 The inverse ANN analysis has also been validated with respect to increasing grain size starting from 20 nm for nanocrystalline nickelReference Tyulyukovskiy and Huber18 to about 200 μm for Al alloys.Reference Heerens, Mubarok and Huber20 The sensitivity of the inverse ANN analysis to surface preparation and residual stresses as well as rolling textures has been carefully investigated.Reference Klötzer, Ullner, Tyulyukovskiy and Huber17, Reference Heerens, Mubarok and Huber20 In all cited references the investigations focused on the validation of the identified stress–strain behavior. The quality of the identification of the rate effects has so far been validated for nanocrystalline nickel only,Reference Tyulyukovskiy and Huber18 which is—unlike alloys of technical relevance—known for its strong rate dependency.
Compared to the materials listed before, γTiAl represents a material with extremely different properties in terms of high strength and low ductility. As a result of the variation of the noncubic crystal lattice of the individual phases, it has a strong microstructural inhomogeneity and anisotropy. Consequently, the applied inverse ANN approach, which is based on von Mises flow theory, requires a thorough validation for TiAl alloys. In this work, only room temperature will be considered since this temperature allows validating of modeling approaches against available experimental data. It should be mentioned that limited ductility of γTiAl at ambient temperature is also an important issue.
As in our previous work we use a spherical tip with a radius of 0.2 mm, which allows placing a number of indents across a small test area. The tested volume seems appropriate to measure mesoscopic property variations of the considered γTiAl alloy with average grain size of about 100 μm. For smaller indenter tips, which test rather single grain behavior, a different approach based on crystal plasticity is needed (see e.g., Ref. Reference Zambaldi and Raabe14). The obvious question addressed in this article is, whether the indentation size and resulting volumetric averaging is sufficient for treating γTiAl alloys as an isotropic elastic–plastic continuum. The determined properties belong to a meso level, which reflects the average of the microstructural behavior of the investigated γTiAl alloy. Such material information can advantageously be used e.g., for optimization or quality control of production processes like forging or forming.
This work shall also investigate if the ANN analysis is sufficiently robust for providing material properties of advanced engineering materials having multiphase microstructures. The indentation results are compared with experimental compressions tests on round bars, which also include rate dependence due to viscoplastic behavior. In a further step, the identified viscoplastic parameters obtained via ANN analysis are applied in FE simulations with nonlinear hardening to repredict the spherical indentation curve confirming the applicability of the derived material parameters.
In summary, the following study focuses on (i) material property variations determined from instrumented spherical indentation data using an ANN analysis, (ii) the validation of the ANN results with conventional macroscopic compression tests with regard to stress–strain behavior and emphasis on the underlying hardening rule as well as the rate sensitivity of the material, and (iii) FE simulation using the identified ANN parameters to repredict the measured indentation records as well as to discuss the deformation and stress field in the tested volume in comparison to experimental findings.
II. EXPERIMENTAL
A. Material processing
The γTiAl alloy used in this investigation has the composition (at.%) Ti–47Al–3.7(Nb,Cr,Mn,Si)–0.5B and is subsequently denoted as γTAB, which was developed at GKSS (since November 2010 under the new name Helmholtz-Zentrum Geesthacht or HZG). This alloy was produced as an ingot by vacuum arc melting. After ingot manufacturing, a hot extrusion process followed with a reduction ratio of 7:1 providing 1-m-long rods of Ø22 mm. A nearly fully lamellar and fine-grained mircrostructure was obtained through specified heat treatments, i.e., (i) preheating with 800 °C for 30 min followed by furnace cooling and (ii) annealing at 1360 °C for 30 min followed by rapid oil cooling. Residual stress was released by a separate heating step. A mean colony size of approximately 100 μm was finally obtained.
B. Specimen preparation
For indentation testing, a cylindrical indenter block (Ø22 mm, 11 mm height) was cut from a heat-treated short bar. The bottom surface of the indenter block was finally lapped and the top surface was stepwise grinded till 2400 grit and finally polished with a 0.05-μm SiO2 suspension. More details of specimen preparation for indentation tests are described in Ref. Reference Heerens, Mubarok and Huber20.
After indentation testing, round bars (Ø2.5 mm, 4.56 mm height) were spark eroded from the indenter block. The lateral surface of these round bars was refined by centreless grinding providing high precision in diameter and low roughness. The preparation of the top and bottom surface was similar to the indenter block with attention to parallel surfaces.
C. Microstructure
The examination of the polished microstructure by SEM indicates transverse isotropy. Shapes and orientations of the lamellar colonies are almost randomly distributed across the indentation plane, whereas in extrusion direction the colonies show a strong alignment. The volume content of the α2-phase varies between 5 and 10% for an Al content within 45–48 at.%.
The α2-phase consists of hexagonal crystals where crystal plasticity occurs on prismatic, basal, and pyramidal slips. The γ-phase consists of tetragonal crystals, where crystal plasticity occurs as ordinary dislocation, superdislocation, and by mechanical twinning, see e.g., Ref. Reference Werwer and Cornec21 In this type of (α2+γ) lamellar colonies, the fracture toughness is in particular very low along the lamellar planes, which is an important aspect for the later discussion on microcracking.
D. Compression testing
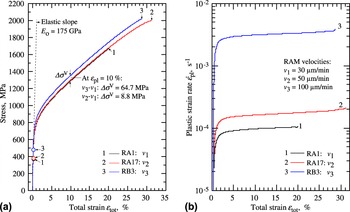
Macroscopic compression tests on round bars are carried out to validate the indentation test results including viscoplastic strain rate effects. Figure 1(a) shows the σ–ε curves determined from compression tests conducted for three different traverse (ram) velocities: v 1 = 30 μm/min (specimen RA1), v 2 = 50 μm/min (specimen RA17), and v 3 = 100 μm/min (specimen RB3). The strain rate effect for velocity v 3 (RB3) is clearly visible in Fig. 1(a) with a relative stress increase of Δσ V = 65 MPa compared to the σ–ε curve for velocity v 1 (RA1) and a relative stress increase Δσ V = 9 MPa compared to the σ–ε curve for velocity v 2 (RA17), each at the total (logarithmic) strain level ε tot = 10%. The yield stresses increases similarly.
Compression tests. (a) Stress–strain curves (logarithmic strain) from compression tests with different displacement velocities. (b) Development of plastic strain rate during loading.

During increasing total strain, ε tot, the corresponding plastic strain rates,  , are shown in Fig. 1(b). Steep initial gradients occur due to the transition effect from elastic to plastic deformation. The rate dependency is remarkable compared to typical engineering alloys.
E. Indentation testing
The indentation experiments were performed using a testing machine ZHU0.2/Z2.5, which is equipped with a hardness measuring head and fully automated X/Y table (Zwick Roell AG, Ulm, Germany), for details see Ref. Reference Heerens, Mubarok and Huber20. A Rockwell diamond indenter (E i = 1140 GPa) with a spherical tip radius of R = 0.2 mm was installed and used for all tests. All experiments were performed at room temperature under load control mode.
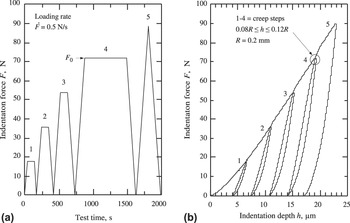
In total 17 indentations are placed automatically along the edges of a square of 4 mm width and one in the center. Each imprint has a diameter of about 175 μm and the indents are located in sufficient distance of 1 mm so that previous indents do not influence the next records. The indentation tests were performed with the multicreep loading history as shown in Fig. 2(a) and described in detail elsewhere.Reference Huber and Tsakmakis15, Reference Tyulyukovskiy and Huber16
Experimental records of specified indentation steps. (a) Applied loading history. (b) Force–depth behavior used for the Artifical Neural Network (ANN) analysis. The unloading–reloading cycles show pronounced hysteresis loops indicating a strong contribution of kinematic hardening to the hardening response.

For the specific γTAB alloy, the reference load, F 0, was set to 72 N, such that the corresponding indentation depth, h, is within the range of 8–12% of the nominal indenter radius of R = 0.2 mm [Fig. 2(b)]. The load rate in all indentation tests was fixed by 0.5 N/s. Figure 2(b) presents the resulting load–depth behavior of a representative indentation test of the conducted series.
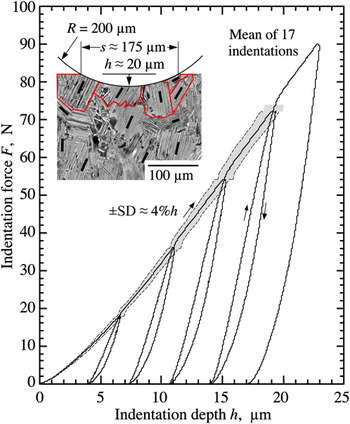
A statistical representation of all indentation tests is shown in Fig. 3. During loading, the standard deviation, SD, of the indentation depth, h, is almost constant about 4% and increases during unloading until 6%. The presented indentation method averages the detailed microstructural behavior on the meso level. The inset in Fig. 3 corresponds to the maximum indentation (h ≈ 20 μm) and displays the contact region in relation to the real colony sizes beneath the indentation plane. Deformation is typically activated in several lamellar colonies.
Indentation records of force versus depth. Inserted the γTAB microstructure with its lamellar colonies in relation to the indentation size.

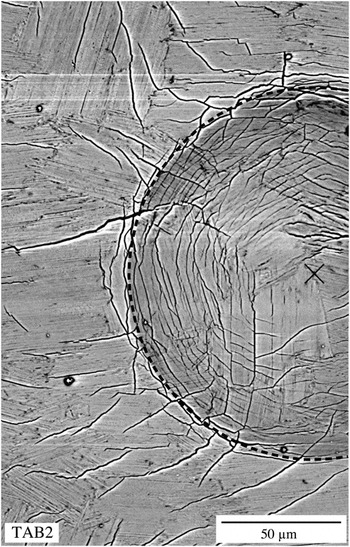
For indentation test TAB2, a SEM image of the indented surface after unloading shows special features (see Fig. 4). Along the indentation edge radial microcracks develop, whereas in the inner core of the indentation a lot of circumferential-oriented microcracks occur. This crack pattern will be addressed in detail in “Results and discussion.”
Scanning electron microscopy image of surface under indentation TAB2 after unloading.

III. COMPUTATIONAL METHODS
A. Artificial neuronal network analysis
The method for analyzing indentation curves using ANN as well as the corresponding mechanical simulation of deformation and stress fields are based on a continuum finite deformation viscoplasticity model.Reference Diegele, Jansohn and Tsakmakis22 The model decomposes the total stress into a rate-independent equilibrium stress, σ E, and a rate-dependent overstress, denoted as σ V. Their sum is the total stress for a given plastic strain, ε pl, and plastic strain rate,  . For small deformation theory and uniaxial deformation, the model can be written in a simplified form:



As written in Eq. (1), the hardening can be decomposed into nonlinear isotropic hardening  and nonlinear kinematic hardening
 , each determined by a pair of material parameters (γ, β) and (c, b), respectively. The yield stress is defined by the material parameter k 0. The ratio of kinematic hardening to total work hardening can be defined as ξ* := ξ /(σE −k 0). For simplicity, we introduce a constant ratio ξ* throughout the whole deformation process, i.e., the shape of the two nonlinear hardening rules is assumed to be similar. This leads to the condition b = β. Then we obtain from Eq. (2) the following equations for the material parameters c and γ in dependence of ξ*:


It has been shown in previous work that simulations yield practically equal indentation loading curves for pure isotropic and for pure kinematic hardening, respectively, when the two hardening rules yield the same monotonic stress–strain behavior.Reference Huber and Tsakmakis23–Reference Huber and Tsakmakis25 Assuming that hardening is purely isotropic in the first step, the unloading reloading hysteresis is ignored by the ANN analysis. The maximum equilibrium stress is then given by k max = k 0 + γ/β, where the ratio γ/β defines the maximum amount of work hardening during plastic deformation as it is determined from a fit of the exponential function  to the identified monotonic stress–strain behavior.
The identification of the kinematic hardening rule included in Eq. (2) is important when plastic deformation during unloading is relevant. In indentation experiments this effect is often denoted as plastic recovery. It is furthermore important when cyclic loading behavior shall be described. In the ANN software, the contribution of the kinematic hardening to the total hardening is identified from the shape and size of the unloading–reloading hysteresis loop after the last creep phase at reference load, F 0 (see Fig. 2, Point 4). A detailed study on this part of the identification process can be found in Ref. Reference Huber, Tyulyukovskiy, Schneider, Rolli and Weick19. Unfortunately, as a result of the complexity of the inverse problem, the identification of the kinematic hardening rule is not very robust. This part of the software often leads to an abort of the identification software when the experiments contain a certain level of scatter.
The viscosity parameter, η, and viscosity exponent, m, define the amount of viscoplastic overstress, σ V, for a given plastic strain rate  [Eq. (3)]. The rate dependency can be expressed by
 . This means on the one hand that increasing values of m decreases the rate sensitivity. On the other hand a material with low rate sensitivity can still show a significant overstress, σ V, (and therefore visible creep) if η is sufficiently large. However, if the creep process is very slow, the uncertainty in determining η and m (and σ V) increases with increasing value of m, even for relatively long creep times of 10 min as applied in the indentation method. Thus, the viscosity parameters show a strong correlation and are normally difficult to be identified independently (see also Ref. Reference Klötzer, Ullner, Tyulyukovskiy and Huber17).
Using the ANN analysis for indentation testing as described in Refs. Reference Tyulyukovskiy and Huber16 and Reference Klötzer, Ullner, Tyulyukovskiy and Huber17, the material parameters in Eqs. (1)–(3) can be identified and the stress–strain behavior of the tested material can be obtained from Eq. (1). For more details of analysis, see Refs. Reference Tyulyukovskiy26 and Reference Scherrer-Rudiy27. The analysis software is now available as a module within the Indent Analyser of ASMEC (Advanced Surface Mechanics GmbH, Radeberg-Rossendorf, Germany).
B. FE simulation of indentation
To validate the identified mechanical properties, the load–depth behavior (F–h curves) for the experimentally applied loading history is calculated using an axisymmetric FE model as already presented in Ref. Reference Tyulyukovskiy and Huber16, and the constitutive model is described earlier. The model is implemented in a user subroutine UMATReference Diegele, Jansohn and Tsakmakis22 to be used in the commercial FE code ABAQUS.
The contact area is small enough to neglect effects of the mesh boundary. The FE mesh consists of 2532 bilinear axisymmetric four-node elements with reduced integration. In the contact area, it is sufficiently refined to ensure a good quality of results. For simplification, the spherical indenter tip is considered as a rigid body. Thus, in the simulation an effective elastic modulus, E eff, is introduced to account for the existing indenter compliance as follows:
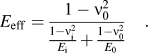
By assigning E eff and the (unmodified) Poisson’s ratio ν 0 to the specimen material, the materials stiffness is reduced by the compliance of the indenter tip (which is now rigid) yielding a system stiffness in the FE simulation, which is comparable to that of the experiment. This allows a direct comparison of the simulations with measured indentation curves. With the physical properties of the indenter sphere, E i = 1140 GPa, ν i = 0.07, and γTAB specimen, E 0 = 175 GPa, ν 0 = 0.3, the effective elastic modulus is E eff = 150 MPa.
IV. RESULTS AND DISCUSSION
A. Artificial neural network analysis
In the following, the results in form of the material parameters and σ–ε curves will be presented, derived from the experimental indentation curves via ANN analysis, as well as from compression tests (Compression testing). Only plastic strains, ε pl, are displayed.
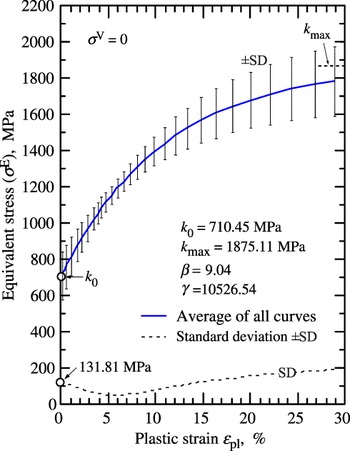
Figure 5 presents a statistical analysis of the σ–ε curves without overstress (σ V = 0), i.e., for the equilibrium stress response, σ E, as identified from the indentations. The SD is smallest in that strain range, where the spherical indentation test provides the most robust information (confirmed in Ref. Reference Scherrer-Rudiy27). This region corresponds to the range of a representative plastic strain, ε r, that can be obtained after Tabor’s empirical relation.Reference Tabor28 Here, ε r = 0.2a/R, where a is the imprint radius and R is the indenter radius of the sphere. For the applied indentation depth ratio of 0.08 ≤ h/R ≤ 0.12, the representative plastic strain, ε r, is in the range of 7–9% confirming the smaller scatter in this region. The maximum strength is reached at large plastic strains beyond 30%; thus, strong hardening behavior dominates the whole depicted strain range in Fig. 5.
Averaged σ–ε curve of all single indentation curves by exponential fit like Eq. (2) and their standard deviation.

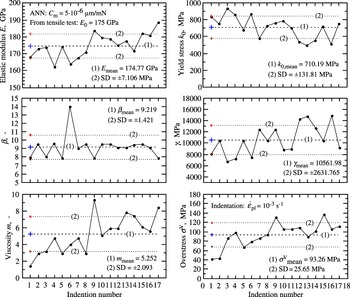
The complete set of material parameters (E, k 0, β, γ, m, η) is condensed in Fig. 6, together with their average values and SDs. Before determining the parameters, the proper compliance of the test setup (including specimen) is needed. Since this input value used in the ANN analysis has to be fixed first, the known value of the elastic modulus, E 0, for γTAB (E 0 = 175 GPa) is used for a calibration. The average value for the elastic modulus, E mean, of all indentations (1–17), determined with a pre-estimated compliance, is fitted to the known elastic modulus, E 0, by adjusting the compliance to C m = 5·10−6 μm/mN. This value was then fixed for the presented analysis. It should be noted that C m has only a minor effect on the identified σ–ε curve.
Diagrams for identified material parameters E, k 0, β, γ, m, and σ V along the individual indentation points.

The curves for the stochastic parameters in Fig. 6 should not follow a certain trend due to the observation of a random transverse microstructure, but this seems not fully true. The observed trend indicates a property gradient from the left to the right side in Fig. 6 and that gradient occurs along the diameter of the specimen plane, following the numbers of indentations, as if alloy composition or processing conditions change slightly through the thickness of the round bar.
The viscoplastic behavior is expressed by the two viscosity parameters, m and η, or equivalently by the overstress, σ V, as given by Eq. (3). For each indentation, the parameters m and η are identified by the ANN analysis. Using the determined values of m and η, the overstress, σ V, for each compression test can be easily determined from the given plastic strain rate, 
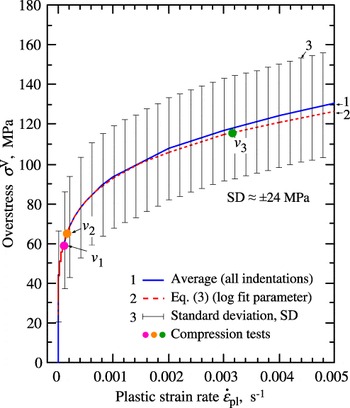
Figure 7 presents the averaged overstress, σ V, from all indentations. The SD indicates a relatively large scatter for the overstress of about ±24 MPa. With regard to the total strength of the material, this is of the order of only 1–2%. The averaged curve for the overstress, σ V, is fitted on a log–log scale providing the averaged viscosity parameters m = 5.161 and η = 1.415 × 10¹³ MPams. Alternatively, the averaged viscoplastic parameters, m and η, can be determined using single values from ANN analysis resulting to m = 5.252 and η = 2.216 × 10¹³ MPams. Here, η is determined by averaging the single overstress values, σ V, for a certain plastic strain rate (e.g.,  = 0.001 s−1 for indentation) and subsequent recalculation leads to η from Eq. (3) using the averaged parameter m. The overstresses, σ V, resulting for the compression tests with different ram velocities (v 1, v 2, v 3) are included in Fig. 7 by dot markers for the individual strain rates,
 , at the plastic strain level of ε pl = 10% [see also Fig. 1(b)].
Averaged curve for overstress, σ V, with standard deviation SD and calculated from Eq. (3) with average parameters, m and η, from exponential curve fit.

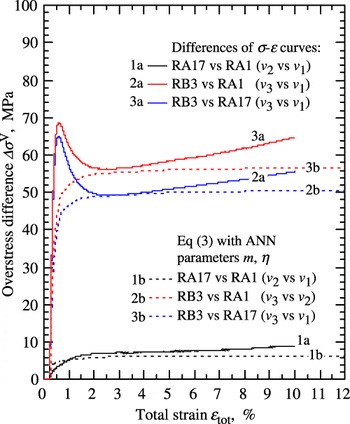
Despite the missing equilibrium information from the compression tests, the rate effects from the indentation tests, expressed by the overstress, σ V, can be validated by the overstress differences, Δσ V, [see Fig. 1(a)]. In this way Fig. 8 presents the comparison of the overstress difference, Δσ V, directly given from the σ–ε curves of compression tests and from differences of the analytical curves determined by Eq. (3).
Comparison of overstress difference, ∆σ V, from indentation and compression tests, expressed as the difference of different ram velocities (v 1, v 2, v 3).

The transition from pure elastic to pure plastic behavior causes some inconsistency in the stress difference, Δσ V. The specimen with faster velocity follows still the elastic behavior while the samples with a low velocity are already in the plastic regime. The discrepancy yields the peaks in Fig. 8. For the smaller velocities (v 2 versus v 1), this artifact does not occur since the offset of yielding is small and the hardening evolution is still similar.
After the peak, a transition into a plateau-like behavior appears in the plastic strain regime. It should be noted that the increasing trend of the relative overstress obtained from the experimental tests seems mainly to be caused by increasing different nonuniform deformation, like s-type or barreling curvature, which superimpose the “true” effect of overstress, σ V. This begins already from medium plastic strains (ε pl ≈ 5%).
The overstress difference, Δσ V, from the indentation tests are calculated using Eq. (3) based on the averaged ANN parameters for m and η and following the experimentally determined strain rate,  , as shown in Fig. 1(b). Here, a nearly constant overstress difference, Δσ V, is obtained. Having the complexity of the indentation approach in mind the agreement of the curves is fairly good.
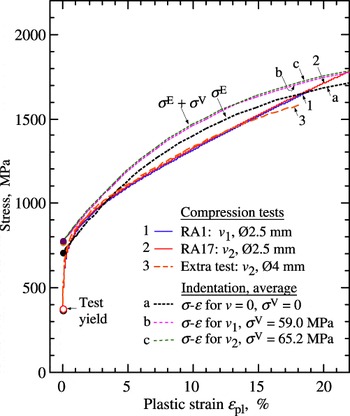
In the next step, the σ–ε curves from the indentation analysis will be validated. In Fig. 9, the averaged σ–ε curve from all indentations is compared to the σ–ε curves from the compression tests for the two slow ram velocities (v 1, v 2). The overstress effect for the two compression tests is considered by a constant value, applying Eq. (3) at the plastic strain level ε pl = 10% with the above-presented mean viscoplastic parameters (m = 5.161, η = 1.415·1013 MPams). The compression tests provide a long quasilinear segment in the stress–strain curve. To confirm this compression tests, an additional σ–ε curve from a different compression test series (Ø4 mm, 8 mm height) and a different test setup (but for the same γTAB alloy) is added to Fig. 9. It can be seen that this independent σ–ε curve coincides completely with the main compression test series, except in the large plastic strain regime, where s-type deformation of both specimens are different.
Comparison of stress–strain curves derived from indentation and compression testing.

Some aspects should be mentioned to the predicted σ–ε curves from indentation testing. At smaller plastic strains (ε pl ≤ 5%), the agreement of the experimental and indentation σ–ε curves is good. However, the onset of plastic yield does not exactly match the compression tests, which are more sensitive in this region. This is an intrinsic lack of the indentation test. To overcome this problem, the yield point is determined in the ANN analysis by backward extrapolation of the exponential curve [Eq. (2)]. For larger plastic strains, the σ–ε curves from the indentation test are systematically higher than the compression curves (till 10% deviation). The assumed exponential constitutive σ–ε law [see Eq. (2)] does not fit the rather linear “true” σ–ε curve from compression tests very well. However, also the compression test has some uncertainties. The sharp edges of the round bars generate plastic strain concentrations, which may cause an inhomogeneous deformation in the compression tests. Finally nonuniform s-type deformation occurs under increasing plastic strains (ε pl > 5%) and promotes a softening of the measured stress–strain behavior.
B. Simulation results
In addition to the comparison of σ–ε curves from indentation (ANN) and compression testing, indentation curves from simulations using an indentation FE model can also be used to further validate the identified material parameters. Therefore, all indentations (1–17) have been simulated with their individual parameters and also the averaged curve in conjunction with the averaged parameters above.
1. Effect of kinematic hardening
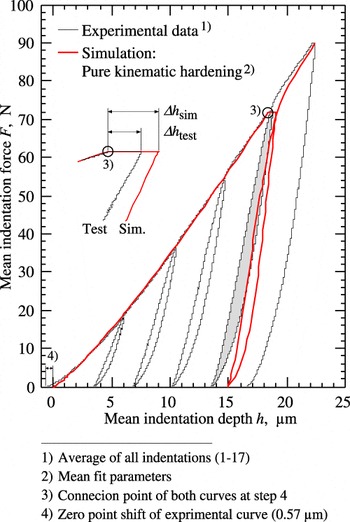
The experimental indentation data with unloading and reloading show significant hysteresis loops for γTAB. It is well known that pure isotropic hardening does not generate hysteresis loops but only occurs elastic unloading and reloading along the same curve. If a hysteresis loop occurs, the material exhibits kinematic hardening and the width of the hysteresis loop correlates to the contribution of kinematic hardening to the total hardening behavior.Reference Huber and Tsakmakis23–Reference Huber and Tsakmakis25
Figure 10 presents the averaged experimental indentation curve and its comparison with the predicted curve from FE method by applying pure kinematic hardening (ξ* = 1), cf. Eqs. (4) and (5). The simulation shows generally very good agreement for the increasing load part of the experimental curve until maximum load (F 0 = 72 N). Note that both curves are connected at the beginning of the fourth step (at F 0), to exclude issues of roughness. After complete unloading, the residual indentation depth, h(F = 0), is smaller (about 1.3 μm) in the experiment while the shape, in particular the maximum width of both hysteresis loops, is very similar. Additional simulations, not presented here, indicated that the hysteresis loop shrinks visibly when ξ* is reduced only by a few percent. Thus it can be concluded that γTAB exhibits pure kinematic hardening. A strong kinematic hardening response is common for multiphase materials as a result of the enforced compatibility on the different phases which have strongly dissimilar deformation behavior, also confirmed by observations.30
Comparison of averaged indentation curves from testing and simulation including last hysteresis loops; curves, connected at the beginning of the fourth hold step.

2. Effect of microcracking
The unloading slope shows a significant difference between experiment and simulation. It is likely that there exist an additional effect in the experiment which changes the compliance during unloading. An obvious reason is that the different behavior results from microcracking near the indented surface (see Fig. 4). It is well known for γTiAl that the tensile strength is very poor on interface planes in a lamellar colony, e.g., expressed by fracture toughness, K Ic, in the range of 3–5 MPa√m.Reference Arata, Kumar, Curtin and Needleman7, Reference Werwer, Kabir, Cornec and Schwalbe29 For the polycrystal of the considered γTAB alloy, fracture strength is obtained at about 700 MPaReference Werwer, Kabir, Cornec and Schwalbe29 perpendicular to the extrusion direction. Only the circumferential stress component σ 33 (axis 3 is perpendicular to the load direction) and the in-plane shear stress component σ 12 are responsible for crack initiation.
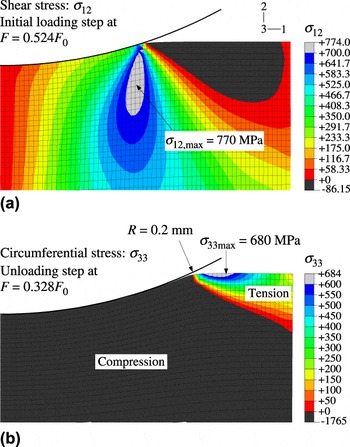
Figure 11(a) presents the shear stress distribution, σ 12, at a load level F = 0.524F 0 (F 0 = 72 N), where high shear stresses up to 770 MPa occur. At the indentation edge on the free surface a lamellar colony can easily deform by crystal slips, triggered by high shear stress concentration, which lead to microcracking, as the critical resolved shear stress in lamellar direction is the weakest mode.Reference Werwer and Cornec21 During progressing indentation, the microcracking occurs continuously at the slowly advancing indentation edge. The microcracks are then compressed underneath the indenter sphere and do not influence the indentation curve during loading. Thus, a good agreement of experimental and simulated indenter curves is observed, as shown in Fig. 10.
Axisymmetric stress fields from simulations for certain load levels for the averaged indentation curve. (a) Maximum shear stress field on the first loading path. (b) Maximum circumferential stress field under tension on the unloading path.

Figure 11(b) presents the distribution of the maximum circumferential stress component, σ 33, under tension on the unloading path at the load level F = 0.328F 0. Adjacent to the edge of the spherical imprint, the maximum circumferential stress reaches σ 33max = 680 MPa, which is close to the fracture strength mentioned above. Due to the steep stress gradient from compression to tension stresses, the maximum circumferential stress component, σ 33, is restricted to a small spot of 20% of the indentation depth but is large enough to form radial microcracks on the surface, especially in favored lamellar orientations. Until the final unloading the tension stress field is not sufficient to generate radial microcracks. The largest radial cracks are sectioned exemplarily across the crack length using a focused ion beam (FIB) microscope. An average crack depth up to 4 μm was obtained, which is about 20% of the maximum indentation depth.
In summary, indentation microcracks are generated at the actual contact edge of the indenter sphere during loading, but they are immediately compressed with increasing indentation area. However, during unloading these microcracks open and reduce the local material stiffness, finally causing a larger elastic recovery until the unloaded state (F = 0) is reached.
3. Rate sensitivity and overstress
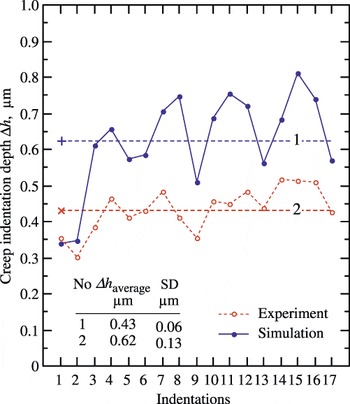
A further interesting effect is the increase of indentation depth, Δh, during the creep process in the fourth step, as indicated in Fig. 10. Figure 12 shows the comparison for indentation tests, Δh exp, and simulations, Δh sim. The simulation overestimates the experimental depth, while the stochastic variations of both are comparable. The absolute difference between experiment and simulation for Δh is about 0.2 μm, which is 10% of the maximum indentation depth. As discussed previously, the rate effect has been correctly identified (see Fig. 8) in form of the overstress difference, Δσ V. The results here indicate that the absolute value of the overstress, σ V, is overpredicted due to the inherent difficulties in identification of the viscosity parameters. This is commonly the case when the parameter m has a value above 5 (see Refs. Reference Huber and Tsakmakis15–Reference Klötzer, Ullner, Tyulyukovskiy and Huber17).
Increase of creep indentation depth during the fourth hold step for each individual indentation; comparison of experiment and simulation.

V. SUMMARY AND CONCLUSIONS
This investigation confirms the applicability of spherical indentation testing and inverse determination of the material parameters using the ANN tool for the technically relevant lightweight and temperature-resistant material γTiAl with regard to stress–strain behavior, the underlying hardening rule and the rate sensitivity.
It has been shown that the single indentations deliver a broad variety of material properties on a local level, commonly defined as meso level, which are comparable to macroscopic properties as determined from macroscopic round bar compression tests. Taking the assumptions made implemented in the ANN approach into account, the agreement between the identified stress–strain behavior and the compression tests was good although the compression tests revealed quasilinear stress–strain behavior. It should be mentioned that both experiments have their individual uncertainties: while the indentation test is uncertain in identifying the yield point, the compression test is accompanied by inhomogeneities at the contact edges of the round bars and barreling for large strains.
One specific issue of γTiAl is its low ductility. During indentation, high shear stresses develop during loading at the contact edge and high circumferential tensile stresses develop during unloading outside of the contact area, both causing microcracking. It has been shown that γTiAl shows pure kinematic hardening, yielding very large unloading–reloading hysteresis loops. A strong kinematic hardening response is common for multiphase materials. The kinematic hardening is also responsible for significant plastic recovery during unloading accompanied by radial microcracking from the contact edge and propagating to a depth of about 20% of the indentation depth. These microcracks reduce the materials’ stiffness significantly, but only during unloading. As a conclusion it cannot be recommended to determine Young’s modulus from indentation testing of γTiAl on a mesoscopic scale.
Concerning the rate sensitivity of γTiAl, the inverse analysis of the indentation tests provided material parameters, which almost accurately predicted the rate effects that have been measured by the compression tests. However, as shown by reprediction of the indentation creep behavior, the ANN approach overpredicts the absolute value of the overstress. It can be concluded that uncertainties in the material parameter η lead to a visible error in the predicted creep curves, particularly for materials, such as γTiAl, with a high strength to modulus ratio.
With the used spherical indenter (R = 0.2 mm), local material properties can be determined over cross sections of a component. Such material information can advantageously be used, e.g., for optimization or quality control of production processes like forging or forming. For our ongoing work it is very useful for modeling aspects including stochastic effects (see also Ref. Reference Kabir, Cornec and Brocks31), either as delivering input data or to validate the modeling work.
ACKNOWLEDGMENTS
The authors thank their colleagues from the Institute of Materials Research for their kind collaboration. Fritz Appel, Uwe Lorenz, and Jonathan Paul for providing the γTiAl alloy (γTAB), heat treatments, general support, and helpful discussions. Volker Heitmann for providing the SEM images. Karl-Heinz Balzereit for his valuable support in compression testing and Delin Rao for his kind support in indentation testing. Jürgen Heerens is greatly acknowledged for his valuable discussions regarding indentation testing and analysis. Svetlana Scherrer-Rudiy from Karlsruhe Institute of Technology is kindly acknowledged for providing information about the analysis software and helpful comments. Erica Lilleodden is acknowledged for her support on FIB preparation and microcrack characterization.