


Introduction
Crystal-fabric analysis on deep ice cores drilled on polar ice sheets yields important information on their internal deformation and flow patterns. Studies on ice cores from Greenland and Antarctica have revealed that c-axis orientations evolve from random patterns near the surface to highly preferred orientations in the lower parts of the ice sheets. the type of fabric that develops depends on the dominant stress system, and the fabric strength seems to be mainly determined by the cumulative strain (e.g. Reference AlleyAlley, 1988; Reference Budd and JackaBudd andJacka, 1989). At locations near ice-sheet summits (e.g. GRIP and GISP2, central Greenland) or local domes (e.g. Dome F, East Antarctica), where vertical uniaxial compression dominates, a strong vertical single-maximum fabric develops (Reference GowGow and others, 1997; Reference Thorsteinsson, Kipfstuhl and MillerThorsteinsson and others, 1997; Reference AzumaAzuma and others, 1999). on the other hand, a vertical girdle fabric is observed to form in ice-sheet regions with a strong component of horizontal tension, well-known examples being the Vostok andMizuho sites, East Antarctica (Reference Fujita, Nakawo and MaeFujita and others, 1987; Reference Lipenkov, Barkov, Duval and PimientaLipenkov and others, 1989). Rotation of c axes by basal glide is the generally accepted mechanism for fabric development (Reference Azuma and HigashiAzuma and Higashi, 1985; Reference AlleyAlley, 1988). the crystalline anisotropy revealed by fabric measurements affects ice-sheet deformation. Clear evidence of enhanced horizontal shear deformation rates of ice displaying a single-maximum fabric has been found by inclination measurements in the boreholes, and laboratory studies indicate that such ice is significantly harder against vertical compression than ice with a random fabric (Reference Dahl-Jensen and GundestrupDahl-Jensen and Gundestrup,1987; Reference Shoji and LangwayShoji and Langway, 1988; Reference PatersonPaterson, 1991; Reference Dahl-Jensen, Thorsteinsson, Alley and ShojiDahl-Jensen and others, 1997a, Reference Dahl-Jensenb). Effects of fabric development on ice deformation are now increasingly being taken into account in models of ice-sheet flow (Reference AzumaAzuma, 1994; Reference Azuma and Goto-AzumaAzuma and Goto-Azuma, 1996; Reference Thorsteinsson, Waddington, Taylor, Alley and BlankenshipThorsteinsson and others, 1999; Reference Cuffey, Conway, A., Hallet, C. F. and WhitlowCuffey and others, 2000).
In this work, results are presented from a study of c-axis fabrics in the new North Greenland Icecore Project (NorthGRIP) deep core drilled in the years 1999–2001at the location 75˚1’N, 42˚3’W. c-axis orientations have been measured on 142 thin sections from 120m down to 2930 m, the depth reached by the end of the 2000 drilling season. the measurements have mainly been carried out with a new automatic ice-fabric analyzer (AIFA; Wang and Reference AzumaAzuma, 1999), but manual measurements using conventional methods have been performed at selected depths as well, for comparison. In addition to presenting the fabrics and statistics derived fromthem, the paper addresses the stress conditions and the ice-flow pattern at the NorthGRIP site. Results from crystal-size measurements are reported elsewhere.
Methods
Sampling and thin-section preparation
The NorthGRIP project was initiated in 1996. In 1997, the drill became stuck at 1370m depth, and drilling had to be restarted from the surface in 1999, 20m from the previous position. In the 2000 season, a depth of 2930m was reached, 150 mabove bedrock. Allmeasurements in the depth interval 100–1370m were performed on samples cut at 55–66m intervals from the first core (NorthGRIP1). Samples from the brittle zone (650–1300m) were cut after 3 years of relaxation. from the second core (NorthGRIP 2), a continuous 1.2 cm thick strip was cut from the side, along the entire core length. A total of 300 samples have been cut from this strip at depths of 1370–2930m.
Vertical thin sections, 9 cm long and 6 cm wide, were prepared from the strip samples. the flat side of the strip sample was smoothed with a microtome, then placed on a 110 670 62 mm glass plate and frozen onto it by dropping water along the edge. Then the section was reduced in thickness to 2 mmwith a band-sawand finally down to 0.5 mmwith a microtome. Silicone oil was applied to the surface of the thin section to prevent sublimation. the thin sections were packed in plastic bags and stored at a temperature of –25˚C.
Instrument
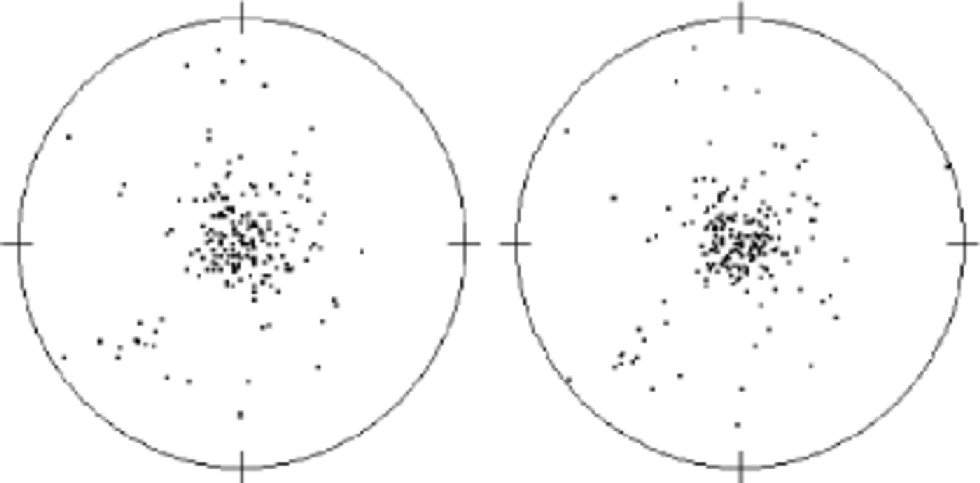
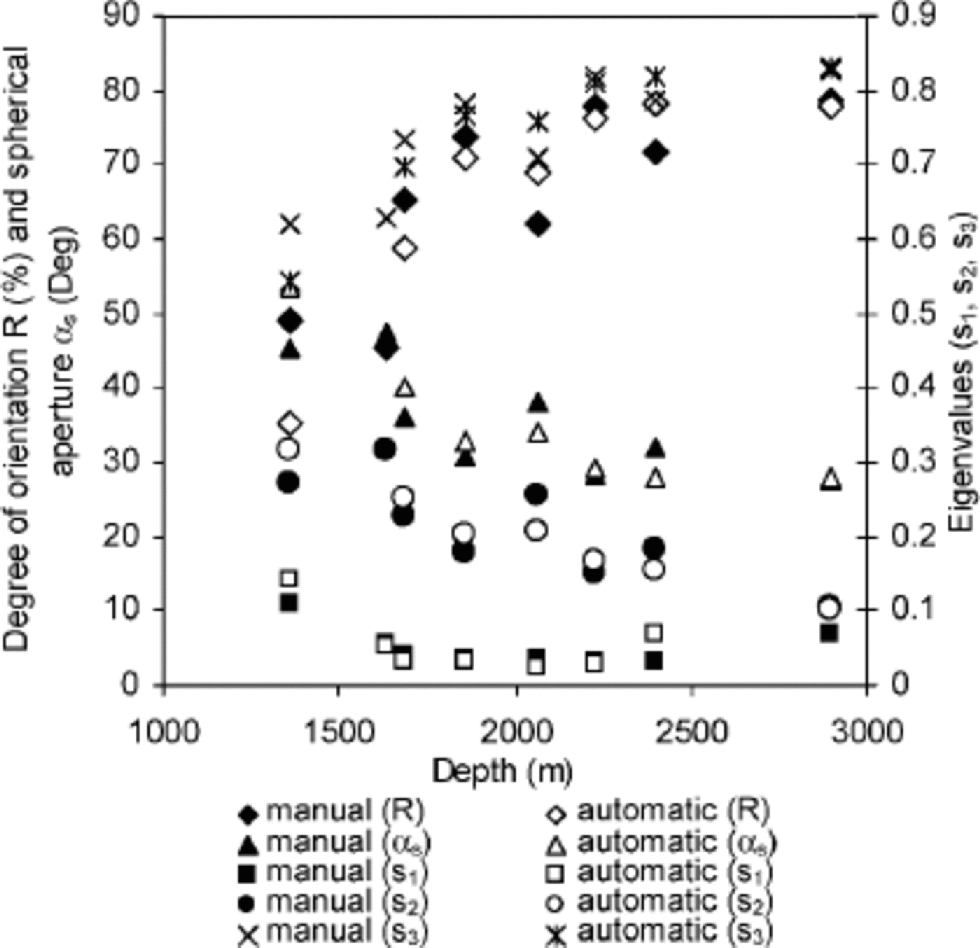
The c-axis orientation measurements have been performed with an AIFA, described in detail in Wang and Reference AzumaAzuma (1999). In this instrument, the ice thin sections are placed between a pair of crossed polarizers and imaged from nine different positions with a charge coupled device camera. At the first (vertical) observing position, the crossed polarizers are rotated 90˚, and images taken of the thin section every 5˚. Analysis with image-processing techniques is then used to distinguish crystal boundaries and obtain textural information on crystal size, aspect ratio and elongation direction. Checking and comparing the pictures, 200 crystals are arbitrarily selected by mouse-clicking within an area of 565 cm (or larger if a larger crystal size makes it necessary). the coordinates of each selected crystal in the image are saved and converted to new coordinates at the other observing positions of the camera. At these positions, imaging of the thin sections at different rotation positions of the polarizers is repeated. from the pictures, the brightness at each selected crystal coordinate is measured and the extinction position of each crystal calculated. the c-axis orientation can then be determined from the geometrical relation of the extinction positions in different observing positions. Except for the manual selection of crystals, the routine has been done automatically.The procedure used in this work has been changed from that described inWang andReference AzumaAzuma (1999), to avoid difficulties in determining the orientations of very small crystals. for comparison, several samples were measured both with the conventional universal-stage method and with the AIFA. As is evident from Figure 1, the results from the two types of measurements are in good agreement. the average difference between inclination values for 200 crystals is 3˚, and the same average difference is obtained for the azimuth results. Figure 2 shows a statistical comparison between the manual and automatic results, again indicating good agreement (see next subsection on statistics definitions).
Comparison of a crystal-orientation fabric measured manually with a universal stage (left) and automatically with the AIFA (right). the sample is from 2900 m depth, and 200 crystals are measured.
Statistical comparison of manual and automatic fabric measurement results.
Data treatment
The c-axis orientations have been plotted on the lower hemisphere of an equal-area Schmidt net. All measured data from vertical thin sections were rotated such that the diagrams show c-axis orientations as viewed in a horizontal plane, from above. the computer program ``Ariane’’ has been used to calculate the following statistical parameters.
The degree of orientation (R) has been defined by Reference WallbrecherWallbrecher (1978) as

where each c axis is treated as a unit vector, S is the length of the vector sum and N is the number of c axes.R variesbetween 0% for a random distribution and 100% for completely parallel orientations and can be used as a measure of fabric strength. Another parameter that can be used to describe the fabric strength is spherical aperture (αs), expressed as

αs can be described as the radius of a circle centred on the average c axis in the fabric diagram, and containing within it a uniform distribution of c axes which have the same R value as the measured distribution. Eigenvectors and eigenvalues calculated by the program provide a measure of fabric shape. the eigenvectors represent three orthogonal vectors parallel to the axes of an ellipsoid which best fits the shape of the c-axis distribution, and the eigenvalues equal the lengths of these axes. In this work, normalized (i.e. divided by the number of axes) eigenvalues (s1, s2, s3) are presented. the largest eigenvalue, s3, can be used as a fabric concentration parameter. Furthermore, we calculate the Woodcock k value defined by Reference WoodcockWoodcock (1977),

which can be used to distinguish between unimodal and girdle fabrics. the parameter k lies in the interval [0,1] for girdle fabrics and [1,?] for unimodal fabrics.
Results
Schmidt net
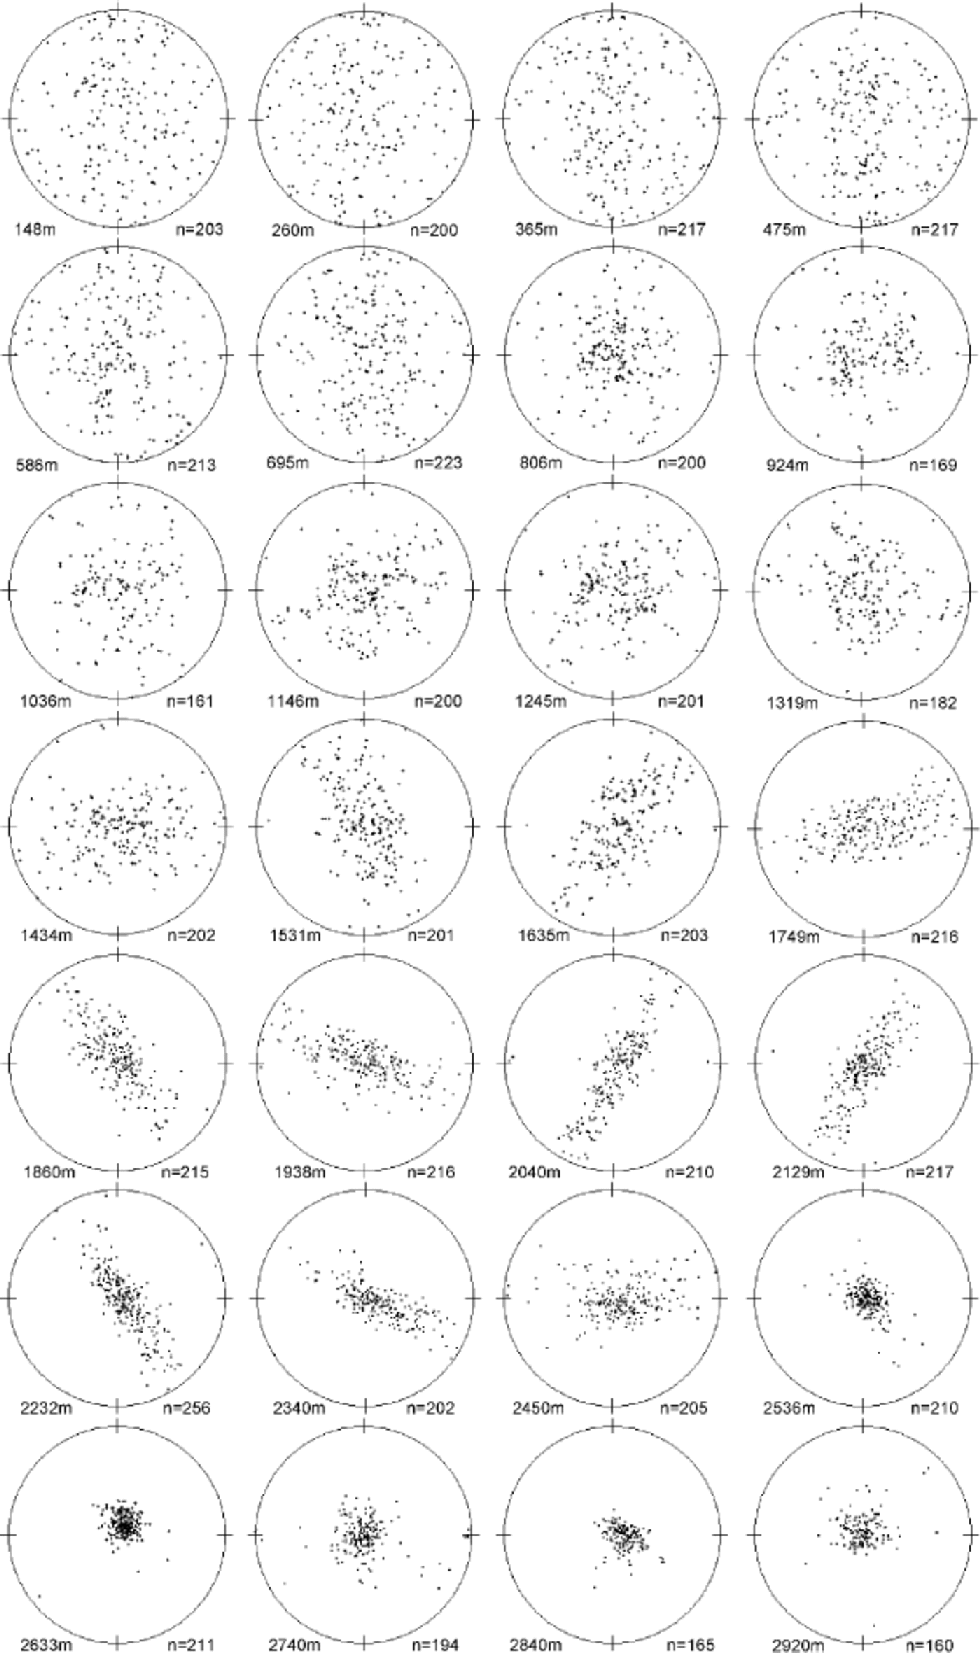
Figure 3 displays fabric diagrams measured on samples cut from 28 different depth levels in the NorthGRIP core, with intervals averaging 100m. All diagrams display c-axis orientations measured on vertical thin sections and rotated into horizontal view. the centre of the diagram thus represents the vertical axis along the core. the c-axis orientations appear uniform in the uppermost 750 m. At 805m depth a broad single maximum has been formed, and at 1300– 1750ma marked clustering of the c axes towards the vertical plane is observed. This vertical girdle-fabric pattern further strengthens with depth, and persists down to about 2500m, forming the first clear evidence of this fabric type in a Greenland deep ice core. the azimuth of the girdle plane is not known, but here the diagrams are shown assuming a common azimuth for the girdles. Below 2500m depth, the fabric transforms to a strong single maximum that displays variable strength down to 2920m.
Horizontal view of fabric diagrams of vertical thin sections through the depth at an interval of about 100 m. the centre of each diagram represents the vertical direction.
Statistical parameters
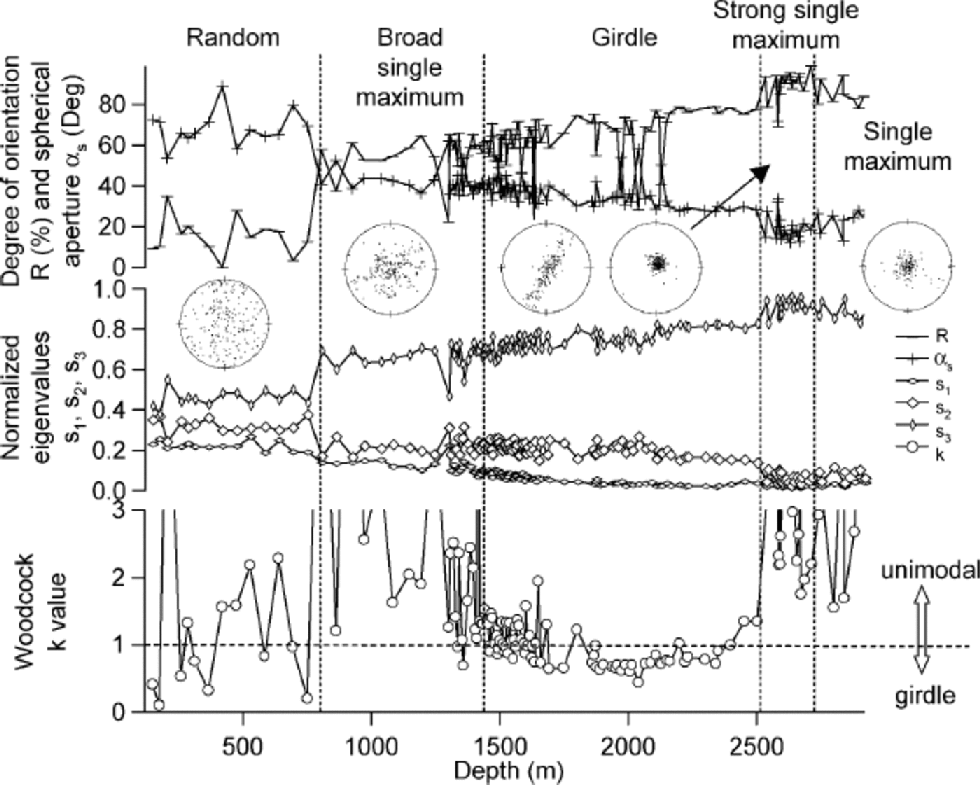
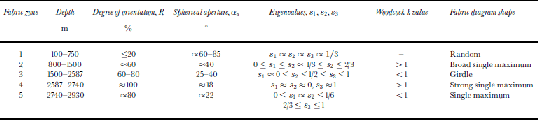
The degree of orientation (R), spherical aperture (αs), eigenvalues s1, s2 and s3, and Woodcock k value are shown in Figure. 4. R, αs and s3 indicate general strengthening of the fabric through the entire depth of the core. At 805m, there is a sudden increase in the c-axis concentration, reflecting the formation of a broad single-maximum fabric pattern. Another sharp increase in fabric strength occurs at 2587m depth, indicating the transition from a girdle fabric to a strong single maximum. Eigenvalues s1 and s2 show a general decreasing trend through the depth. However, at 1400–1500m depth, s2 stops decreasing and starts a slight increase while s1 continues decreasing. This variation can clearly be observed from the Woodcock k value, which at this depth indicates a fabric change from a unimodal (k >1) to a girdle (k < 1) pattern. s2 remains constant down to about 1800 mwhere s1 and k both reach minima. After this depth, s2 decreases again with slightly increasing s1, which results in k increasing and finally switching back from a girdle to a unimodal pattern at around 2500m depth . Here, s3 reaches its maximum as both s2 and s1 approach zero. Below 2700 m, a slight decrease of s3 and increase of s2 can be observed. Based on the variation in statistical parameters and the appearance of the fabric diagrams, the core can be divided into five fabric zones as shown in Table 1.
Statistical results as a function of depth. the vertical dashed lines divide the depth into five regimes according to Table1. the typical fabric diagram in each regime is also shown. They are from 148, 1146, 2040, 2633 and 2740 m, respectively. Note that these depths do not correspond exactly to the positions of the diagrams.
The fabric zones divided according to statistical parameters and fabric diagrams
Discussion
Single crystals of ice mainly deform by gliding on their basal planes. Although crystals unfavourably oriented for basal glide can still deform by gliding along prismatic and pyramidal planes, the stress needed to produce a given deformation is up to 100 times higher in this case than for basal glide. In polycrystalline ice, each crystal is constrained by its neighbours, so the crystals have to take up rotation as they deform by basal glide. Being perpendicular to the basal planes, the c axis rotates away from an axis of extension and towards a compression axis. It has recently been argued that grain-boundary sliding can contribute significantly to ice deformation (Reference Peltier, Goldsby, Kohlstedt and TarasovPeltier and others, 2000; Reference Goldsby and KohlstedtGoldsby and Kohlstedt, 2001). However, the experiments upon which this conclusion was based were performed on artificial, ultrafine-grained ice – much more fine-grained than found in natural ice sheets and glaciers – and have then been extrapolated to larger grain-sizes. Moreover, the relatively high temperatures and stresses used in most laboratory creep experiments cannot really reflect the conditions in natural ice masses. Reference Duval, Arnaud, Montagnat and la ChapelleDuval and others (2000) concluded that basal glide is the predominant deformation mode of polar ice.
From experiments with unconfined compression of thin specimens of natural and artificial ice, Reference Azuma and HigashiAzuma and Higashi (1985) found that the strain in each grain was approximately proportional to the Schmid factor for the slip direction, with the bulk strain equal to the strain of individual grains averaged over the entire sample. A numerical simulation of the observed fabric development successfully reproduced a fabric observed at 800 m depth in the Dye 3 core. the model used assumes that ice deforms only by basal glide and that no recrystallization occurs. This model has also been used successfully to simulate fabric development in uniaxial tension in the Mizuho (Reference Fujita, Nakawo and MaeFujita and others, 1987) and Vostok ice cores (Reference Lipenkov, Barkov, Duval and PimientaLipenkov and others, 1989), and Reference AlleyAlley (1988) applied it to four types of stress conditions: uniaxial compression, uniaxial tension, pure shear and simple shear. His simulation results showed that the random fabric observed in the uppermost parts of polar ice sheets transforms to a single maximum at depth in the case of uniaxial compression, to a girdle pattern in the case of uniaxial extension, to a single maximum which is elongated in the direction perpendicular to the axis of tension in the case of pure shear, and to a single-maximum fabric centred on the vertical in the case of simple shear.
Observing the Schmidt diagrams and the calculated statistical parameters, especially the eigenvalues and the Woodcock k value, we find that with increasing depth the fabric changes from random through a broad single maximum to an elongated single maximum at around 1400 m. Below this, the vertical girdle fabric starts to form (k enters 51 regime). This girdle fabric strongly resembles fabrics observed to develop in the Vostok ice core (Reference Lipenkov, Barkov, Duval and PimientaLipenkov and others 1989), due to rotation of c axes away from an axis of horizontal tension.
We now discuss the formation of the vertical girdle fabric in the NorthGRIP core. Reference Hvidberg, Keller and GundestrupHvidberg and others (2002) have used surface velocity measurements in the NorthGRIP area to calculate surface strain rates as

in the directions along and transverse to the ice-divide ridge, respectively. the negative strain rate along the ridge shows that the ice is slowed down as it moves along the north-northwest ridge. Compared with the deformation rate along the ridge, the one transverse to the ridge is about 20 times larger. the ice can be assumed to be undergoing extension transverse to the ridge, slight compression along the ridge and compression in the vertical direction at almost the same strain rate as ͘ε2. the deformation in the upper part of the ice sheet at NorthGRIP can thus be described as confined compression. the plane of the vertical girdle fabric can be assumed to lie in the direction of the ridge, perpendicular to the axis of horizontal extension.
The change from a girdle fabric to a strong single maximumat about 2500 mdepth suggests that simple shear deformation occurs in the lowest part of the ice sheet at NorthGRIP. Although a comparison between the fabrics at 2450m and 2536m suggests a rapid transformation, it seems clear that the c axes start concentrating towards the middle of the girdle fabric as soon as it has been formed, but are not uniformly distributed throughout the girdle. This visual interpretation of the fabrics is supported by the increasing trend in k values below 2000m depth (Fig. 4). A gradual onset of simple shear deformation can thus be inferred from these data.
The effect of the observed fabrics on internal ice-sheet deformation is not clear. the girdle fabric will have some crystals in a ``hard’’ position against vertical compression, but some will be in a ``soft’’ position, with their c axes at or near 45˚ from the vertical compression axis. Similarly, some crystals in this fabric will be in positions favourable for simple shear, whereas others will not. the effect on the thinning rate of the annual layers in the ice cannot be inferred with certainty. Once the single maximum is formed, simple shear deformation will continue to strengthen that fabric, and such a strengthening seems to occur in the interval 2536– 2633m (Fig. 3). Variation in the fabric strength below 2633 m can be due to varying impurity content and crystal size, or to the onset of migration recrystallization at higher temperatures near the bed, producing more open fabrics (Reference Van der Veen and WhillansVan der Veen and Whillans, 1994; Reference De, Chapelle, Castelnau, Lipenkov and DuvalDe La Chapelle and others, 1998). Significant changes in stress conditions near the bed can also lead to variations in fabric strength (Reference Budd and JackaBudd andJacka, 1989), but this is not likely to be important in the NorthGRIP region, where the ice-sheet bed is relatively flat (Reference Dahl-Jensen, Thorsteinsson, Alley and ShojiDahl-Jensen and others, 1997a,Reference Dahl-Jensenb).
Conclusion
A high-resolution study of c-axis fabrics has been performed on the NorthGRIP ice core using an AIFA. from the visual appearance of the fabrics and statistical studies, the core can be divided into five zones with varying fabric characteristics at depths between 100 and 2920 m. This information, combined with results from surface velocity measurements, suggests that the upper two-thirds of the ice sheet at NorthGRIP is undergoing confined compression, i.e. a combination of vertical compression, horizontal tension across the ice divide and horizontal compression along the divide. the well-defined vertical girdle fabric in the depth interval 1500–2500m is the first clear observation of such a fabric in a Greenland deep ice core. In the lower third of the ice sheet, the effect of bed-parallel simple shear can be seen in the fabric development, and vertical single-maximum fabrics dominate below 2500m depth. When borehole data on internal ice-sheet deformation at NorthGRIP become available, it will be possible to learn more about the effect of the fabric changes observed in the core on the rheology of the ice sheet. Such information is crucial for the improvement of ice-sheet models that take into account the development of crystalline anisotropy.
Acknowledgements
We thank N. Azuma for helpful suggestions, and two anonymous reviewers for their valuable comments. This work is a contribution to the NorthGRIP ice-core project, which is directed and organized by the Department of Geophysics at the Niels Bohr Institute for Astronomy, Physics and Geophysics, University of Copenhagen. It is being supported by funding agencies in Denmark, Belgium, France, Germany, Iceland, Japan, Sweden, Switzerland and the United States. Th. Thorsteinsson thanks the Icelandic Research Council (RannIs) for support.



