


Introduction
As of January 2012, battery cages have been banned in the European Union (EU Directive 1999/74/EC), and over 10 states in the US have also prohibited or restricted their use (Ufer Reference Ufer2023). While the prevalence of helminth parasites of chickens (Gallus gallus domesticus) has been decreasing in the developing world, the opposite is the case in developed regions; furthermore birds raised in free-range or backyard environments are more susceptible to infection than those raised in cages (Shifaw et al. Reference Shifaw, Feyera, Walkden-Brown, Sharpe, Elliott and Ruhnke2021a), meaning that helminth-associated morbidity is a growing concern with respect to these legislative shifts.
Ascarids are the most prevalent of the over 30 helminths known to infect chickens, with Ascaridia galli being the most common, followed by Heterakis gallinarum, a caecal nematode that often co-infects with Ascaridia (Shifaw et al. Reference Shifaw, Feyera, Walkden-Brown, Sharpe, Elliott and Ruhnke2021a; Shifaw et al. Reference Shifaw, Feyera, Elliott, Sharpe, Walkden-Brown and Ruhnke2021b). A. galli infections have been reported in various housing conditions, though historically were less prevalent when laying hens were housed in conventional battery cages (Jansson et al. Reference Jansson, Nyman, Vågsholm, Christensson, Göransson, Fossum and Höglund2010; Permin et al. Reference Permin, Bisgaard, Frandsen, Pearman, Kold and Nansen1999; Sherwin et al. Reference Sherwin, Nasr, Gale, Petek, Stafford, Turp and Coles2013; Shifaw et al. Reference Shifaw, Feyera, Walkden-Brown, Sharpe, Elliott and Ruhnke2021a; Shifaw et al. Reference Shifaw, Feyera, Elliott, Sharpe, Walkden-Brown and Ruhnke2021b; Wuthijaree et al. Reference Wuthijaree, Lambertz and Gauly2017). With changes in animal welfare regulations and increasing consumer demand for ‘cage-free’ eggs and meat products, most hens are now kept on litter in large flock housing systems. As a result, the prevalence of ascarid infections has increased (Höglund et al. Reference Höglund, Daş, Tarbiat, Geldhof, Jansson and Gauly2023) leading to economic consequences that include higher feed conversion rates, weight loss and reduced egg production (Stehr et al. Reference Stehr, Grashorn, Dannenberger, Tuchscherer, Gauly, Metges and Das2019; Tarbiat et al. Reference Tarbiat, Jansson, Wall, Tydén and Höglund2020), and even the appearance of worms in chicken eggs (Piergili Fioretti et al. Reference Piergili Fioretti, Veronesi, Diaferia, Pia Franciosini and Casagrande Proietti2005).
Monitoring nematode infection in order to inform parasite control strategies has historically been performed using a variety of manual methods collectively known as faecal egg counts (FECs; Nielsen Reference Nielsen2021). The most commonly used test in clinical practice and agriculture is the McMaster method (McM; Gordon and Whitlock Reference Gordon and Whitlock1939), due to its simplicity and speed. Recent advances in both digital imaging and information technologies have led to the development of a number of automated faecal egg count tests as alternatives to these traditional labour-intensive methodologies (Bucki et al. Reference Bucki, Dhufaigh, O’Brien, Weatherley, Walshe and McElligott2023; Elghryani et al. Reference Elghryani, Lahan, Gohain, Collins, McOwan and de Waal2026; Nagamori et al. Reference Nagamori, Hall Sedlak, DeRosa, Pullins, Cree, Loenser, Larson, Smith and Goldstein2020; Nagamori et al. Reference Nagamori, Sedlak, DeRosa, Pullins, Cree, Loenser, Larson, Smith, Penn and Goldstein2021). The first of these systems to be offered commercially was the original Parasight System (Parasight System Inc., Lexington, KY), which was initially sold for use with equines and then later with ruminants. The central technology behind the system is the use of a fluorescently labelled chitin-binding protein as a probe to label nematode eggshells (Slusarewicz et al. Reference Slusarewicz, Pagano, Mills, Popa, Chow, Mendenhall, Rodgers and Nielsen2016). This facilitates the imaging of a sample with fluorescence optics at low magnification followed by an automated, deep-learning-based classification and enumeration of ova.
The aims of the present study were: (i) to compare the performance of the Parasight All-in-One (AIO) system for ascarids in chickens with the McM test; (ii) to explore optimization of sample preparation, namely determining the optimum density for flotation media; and (iii) to evaluate the relative performance of two Parasight sample preparation protocols.
Materials and methods
Animals and sample collection
All samples consisted of pooled specimens and were obtained from cage–free layer farms that used commercial two-level indoor aviaries (Fienhage Poultry-Solutions GmbH, Lutten, Germany) housing a total of approximately 200,000 white leghorns. Free access to a marine-flooring-coated scratch area with 2.5–7.5 cm of standing litter was available to both levels. Samples were obtained from 23 separate layer houses known to be infected with ascarid-type parasites. Prior to sample collection, a section below the roosting bars in each house was cleaned of bedding and faecal debris. Within 24 hours, approximately 200 g of accumulated faecal matter in that region were collected and placed in airtight bags. Assuming an average dropping size of 5 g per defecation event, these pools constituted approximately 40 separate droppings per pool. Samples were shipped on ice overnight and, once received, were placed into plastic screw-cap specimen containers (Cardinal Health, Dublin OH, USA) and thoroughly homogenised by stirring and folding for a minimum of 2 minutes using a wooden tongue depressor (Puritan Medical Supplies, Guilford, ME, USA). All samples were stored at 4°C until analysis, which was conducted within one week of samples being received. All samples were initially screened and were positive for ascarid-type egg counts. No samples were negative.
Faecal egg counts
Count comparisons
Faecal samples were prepared for analysis utilising two different methods. In the first method (Bulk Prep), the Parasight pasture Sample Preparation Tool (Figure 1A) was used to prepare each sample in bulk. This tool was developed for use with the original Parasight pasture animal device (Cain et al. Reference Cain, Wilson and Slusarewicz2024; Scare et al. Reference Scare, Slusarewicz, Noel, Wielgus and Nielsen2017; Slusarewicz et al. Reference Slusarewicz, Slusarewicz and Nielsen2019) and uses a large (6 g) sample for slurry preparation, only part of which is actually analysed. For each of the 23 samples, 6 g of faeces were combined with 54 mL of sodium nitrate flotation solution (density 1.15 g/mL; FecaMed, Vedco Inc., Saint Joseph, MO, USA) in the tool. The samples were thoroughly homogenised using the tool’s spring–loaded handle and then strained through the filter cap and pooled into a beaker. The resulting faecal slurry was then further swirled to evenly suspend the eggs, and 10 mL was poured into each of three 15 mL conical tubes (Figure 1B), which were then centrifuged at 2000 g for 1 min in a CF-800-1 fixed angle centrifuge (Hardware Factory Store Inc., Azusa, CA).
Sample preparation tools comprising the AIO system. A) Bulk Prep tool with homogenizer and filter cap; B) Single Prep kit comprising 15 mL conical tube containing flotation medium and a ball bearing and an egg separator tool with an integrated 120 μm mesh; C) sample chamber; and D) AIO device where reagents are dispensed and images are captured.

The second sample preparation method (Single Prep) eschewed the use of the Sample Preparation tool. Instead, 1.1 g of faeces from each of the 23 samples were placed directly into a 15 mL conical tube containing a 9.5 mm stainless steel ball bearing (Intech Bearing Inc., Houston, TX, USA) and 11 mL of flotation medium. After the tube was capped, samples were shaken vigorously for homogenization. One mL was first removed and reserved for McM counting, and the tube was then centrifuged as with the first method.
In both methods, an Egg Separator Tool (Figure 1B) consisting of a hollow tube fitted at the distal end with a 120 μm plain-weave stainless steel mesh and isoprene O-ring was inserted into each tube following centrifugation. This tool serves to prevent sedimented material within the sample from contaminating the analysis; the mesh allows ova to pass through into the cylinder’s interior while surface tension at the mesh prevents all material below it from passing through. Following insertion of the Egg Separator, the supernatant was decanted onto a fine mesh incorporated into an apparatus termed the ‘Sample Chamber’ (Figure 1C) which is placed into the receptacle in the Parasight AIO device (Figure 1D). After a vacuum draws the liquid through to the waste receptacle of the Chamber, the device proceeds to bleach, stain, wash, and image the sample (Slusarewicz et al. Reference Slusarewicz, Pagano, Mills, Popa, Chow, Mendenhall, Rodgers and Nielsen2016). The device then performs analysis to identify and enumerate any helminth ova present utilising a deep-learning-trained algorithm (Figure 2).
Representative image of stained ascarid eggs identified by the AIO algorithm. Primary scale = 1.6 mm and inset scale = 250 microns.

Figure 2. Long description
A wide-field fluorescence micrograph displays hundreds of small, oval, glowing green ascarid eggs scattered across a dark, circular field of view. The background has a fine, grid-like mesh texture.
* A white scale bar in the bottom-left corner represents 1.6 mm.
* A white rectangular box in the center-left region of the main field highlights a cluster of approximately ten eggs.
* A white arrow points from this box to a large rectangular inset located in the top-right corner.
* The inset provides a high-magnification view of the highlighted cluster, showing the individual oval eggs in greater detail against the woven mesh substrate.
* A second white scale bar in the bottom-right of the inset represents 250 microns.
Manual counts were conducted using either the same faecal slurry from the pasture preparation tool or the reserved material (1 mL) from the individual 15 mL tubes prior to centrifugation. Each sample was agitated prior to dispensing into both chambers of a McM slide (FEC Source, Grand Ronde, OR, USA) to evenly distribute the eggs throughout the slurry. Slides were allowed to sit for 10 min before manual examination using a Nikon Eclipse E200 microscope (Nikon Corporation, Tokyo, Japan). The resulting multiplication factor (MF) for McM counts using these methodologies is 33.3.
All manual and automated faecal egg counts were conducted together. Automated counts were not conducted until after all manual counts were completed to prevent the introduction of subconscious bias.
Sensitivity
Meaningful sensitivity comparisons can only be made when either one or both tests begin to generate false negative results, since using samples with excessively high counts will lead to all tests being positive (i.e. 100% sensitivity). To assess relative sensitivities of the McM and AIO tests, we obtained fresh samples from some of the aviaries used to generate the count comparison data and rapidly screened them with AIO to identify those with the lowest counts. Those samples were then further screened with McM using multiple subsamples to identify one that produced significant numbers of false negatives.
This sample was then counted 30 times (i.e. 30 individual 1.1 g subsamples) using the Single Prep method and both McM and AIO, as described above. Similarly, 30 individual 6 g subsamples were processed individually using the Bulk Prep method and counted using McM and AIO as described above.
Flotation media optimisation
Six replicate manual and automated counts (using the Single Prep method) of a single, high–count sample were completed and compared for each of seven formulations of sodium nitrate flotation media with differing densities. These solutions were made up using stock sodium nitrate flotation medium (density 1.25–1.30 g/mL; FecaMed, Vedco Inc., Saint Joseph, MO, USA) and diluted using distilled water; the densities were: 1.1, 1.11, 1.12, 1.13, 1.15, 1.18, 1.25 g/mL. The final density of each solution was confirmed gravimetrically using a calibrated pipette and calibrated Pioneer balance (Ohaus, Parsippany, NJ, USA).
Effect of filtration
Three 6 g subsamples of the same faecal specimen were processed with the Parasight pasture sample preparation tool as described above for the Bulk Prep method. Rather than squeezing out and pooling the entire contents of the tool, however, the samples were dispensed sequentially into 3 individual 15 mL centrifuge tubes (10 mL, i.e., 1 g, per tube) prior to processing and counting with the AIO as described above. In addition, three individual Single Prep tests were performed using the same faecal sample to provide a ‘0 squeeze’ baseline.
Flotation media optimisation
Six replicate counts of the same pooled faecal sample processed using seven different flotation media formulations with different densities were compared. Data was assessed for normality using Shapiro–Wilk test and was determined to be normally distributed (p > 0.05). Mean values for each formulation were calculated, and differences were assessed using ANOVA with Tukey’s post hoc correction for repeated measures.
FEC method agreement
Correlation was assessed between McM and the AIO system for both preparation methods using the mean raw counts. These were assessed by the coefficient of determination (R2) using Pearson’s product-moment correlation. Correlation is considered to be strong when R2 > 0.75 and α < 0.05. Spearman’s rho was also assessed for this data because of concerns regarding skew and outliers; however, because of repeated values, exact p-values could not be calculated, and thus asymptotic (approximated) p-values were used. In addition, 95% confidence intervals for the correlations were computed in R.
Agreement between McM and the automated AIO system for both Single and Bulk Prep methods was assessed via Bland-Altman plots after converting raw counts into EPG values.
Precision
Precision was analysed by calculating the Coefficient of Variation (CV) for triplicate counts using each of the three sample preparation methods (AIO Single Prep, AIO Bulk Prep, McM) for all 23 samples. Data was assessed for normality using Shapiro–Wilk’s test. Since the CV data was considered non-normal (p < 0.05), comparisons were assessed using Kruskal–Wallis test with Dunn’s post hoc analysis and effect size calculation.
Statistical analysis
All statistical analyses were completed using R version 4.5.2 (R Core Team, 2021) utilising the following packages: rstatix, blandr, ggpubr, and ggplot2. All differences were considered significant at p < 0.05.
Results
Flotation media optimisation
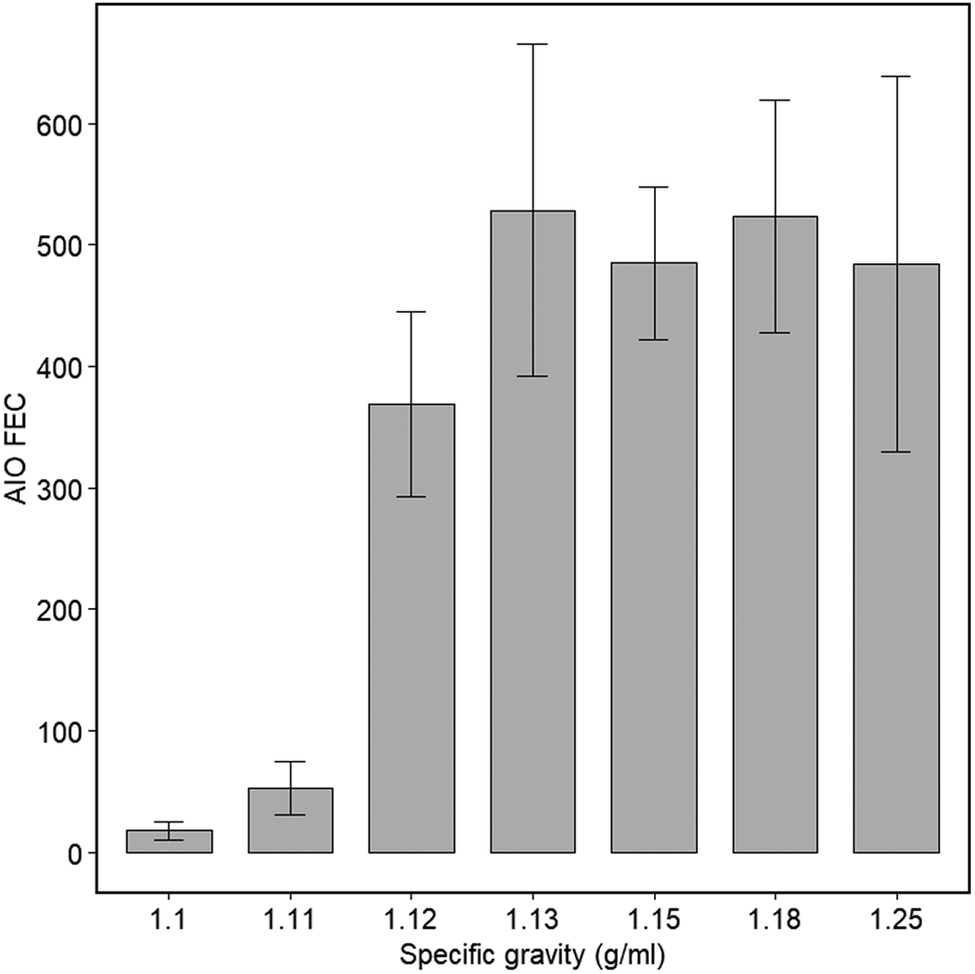
Mean FECs determined using the AIO system and flotation media of differing densities are depicted in Figure 3. Mean counts using densities of 1.1 and 1.11 g/mL were significantly lower than those of all the other densities (p < 0.001) but were not significantly different from each other. Conversely, mean counts for densities 1.13, 1.15, 1.18, and 1.25 g/mL were only significantly different from 1.1, 1.11, and 1.12, but were not different from one another (p < 0.001). A density of 1.15 g/mL was used for the remainder of the study.
Comparison of replicate Parasight AIO counts utilising different formulations of flotation media with varying densities.

Figure 3. Long description
The x-axis is labeled Specific gravity (g forward slash ml) with seven discrete values: 1.1, 1.11, 1.12, 1.13, 1.15, 1.18, and 1.25. The y-axis is labeled A I O F E C with numerical increments from 0 to 600.
Data trends from left to right:
* At 1.1, the bar is very low, near 20.
* At 1.11, the bar rises slightly to approximately 50.
* At 1.12, there is a significant increase to approximately 370.
* At 1.13, the count peaks at approximately 530.
* At 1.15, the count drops slightly to approximately 480.
* At 1.18, the count rises again to approximately 520.
* At 1.25, the count is approximately 480.
Each bar includes vertical error bars. The error bars for the first two densities are small, while the error bars for densities 1.12 through 1.25 are much larger, indicating higher variance in those samples.
Correlation of automated and manual counts
Raw faecal egg count correlation data are depicted in Figure 4A and B. Using Pearson’s product-moment correlation, a strong linear correlation was demonstrated between AIO and McM counts, regardless of sample preparation method (Single Prep: R2 = 0.801, 95% CI = 0.765–0.955, p < 0.001; Bulk Prep: R2 = 0.931, 95% CI = 0.917–0.985, p ≤ 0.001). Using Spearman’s rho, a very strong positive correlation was demonstrated between AIO and McM counts for both preparation methods (Single Prep: rho = 0.886, p ≤ 0.001; Bulk Prep: rho = 0.926, p ≤ 0.001). The AIO detected 16 times more eggs on average compared to McM when using the Bulk Prep method (as assessed by the slope of the linear regression), and 24 times more eggs on average with the Single Prep method. Overall raw mean counts were also higher using the AIO Single Prep method (Mean = 243.51 eggs; 95% CI = 227.44–259.57) compared to AIO Bulk Prep (Mean =161.09 eggs; 95% CI = 149.57–172.60) and McM (Mean = 10.02 eggs; 95% CI = 9.22–10.82).
Scatterplots of A) all individual raw counts for the Parasight AIO system and McMaster using the Bulk Prep method and B) all individual raw counts for the Parasight AIO system and McMaster using Single Prep method. Each point represents the mean of three replicate counts. The solid blue line represents the least-squares best-fit linear regression for the data, while the red broken lines represent 95% confidence intervals. The same data were converted to EPG and graphed as Bland-Altman plots for the C) Bulk Prep and D) Single Prep methods.

Figure 4. Long description
A four-panel figure arranged in a two-by-two grid.
Panel A, top-left: A scatterplot titled Bulk Prep. The x-axis is Raw McMaster Egg Count from 0 to 35. The y-axis is P S A I O Raw Egg Count using Bulk Prep from 0 to 600. Data points show a strong positive linear correlation with an R-squared value of 0.931. A solid blue best-fit line is flanked by red dashed 95 percent confidence interval lines.
Panel B, top-right: A scatterplot titled Single Prep. The x-axis is Raw McMaster Egg Count from 0 to 30. The y-axis is P S A I O Raw Egg Count using Single Prep from 0 to 1000. Data points show a positive linear correlation with an R-squared value of 0.801. A solid blue best-fit line is flanked by red dashed 95 percent confidence interval lines.
Panel C, bottom-left: A Bland-Altman plot titled Bulk Prep A I O versus M M Agreement. The x-axis is Mean of Measurements from 0 to 1400. The y-axis is Difference of Measurements from minus 600 to 600. Most data points cluster near the zero line, with red dashed lines indicating the limits of agreement.
Panel D, bottom-right: A Bland-Altman plot titled Single Prep A I O versus M M Agreement. The x-axis is Mean of Measurements from 0 to 1400. The y-axis is Difference of Measurements from minus 600 to 600. Data points show higher variance compared to panel C, with wider red dashed lines indicating the limits of agreement.
Agreement between AIO and McM counts with both preparation methods was assessed after conversion of raw counts to EPG using Bland-Altman plots (Figure 4C and D). In both cases only one of the 23 data points lay outside the limits of agreement. No constant bias, proportional error, or heteroscedasticity was apparent.
Sensitivity
Thirty independent subsamples of a low-count specimen were tested by McM and AIO using both the Bulk and Single Prep methods. The approximate egg concentration of this sample, as determined by averaging the EPGs of all four series of counts, was 10 EPG. In the case of Single Prep, McM detected eggs in 7 of the 30 samples when using the Single Prep method (23.3% sensitivity) while AIO detected eggs in 29 samples (96.7%). Using the Bulk Prep method, McM detected 10 positive samples (33.3%) while AIO again detected 29 (96.7%). In each positive sample identified by McM, a single egg was detected, whereas AIO detected a range between 1 and 8 eggs (Mean = 3.6 ± 2.1 SD) when using the Single Prep, and a range of 1–13 (Mean = 6.0 ± 3.2 SD) when using the Bulk Prep.
Precision
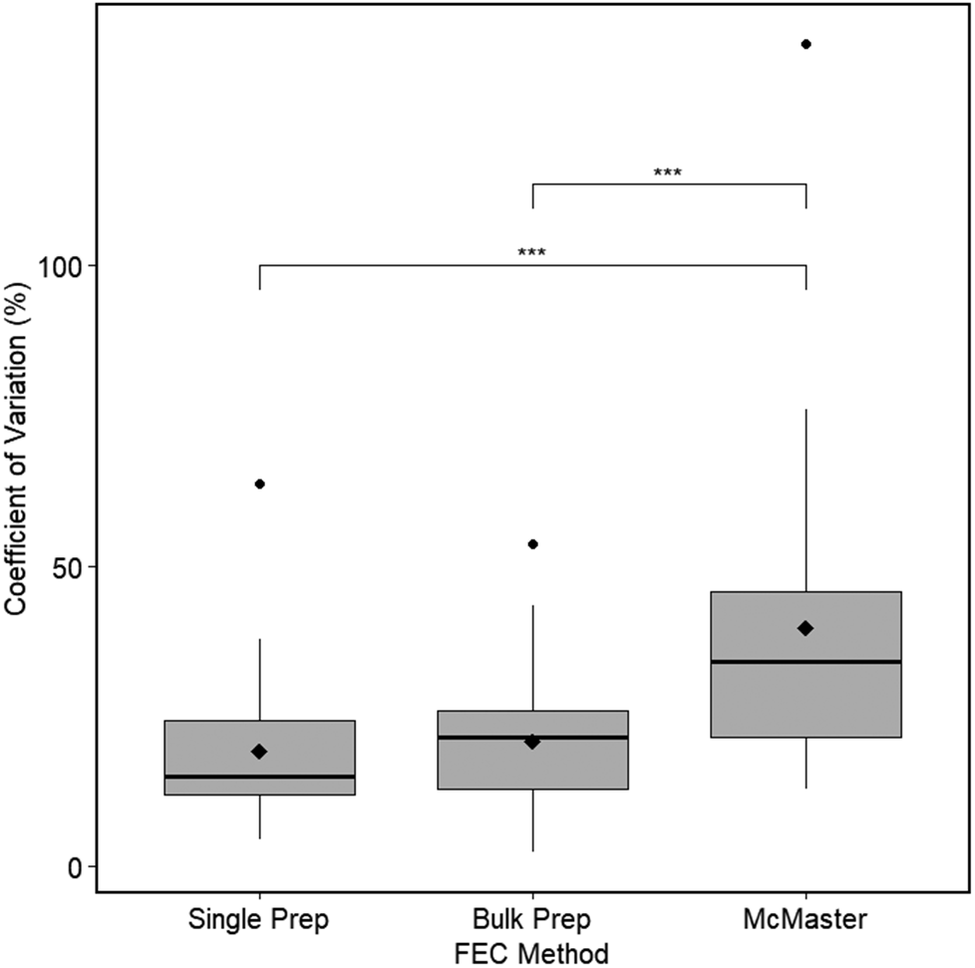
Median precision data (coefficients of variation; CVs) are depicted in Figure 5. Median CVs were 15.06% for the Single Prep method, 21.52% for the Bulk Prep method, and 34.02% for McM. Median precision was significantly higher for both the automated counting methods (AIO Single and AIO Bulk methods) compared to McM counts (p ≤ 0.001; p ≤ 0.004). There was no significant difference in AIO precision between the Bulk and Single Prep methods. The effect size for this comparison was large (0.206).
Median levels of FEC precision (Coefficient of Variation) using the revised AIO Single Prep method, the pasture tool AIO Bulk Prep method, and the McMaster FEC method. Mean values are indicated by closed diamonds and outliers by closed circles, while three asterisks indicate significant differences (p < 0.05).

Figure 5. Long description
The Y-axis is labeled Coefficient of Variation (percent) with a scale from 0 to 100 and an outlier point near 150. The X-axis is labeled F E C Method and contains three categories from left to right.
* Single Prep: Shows the lowest median and mean (closed diamond) values, both below 25 percent. It has one outlier circle near 65 percent.
* Bulk Prep: Shows a slightly higher median and mean than Single Prep, with values clustered between 10 and 25 percent. It has one outlier circle near 55 percent.
* McMaster: Shows the highest variability and highest median and mean values, with the box ranging from approximately 20 to 45 percent. It has a very high outlier circle near 150 percent.
Statistical significance brackets with three asterisks connect Single Prep to McMaster and Bulk Prep to McMaster, indicating significant differences between these methods.
Effect of filtration
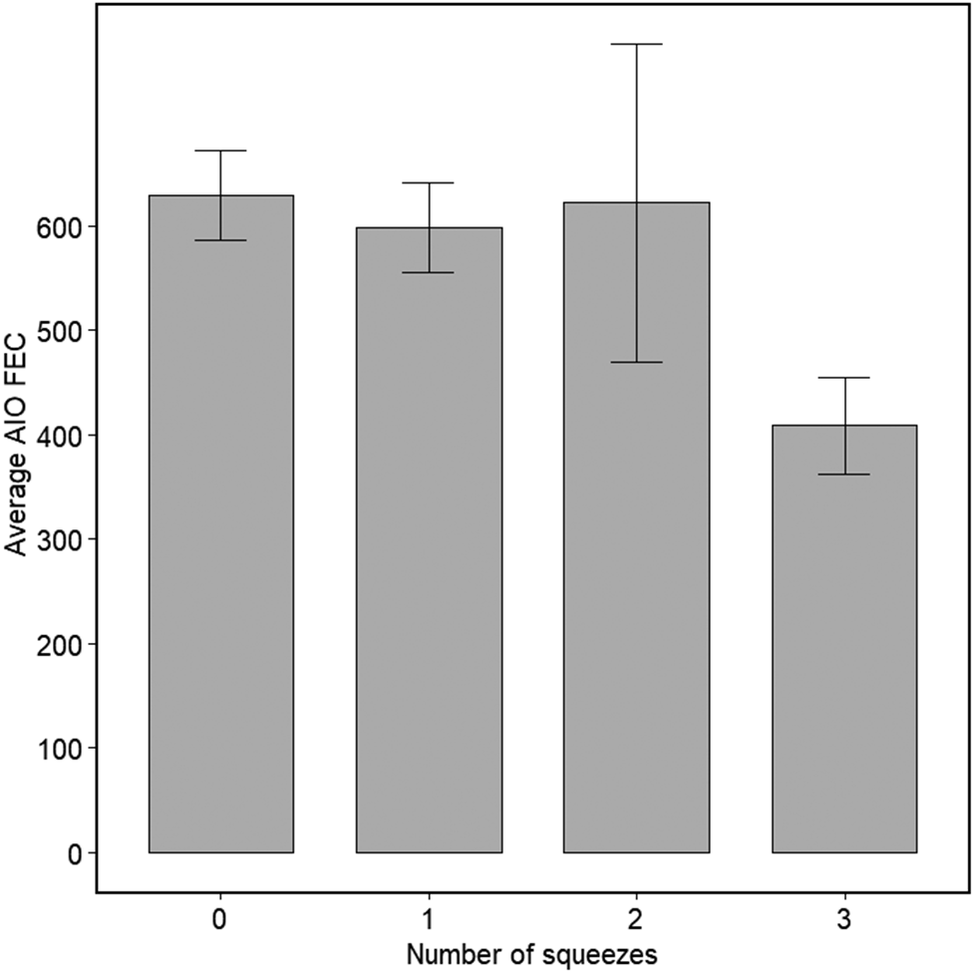
Unfiltered samples produced a mean count of 601 eggs, while the first, second, and third dispenses from the pasture sample preparation tool produced mean counts of 599, 622, and 408, respectively (Figure 6). There were no significant differences between any of the counts.
Effect of pasture tool filtration on egg recovery. AIO faecal egg counts using the Single Prep method (0 squeezes) were compared to counts from sequential 10 mL squeezes of the same slurry from the pasture tool. Each bar represents the mean of 3 independent experiments using the same faecal sample ± SD.

Discussion
The Parasight AIO is a second-generation device, making a number of improvements on the original Parasight System, including doubling the magnification, improving the quality of the optics and the imaging sensor, and integrating reagent dispensing and imaging functionality into a single unit. The original system has been validated for use with a number of pasture animals (Cain et al. Reference Cain, Gianechini, Vetter, Davis, Britton, Myka and Slusarewicz2023; Scare et al. Reference Scare, Slusarewicz, Noel, Wielgus and Nielsen2017; Slusarewicz et al. Reference Slusarewicz, Slusarewicz and Nielsen2021) as well as chickens (Cain et al. Reference Cain, Wilson and Slusarewicz2024). In this study we optimised sample preparation of the new AIO system and then assessed its performance in detecting and enumerating ascarid ova in chickens.
Previous studies have established that various ascarid species, such as Parascaris spp., Toxascaris leonina, Toxocara canis, and T. cati, all have densities at or around 1.10 g/mL, meaning these eggs should all float in a solution of greater density (David and Lindquist Reference David and Lindquist1982; Norris et al. Reference Norris, Slusarewicz and Nielsen2019); however, to the authors’ knowledge, the exact density of chicken ascarids has not been described. During the development of the AIO system, we therefore examined the effect of varying media densities on the recovery of chicken ascarid ova. Mean counts for densities of 1.13, 1.15, 1.18, and 1.25 g/mL did not differ and were significantly higher than at 1.1, 1.11, and 1.12 g/mL, suggesting that these chicken ascarids are slightly denser than those of other species. We therefore selected 1.15 g/mL for this study in order to maximize egg recovery while providing a safety cushion with regard to accidental over-dilute media preparation.
Here, we demonstrated that the AIO detected a larger number of ova in each paired sample than the manual McM method, and that counts generated by Parasight AIO correlated strongly with those determined via McM, regardless of which sample preparation methodology was utilized. The differences in count magnitudes occurred because of the larger amount of faeces analysed using AIO compared to McM. The AIO can examine substantially more material because sample filtration and the resulting capture and concentration of ova on a mesh surface are inherent parts of the system, allowing it to concentrate and analyse a relatively large amount of sample on a small surface area.
The sample preparation methods used in this study all produced slurries containing 0.1 g of faeces in 1 mL of FM. As a result, each McM count (using both grids of the slide) examined 0.03 g of faeces. The MF used for converting raw counts to eggs/gram (EPG) was therefore 33.3 (i.e. 1/0.03). In contrast, the AIO used 1 g of faeces for both sample preparation methods (i.e. 1 g of faeces added directly to the centrifuge tube, or 10 mL of the 0.1 g/mL slurry); thus, both AIO methods theoretically have an MF of 1×. Based on these numbers, therefore, the AIO would be arithmetically expected to count 33.3× more eggs on average than McM. This was clearly not the case here since the AIO methods produced counts that were only ~15–24 times greater than McM (depending on the sample preparation method). One inference from these observations is that McM is more efficient than AIO in extracting/detecting eggs, but this superior efficiency cannot overcome the large difference in the amount of sample examined when it comes to the numbers of eggs detected in a test. This effect has been reported previously (Britton et al. Reference Britton, Ripley and Slusarewicz2024; Castle et al. Reference Castle, Britton, Ripley, Ubelhor and Slusarewicz2024) and runs counter to a commonly held misconception that the relative performance of different egg counting methods can be determined simply by comparing MFs. The data presented here further emphasise that relative test performances cannot be simply deduced from relative MF magnitudes but rather can only be determined empirically by studies such as the one presented here. These differences are most likely due to differential egg loss/recovery levels between different methods. In this case, possibilities include egg entrapment in faecal sediments during centrifugation, particularly if faecal samples were not well homogenised, entrapment during post-centrifugal filtration, and concealment of eggs under faecal debris on the egg chamber, which is exacerbated in faecal samples with high lipid content.
Furthermore, counts generated using the Bulk Prep method yielded lower overall raw counts than the Single Prep method (cf. line slopes in Figure 4A and B), showing that even subtle differences between methodologies can substantially affect test results. One possible explanation for this discrepancy could be the result of prefiltering of the sample when using the bulk sample preparation tool.
We tested this hypothesis by dispensing sequential 10 mL aliquots from the tool into separate centrifuge tubes and counting the number of eggs in each following centrifugation and processing. Although there were no statistically significant differences between the number of ova recovered in any of the samples (including unfiltered material), the third squeeze contained one-third fewer eggs than the unfiltered material and the first and second squeezes. This suggests that filter fouling may play a role in producing the lower counts found using the Bulk Prep method but, since only three replicates were used in this experiment, additional testing to increase statistical power would be required to overcome the biological variability inherent in this experimental design and to determine whether this is truly the case.
Demonstrating linear correlation between previously established techniques like McM and new techniques such as Parasight All-in-One is important for proof-of-concept demonstration of novel methodologies, and such correlations have been frequently used in the validation of novel techniques (Bucki et al. Reference Bucki, Dhufaigh, O’Brien, Weatherley, Walshe and McElligott2023; Cringoli et al. Reference Cringoli, Amadesi, Maurelli, Celano, Piantadosi, Bosco, Ciuca, Cesarelli, Bifulco, Montresor and Rinaldi2021; Elghryani et al. Reference Elghryani, Crispell, Ebrahimi, Krivoruchko, Lobaskin, McOwan, O’Connor, Power, Voisin, Scholz and de Waal2020; McEvoy et al. Reference McEvoy, O’Boyle, Ellis, Dalton, Parkinson, Keane and Machin2024; Nagamori et al. Reference Nagamori, Hall Sedlak, DeRosa, Pullins, Cree, Loenser, Larson, Smith and Goldstein2020; Nagamori et al. Reference Nagamori, Sedlak, DeRosa, Pullins, Cree, Loenser, Larson, Smith, Penn and Goldstein2021; Noel et al. Reference Noel, Scare, Bellaw and Nielsen2017; Slusarewicz et al. Reference Slusarewicz, Slusarewicz and Nielsen2019). Empirical determination of the relative performance of traditional tests with novel methodologies using data such as those presented here facilitates the interconversion of results into metrics with which clinicians are more familiar, particularly in the context of informing parasite control programs. For example, using MFs of 2.1 (33.3/16) for the Bulk Prep method or 1.3 (33.3/25) for the Single Prep method would convert AIO raw counts to study-derived, McM-aligned EPG estimates. Such conversions to more familiar metrics may facilitate result interpretation by veterinarians using familiar McM-based EPG metrics. It should be noted, however, that it cannot be assumed the linear relationship observed here extends to higher egg counts, and so interconversion is only valid for the range used in this study (up to ~1000 EPG). Further work with higher-count samples will be required to determine whether this relationship still holds at higher EPGs.
Raw counts from both AIO sample preparation methods used in this study exhibited strong linear correlations with McM raw counts of the same samples, with the Single Prep method exhibiting a slightly higher correlation (cf. Figure 4A and B). Converting raw counts to EPG for all methods facilitated the generation of Bland-Altman plots that showed high agreement between McM and both AIO methods with no obvious bias (Figure 4C and D).
Another important parameter is the raw number of eggs counted. Here, AIO counted more than an order of magnitude more eggs than McM regardless of preparation method, and such a large difference in the numbers of ova detected by a test leads to corresponding large increases in test sensitivity, which we have previously demonstrated (Britton et al. Reference Britton, Ripley and Slusarewicz2024; Castle et al. Reference Castle, Britton, Ripley, Ubelhor and Slusarewicz2024). More recently, this same phenomenon has also been demonstrated with microfilariae (Ripley et al. Reference Ripley, Smith, Chen, Calcote, Moorhead, Campbell and Slusarewicz2026).
Here, we have again demonstrated the validity of this inference. Thirty independent sequential counts of a single 10 EPG specimen using McM and both the AIO preparation methods produced sensitivities of 23.3% and 33.3% for McM with the Single and Bulk Prep methods, respectively, while in both cases the sensitivity for AIO was 96.7%.
Higher raw egg counts are particularly relevant in the context of faecal egg count reduction tests (FECRTs). Such testing is used to monitor anthelmintic drug treatment efficacy in the face of an increasing frequency of resistance, and involves conducting two FECs, one before and one post-treatment, using the magnitude of the change in egg counts as a proxy for treatment efficacy. Instances where initial egg counts are low can be problematic for detecting true reduction post-anthelmintic treatment due to the randomness introduced during sampling and subsampling. With this phenomenon in mind, recent guidelines for FECRT in livestock species have emphasized the importance of selecting a diagnostic tool with higher raw eggs counted (Kaplan et al. Reference Kaplan, Denwood, Nielsen, Thamsborg, Torgerson, Gilleard, Dobson, Vercruysse and Levecke2023) in order to generate data with sufficient power on which to base clinical decisions. In practice, this requires multiple sequential counts of a sample until the raw egg threshold has been attained. At low egg counts (raw McM ≤5 eggs), this study demonstrated an average 15–24× increase in raw eggs counted using the AIO system, suggesting the automated system may be useful for FECRTs when raw egg counts are quite low.
Due to the nature of subsampling and inherent biological sample inhomogeneity, all FEC methods are subject to some degree of variability. Biological variability can be attributed to differences in individual animal parasite load and subsequent shedding patterns, as well as uneven egg distribution within the faeces itself (Cain et al. Reference Cain, Slusarewicz, Rutledge, McVey, Wielgus, Zynda, Wehling, Scare, Steuer and Nielsen2020), and manifests as (often large) count differences between subsamples of the same faecal specimen. The other source of variation is more concerned with the variability within a given diagnostic test – that is, differences between repeated counts of the same homogenous faecal slurry where egg distribution is more (but not perfectly) even. This technical variation stems from imperfections in the homogeneity of egg distribution in the slurry and its subsequent Poisson-like subsampling; this variation increases as a function of decreasing egg count (Torgerson et al. Reference Torgerson, Paul and Lewis2012). This variability can be reduced by performing repeated counts on the same individual slurry and averaging the results (which reduces the confounding technical variation element). However, performing repeated counts is time-consuming and so may not be feasible in clinical practice, and so tests with reduced technical variability (or greater precision) are more likely to produce an accurate result from a single reading. A test’s precision can be evaluated by conducting multiple counts on the same faecal slurry and calculating the coefficient of variation (CV) of the repeated count values; lower CVs connote higher levels of precision. In this study, we demonstrated that the AIO operates with a significantly higher level of precision compared to McM (1.6× and 2.3× for the Bulk and Single Prep methods, respectively).
One drawback of this study was our inability to unequivocally determine the species of the ascarids in the samples used. While these samples were obtained from flocks of housed layer hens that historically have been most commonly infected with A. galli, because H. gallinarum ova are essentially morphologically indistinguishable, we were unable to confirm this when conducting McM counts; we therefore cannot guarantee the samples were entirely free of H. gallinarum. The chitin-binding protein used to stain the A. galli eggs is not specific to this particular parasite, meaning that it will stain other parasite eggs containing chitin, including all other nematodes we have tested to date. Thus, it is likely that the stain will also bind to H. gallinarum, and it is unlikely that there are sufficient morphological differences for these two species to be differentiated using the image classifier. As a result, it is highly probable that both types of ascarid, if present, were detected in this study. Further investigation using samples known to be infected with only A. galli or H. gallinarum will be required to determine whether they could be distinguished by a suitably trained model.
Another drawback of this study was that we could not obtain any uninfected samples with which to assess specificity; this is a matter that we plan to address in a future study. Furthermore, this study only used one sample for sensitivity assessment due to a lack of samples with sufficiently low counts that would facilitate a true comparison of the sensitivities of the two methods. Procurement of such samples for additional testing is the goal of a future study.
In summary, the automated AIO system was demonstrated to be a suitable method for the detection and enumeration of ascarid ova in chicken faeces. Overall, the AIO system counted more individual raw eggs (and so detected eggs in a low-EPG sample more frequently) and was more precise than the traditional manual McM method. Thus, this system provides an alternative FEC methodology for veterinarians and commercial operations for use in parasite surveillance and anthelmintic treatment control programs. Future work will be focused on expanding the AIO system for the detection of other helminths and avian coccidia (which may include revisiting FM density) as well as its potential application in faecal egg count reduction tests to monitor drug efficacy and emerging anti-parasitic drug resistance.
Acknowledgements
The authors are grateful to Marissa Gregory and Versova for providing some of the samples used in this study. We would also like to thank Nichol Ripley and Megan Slusarewicz for their comments and suggestions after proofreading the manuscript.
Financial support
This study was funded by Parasight System Inc.
Competing interests
MS is a part-time employee and PS and TT are full-time employees of Parasight System Inc. PS holds stock and stock options in Parasight System Inc. DW and ML have no conflicts to declare. Parasight System Inc. is currently marketing the test described in this study.
Ethical standards
Not applicable.




 Open access

