I. INTRODUCTION
Metal foams (MFs) are a relatively new class of engineering materials having several unique properties including ultra-lightweight, attractive mechanical energy absorption characteristics, and high strength-to-weight ratios as compared to their bulk counterparts.Reference Ma and Song1–Reference Koza, Leonowicz, Wojciechowski and Simancik3 These striking properties of MFs make them suitable for applications in wide areas such as impact energy absorption, load-bearing sandwich cores in aerospace and automobile industries, in automobile components to reduce weight, as heat sinks for thermal management in electronic components, heat shields, fortifying building and transport structures against buckling and impact, etc.Reference Nieh, Higashi and Wadsworth4,Reference Zhao5 Based on the cell characteristics, the MFs can be classified as closed-cell and open-cell types.Reference Jiang, Zhao, Shi and Li6 In closed-cell foams, each cell is completely sheltered by a thin solid nonpermeable metal crust, whilst in open-cell foams, the individual cells are interconnected and provide a path for air or any fluid to pass through them. The closed-cell foams are usually required for lightweight structure while open-cell foams are required where surface exchange phenomena are involved or where permeability or pore connectivity is required.
Al-based alloy foams have attracted much attention due to their low cost, relatively easy manufacturing process of required functional geometries, and better mechanical properties compared to other low melting temperature metals/alloys. The mechanical properties of these foams can be tailored over a wide range by controlling the foam parameters such as ρrel [defined as the ratio of foam density (ρ*) and density of the parent material (ρs)], porosity (Ø), morphology (shape and size of the cells), and alloy composition, and can be shaped into multifunctional components having a wide range of industrial applications.Reference Paul and Ramamurty7–Reference Michailidis, Stergioudi, Tsouknidas and Pavlidou9 The processing route and the conditions for the fabrication of MFs also contribute significantly in determining the cell morphology, which drastically influence the mechanical properties of the derived foams.Reference Koza, Leonowicz, Wojciechowski and Simancik3,Reference Nieh, Higashi and Wadsworth4,Reference Cao, Wang, Ma, Zhao and Yang8 In general, homogeneous distribution of spherical pores in the foam is preferable since it forms regular cell arrangement and provides uniformity in ρ* distribution that makes the testing and interpretation of the mechanical behavior of the foam less complicated.Reference Bafti and Habibolahzadeh10 Moreover, theoretical predictions of the mechanical properties become easier and more accurate with such homogeneous cell structures. Irregular foam morphology leads to inhomogeneous deformation and strange (e.g., jagged) flow curves and trims down the mechanical properties by factors ranging from 2 to 100.Reference Bafti and Habibolahzadeh10
Among the various methods being explored for the manufacturing of MFs, the processes showing good reproducibility of the foam morphology and allowing precise control over the foam parameters are highly preferable for industrial production. Different processing routes, e.g., investment casting, melt gas injection, powder metallurgy, etc., have been widely experimented in fabricating MFs with tailored morphology. Detail reviews of manufacturing methods and characterization of porous metals are available in Refs. Reference Jiang, Zhao, Shi and Li6 and Reference Ashby, Evans, Fleck, Gibson, Hutchinson and Wadley11–Reference Kim and Lee19. Despite the intense efforts, only few of the currently available MF production methods allow an accurate control over pore morphology. Among these methods, the casting-based processes are considered most convenient for the fabrication of Al-based foams with uniformity in cell shape and size.Reference Ma and Song1,Reference Marchi and Mortensen13–Reference Jiang, Fan, Liu, Dong, Wu and Wang17 In such processes, quite often vacuum is required for proper infiltration of the melt in the preform structures. Needless to say, the requirement of vacuum increases the manufacturing cost of the foams when produced on bulk scale.Reference Palmer, Gao, Doan, Green and Cavallaro14,Reference Jinnapat and Kennedy16 The process parameters in casting methods, viz, processing temperature, vacuum level, applied pressure, reactivity of the gas with the melt, etc., play vital roles in controlling the ρ* and morphology of the MFs, which effectively controls the mechanical properties of the derived MFs. For example, the interconnectivity among the open pores (foam morphology) is dependent on the applied gas pressure and the melt viscosity (function of temperature) during infiltration. If the foaming or casting is carried out in ambient atmosphere, impurities in the form of oxides or other secondary phases may be formed in the melt, which will influence the mechanical properties of the derived foams.
The objective of the present work is to study the mechanical properties of Al-based MFs having interconnected open-cell morphology fabricated by a customized processReference Soni and Biswas20,Reference Soni and Biswas21 of pressurized infiltration casting in ambient atmosphere without any requirement of vacuum using NaCl beads of selected size as space holders. In this paper, compressive properties of MFs of two different compositions, viz, pure Al and 7075-T6 alloys with sample dimension of at least 9 times of the average C s valueReference Ashby, Evans, Fleck, Gibson, Hutchinson and Wadley11 are reported. The study aims to compare the effects of foam parameters such as ρrel and C s on the compressive mechanical properties such as E, yield strength (Y s), plateau stress (σpl), εd, W, and I m in the two different foam compositions (but closely related in other aspects) at two different έ. A typical value of 0.002 s−1 represents a quasi-static έ, while έ = 2.0 s−1 represents a static or intermediate value.
II. METHOD
A series of open-cell foam samples of pure Al and 7075-T6 alloy of a wide range of Ø (50–70%) were developed by a relatively simple and cost effective method involving pressurized (1–4 bar pressure of Ar gas) salt infiltration casting process.Reference Soni and Biswas20,Reference Soni and Biswas21 Presintered NaCl beads of nearly spherical shape of selected diameters were sieved and packed in graphite crucibles to form the preforms. Small pieces (chunks) of the metal/alloy were arranged on the salt preforms in the crucibles placed inside a tube furnace. The furnace was heated up to a temperature of 700 °C under continuous flow of Ar gas. The gas pressure was precisely controlled both at the inlet and outlet of the furnace chamber to support proper infiltration of the molten metal/alloy into the voids of the NaCl preforms. After the pressurized casting, the temperature of the furnace was quickly lowered down at least 50 °C below the solidus temperature of the metal/alloy with a chilling arrangement attached with the furnace chamber. In the next step, the gas pressure was released and the samples were quickly taken out of the furnace and quenched in chilled water.
Typical specimens with a height to diameter (H/D) ratio (aspect ratio) of 1.2 (H = 6 cm; D = 5 cm) were cut from the parental foam blocks using electrical discharge machining to minimize cell edge damage. This ensures that the test samples have dimensions of at least 9 times larger than the average C s value in any direction. As discussed before, the ρrel is one of the most important parameters directly influencing the mechanical properties of cellular foams.Reference Gibson and Ashby22,Reference Surace, De Filippis, Ludovico and Boghetich23 The ρ* values were calculated by measuring the foam volume and weight. Ø was obtained from the relationship, Ø = 1 − (ρ*/ρs). The morphology (C s, pore distribution, strut thickness, etc.) in the developed foams was studied with X-ray computed tomography (CT) scanning. The ρs of the alloy was considered to be 2.7 g/cm3 (same as pure Al) to calculate ρrel. A universal testing machine (WAW 600B Electro-Hydraulic Servo with maximum load 600 kN, Jinan Liangong Testing Technology Co., Ltd., Jinan, China) was used to study the compressive properties of the developed samples at two different loading rates (quasi-static, έ = 0.002 s−1; and static, έ = 2.0 s−1) following the ASTM E9-09 standard.24 A total of 5 samples for each ρrel values (of both materials) were tested at both έ.
The strength of the cell walls (σy) was determined by the microhardness indentation test and was considered to be one-third of the hardness value (HV) of the solid material (σy = HV/3).Reference Bafti and Habibolahzadeh10,Reference Murr, Amato, Li, Tian, Cheng, Gaytan, Martineza, Shindo, Medina and Wicker25,Reference Mahmutyazicioglu, Albayrak, Ipekoglu and Altintas26 The foams were filled with resin and hardener in 10:1 ratio, ground using 2000 grit emery paper, and finally polished using diamond paste. The microhardness of the cell walls was tested using an Innovatest Falcon 500 microscopic hardness meter (Maastricht, the Netherlands) with a load of 50 g and a dwell time of 10 s. At least ten hardness readings were noted and the average was taken to eliminate any experimental anomaly.
σpl is defined by the following expression (energy absorption efficiency-based approach)Reference Wang, Shen, Lu and Zhao27:
 $${\sigma _{{\rm{pl}}}} = {{\int_{{\varepsilon _{\rm{y}}}}^{{\varepsilon _{\rm{d}}}} {\sigma \left( \varepsilon \right){\rm{d}}\varepsilon } } \over {{\varepsilon _{\rm{d}}} - {\varepsilon _{\rm{y}}}}}\quad ,$$
where εy is the strain at yield point and εd is approximated to be the strain at the onset of the densification region. The εd is an important parameter used to characterize the mechanical properties of foams and is highly sensitive to the έ, foam morphology, and microstructure in the struts.Reference Wang, Shen, Lu and Zhao27,Reference Schüler, Fischer, Bührig-Polaczek and Fleck28 To identify the onset of the densification mechanism accurately, few empirical methods were developed.Reference Paul and Ramamurty7,Reference Wang, Shen, Lu and Zhao27,Reference Li, Magkiriadis and Harrigan29 We have followed the energy efficiency-based approach as described by Wang et al.Reference Wang, Shen, Lu and Zhao27
III. RESULTS AND DISCUSSION
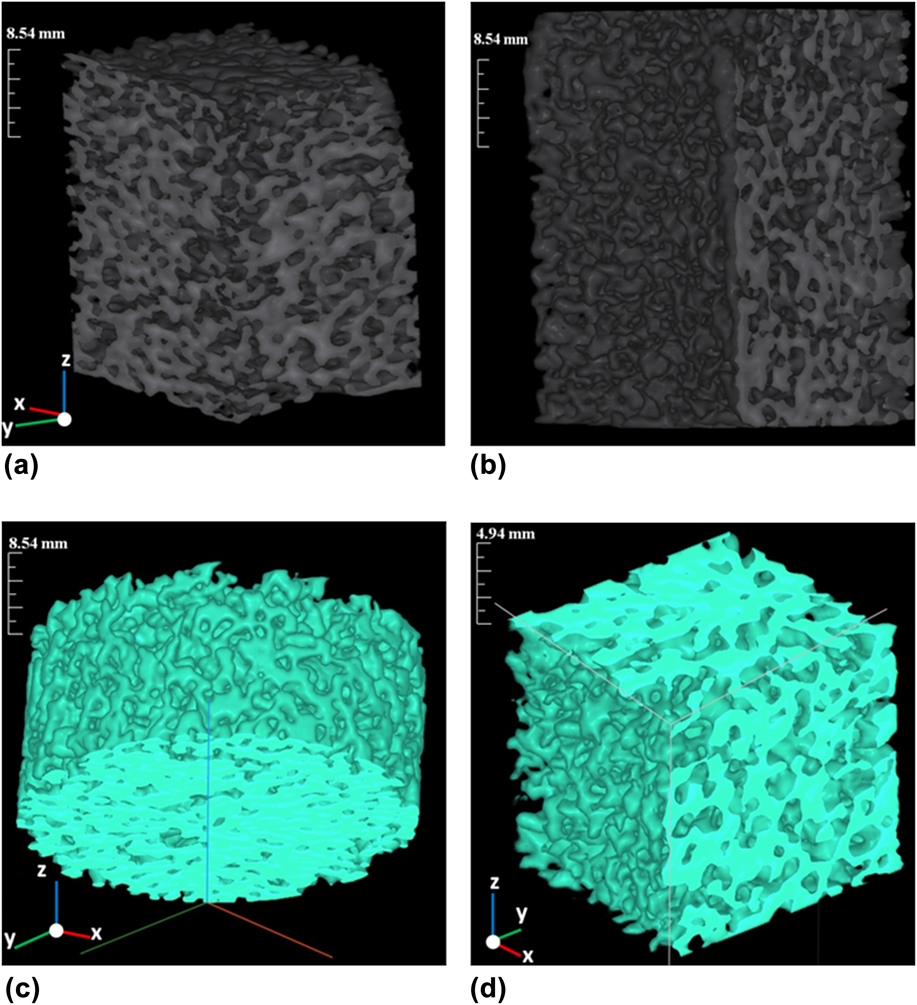
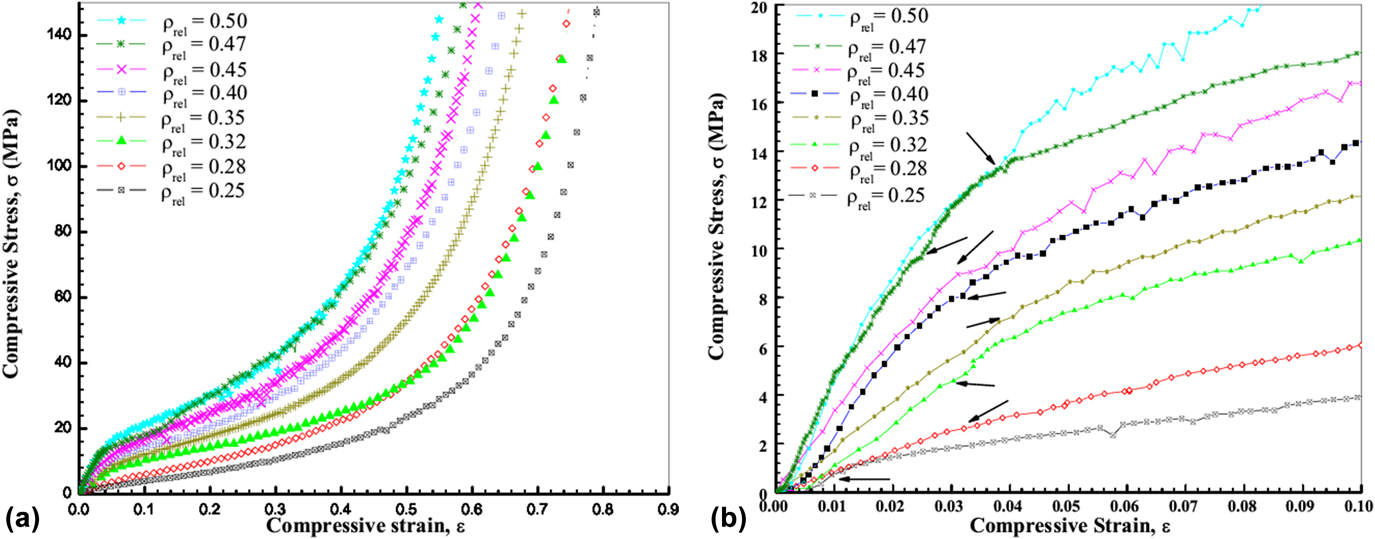
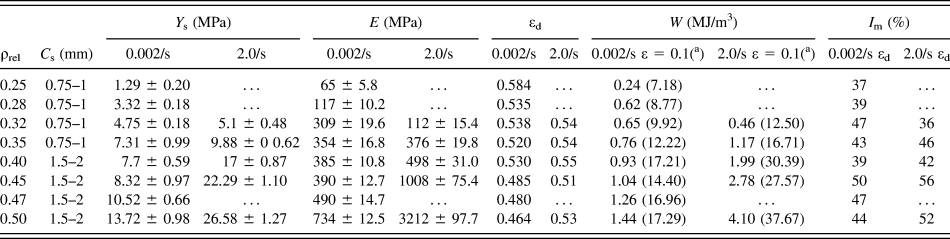
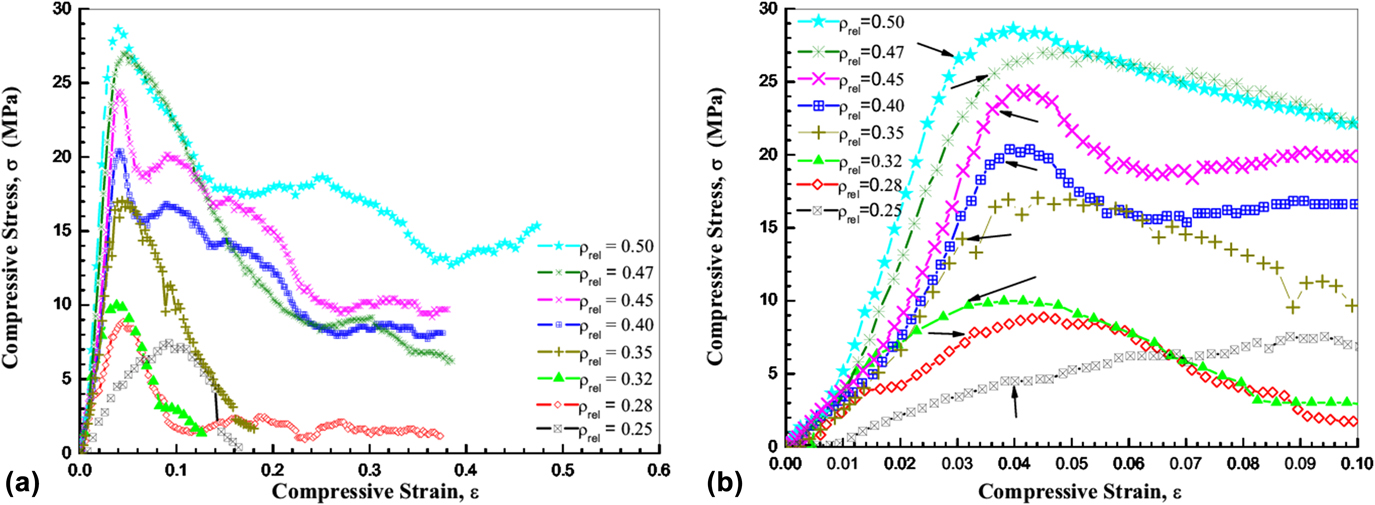
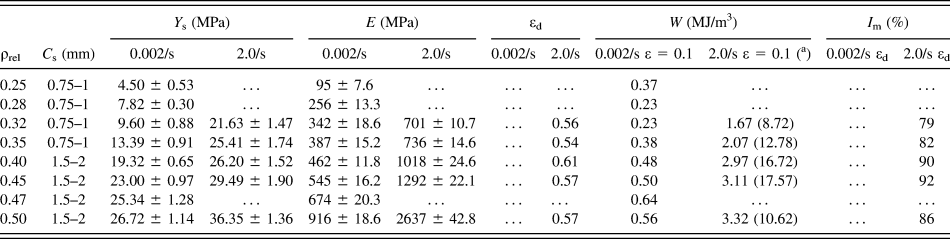
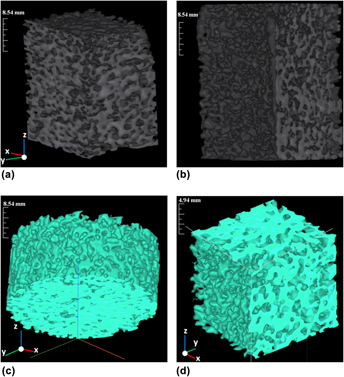
Figure 1 shows the CT-scan images of pure Al foams having ρrel of (a) 0.32 and (b) 0.35 and those of 7075-T6 alloy foams with ρrel of (c) 0.32 and (d) 0.35, respectively. As can be observed, all the foam samples have homogeneous distribution of interconnected open-cells. Typical C s of 0.75–1.0 mm can be observed in both sets of samples. Figure 2(a) presents the stress–strain curves of pure Al foams having ρrel = 0.25, 0.28, 0.32, 0.35, 0.40, 0.45, 0.47, and 0.50 compressed at έ = 0.002 s−1 (quasi-static), and Fig. 2(b) shows the zoom-in view of the elastic region of the curves. Figure 3(a) shows the stress–strain curves of pure Al foams having ρrel = 0.32, 0.35, 0.40, 0.45, and 0.50 compressed at έ = 2.0 s−1 (static loading), while Fig. 3(b) depicts the zoom-in view of the elastic region of the curves. As reported elsewhere,Reference Paul and Ramamurty7,Reference Ruan, Lu, Chen and Siores30,Reference Cady, Gray, Liu, Lovato and Mukai31 the deformation process initiates in a single band at the weakest portion of the foam, mostly at the contacts with the loading surface and proceeds one layer after the other. In most of the samples in the present work, it was found that the first deformation band (DB) (formed by contributions of multiple mechanisms of bending, shearing, and crushing) appeared mostly at the top layer of the samples touching the upper plate of the universal testing machine. This ensures that the foams developed by the present process have nearly homogeneous cell/density distribution throughout the foam matrix. The compressive response of the pure Al foams shows a typical deformation process that can be classified into three regions, viz, linear-elastic, plateau, and densification regions. In the linear-elastic region where the stress increases rapidly with a small increase of compressive strain, cells of the top layers progressively experience compression. A significant fall in the slope of the stress–strain curve is usually observed after the initial collapse (onset of the plateau region). With further increase in the strain, weak layers of the undeformed region collapse in a layer-wise manner through the propagation of the DB. The above deformation process repeats till εd is achieved in the foam where majority of the cell walls come into self-contact (onset of the densification region), followed by a small increase in strain and the rapid rise of the corresponding stress. The nonserrated stress–strain curves also confirm that the pure Al foams possess nearly uniform distribution of pores, strut thickness, and ρrel. The typical values of Y s observed in the MFs having different ρrel (compressed at έ = 0.002 and 2.0 s−1) are summarized in Table I. It can be noticed that the Y s of the MFs shows a monotonically increasing trend with ρrel. With the increase in ρrel, the moment of inertia to deform/bend the struts both in the elastic and plastic regions increases, which leads to the enhancement of the compressive properties (Y s and E) of the MFs.Reference Bafti and Habibolahzadeh10 In all the samples, the tangential modulus (E pl) in the plateau region (starting point of the plastic region till the onset of the densification region) is much smaller than in the elastic region. As can be observed in Fig. 2(a), σpl increased with increasing ρrel while an opposite trend was observed for εd (Table I). In addition, the developed foams exhibited έ sensitivity. The typical Y s values (Table I) estimated from the plots in Fig. 2(a) for ρrel = 0.32, 0.35, 0.40, 0.45, and 0.50 are 4.75 MPa, 7.31 MPa, 7.7 MPa, 8.32 MPa, and 13.72 Mpa, respectively, when compressed at έ = 0.002 s−1. The corresponding Y s values of the same set of samples when compressed at έ = 2.0 s−1 [as estimated from the plots in Fig. 3(a)] are 5.1 MPa, 9.88 MPa, 17 MPa, 22.29 MPa, and 26.58 MPa, respectively. With the increase in έ by 1000 times, the strength of the foams doubled in the samples with higher ρrel, viz, 0.40, 0.45, and 0.50. However, the enhancement was marginally low for ρrel = 0.32 and 0.35. Since the surface skin of the samples are very thin (open-cell structure), hence the skin contribution does not seem to have major contribution in enhancing the Y s and other mechanical properties.Reference Youn and Kang32,Reference Peroni, Solomos and Pizzinato33 The έ sensitivity of the mechanical properties of MFs are attributed to the έ sensitivity of the parent material, micro-inertial effect, compression and flow of gas in the cells, shape, and size of the cells, and microstructural properties (e.g., defects), which may cause different deformation modes of the material at different έ.Reference Wang, Shen, Lu and Zhao27,Reference Calladine and English34–Reference Campana and Pilone39 The present samples have open-cell morphology; therefore, the influence of air/gas on the mechanical properties can be ruled out (there is no chance of entrapped gas in the foams). As mentioned before, the foams have nearly homogenous C s distributions and show nonserrated stress–strain curves. Therefore, the contributions from the defects affecting the mechanical properties are not so prominent. According to the micro-inertial hardening theory proposed by Klintworth and Stronge,Reference Klintworth and Stronge40 at low έ, micro-inertia has a nominal effect, and the dominating mode of deformation is the buckling of struts.Reference Paul and Ramamurty7 When MFs are subjected to low έ, the cells get longer time to respond to the applied load (in achieving equilibrium) by releasing the stress through crushing/bending of cells and hence can transmit the impact stress properly after the deformation of the cells. In the case of compression under high έ, the inertia of the struts opposes the buckling process and forces it to occur at a delayed time. Therefore, the threshold buckling force is higher than the quasi-static compression, resulting in enhanced buckle loads at high έ.Reference Calladine and English34 The observed έ effect is much prominent in the high ρrel samples. The Y s values increased significantly at έ = 2.0 s−1 compared to έ = 0.002 s−1 (Table I). Although such a phenomenal increase in Y s does not look plausible, repeated experiments confirmed the same type of behavior with minute variation in strength. Apart from ρrel and έ sensitivity of the specimen, the strut thickness can also be a decisive factor in enhancing the Y s values. In the developed MFs, the strut thickness was controlled by scheming the size of the salt beads used as preforms and the infiltration pressure. The samples with ρrel > 0.35 were formed with salt beads of 1.5–2 mm size while the rest were formed with 0.75–1 mm size beads. No such dominating effect of salt bead size (or C s) or strut thickness on Y s was observed for έ = 0.002 s−1 with increasing ρrel. However, for έ = 2.0 s−1, a prominent increase in Y s values were observed only for larger C s (1.5–2 mm, ρrel > 0.35) and not in the samples with smaller C s (0.75–1 mm, ρrel < 0.40). It is to be noted that έ = 2.0 s−1 is a static rate rather than the dynamic rate where the micro-inertial effects dominate. Therefore, it can be concluded that C s and strut thickness are influencing the strength of the foam samples and also contributing toward their έ sensitivity.
CT-scan images of pure Al foams having ρrel values of (a) 0.32 and (b) 0.35, and 7075-T6 alloy foams with ρrel values of (c) 0.32, and (d) 0.35, respectively.

(a) Stress–strain curves of pure Al foams of ρrel = 0.25, 0.28, 0.32, 0.35, 0.40, 0.45, 0.47, and 0.50 compressed at έ = 0.002 s−1 and (b) the zoom-in view of the elastic region of the curves.

(a) Stress–strain curves of pure Al foams having ρrel = 0.32, 0.35, 0.40, 0.45, and 0.50 compressed at έ = 2.0 s−1 and (b) the zoom-in view of the elastic region of the curves.

Mechanical properties of pure Al foams derived at two different strain rates (έ = 0.002/s and 2.0/s).

a The bracketed terms denote the values at εd.
The values after the ± sign represent the standard deviation.
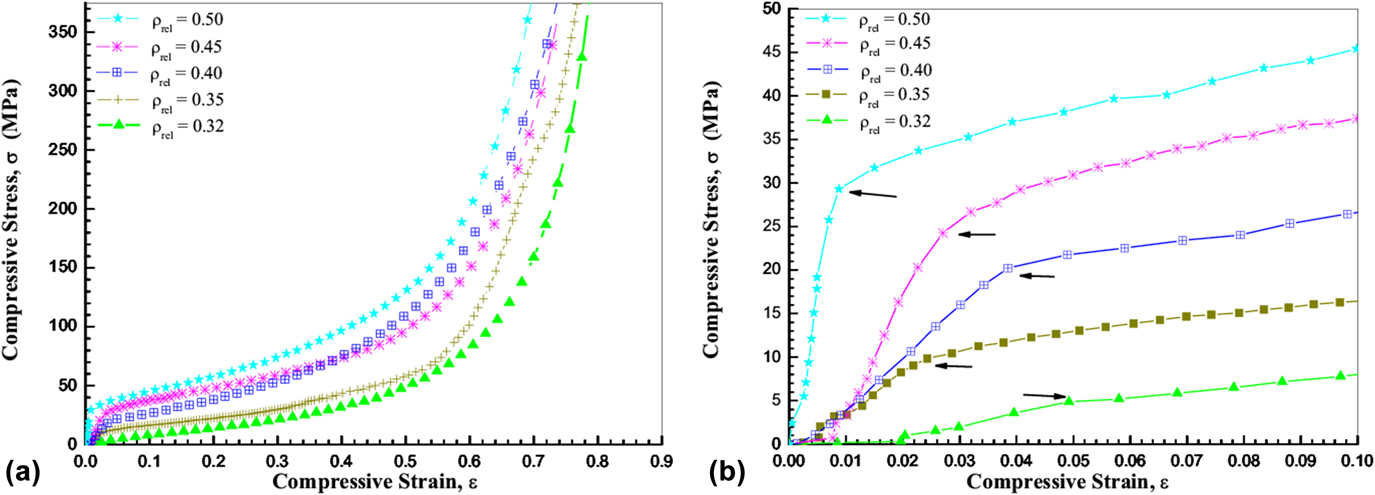
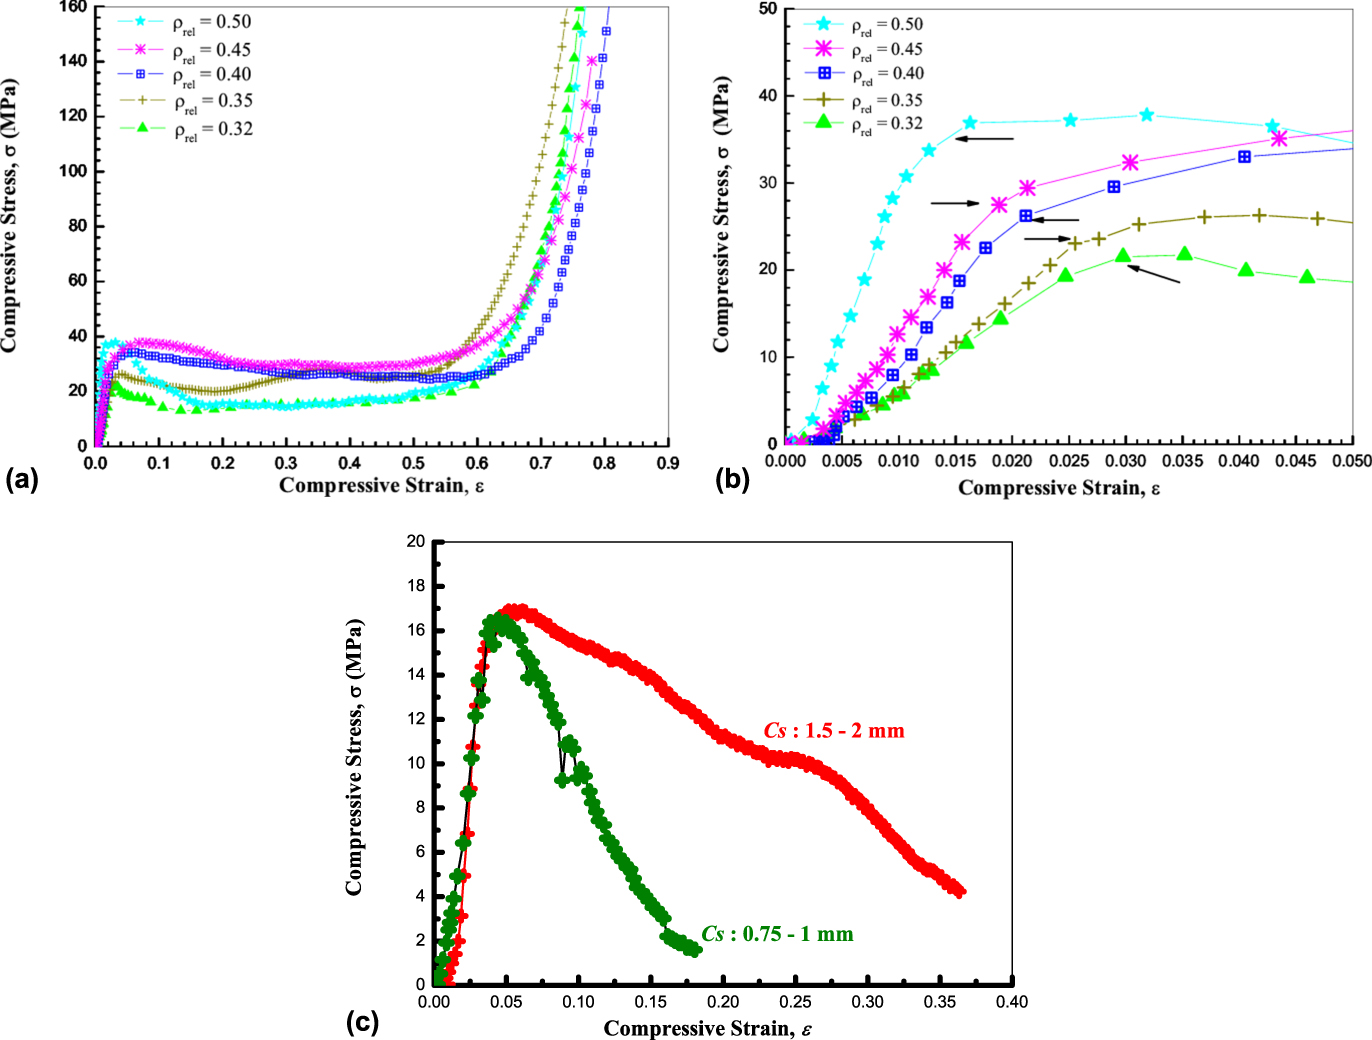
Figure 4(a) shows the compressive stress–strain curves of 7075-T6 alloy foams having ρrel = 0.25, 0.28, 0.32, 0.35, 0.40, 0.45, 0.47, and 0.50, when compressed at a quasi-static loading rate of 0.002 s−1. The zoom-in view of the elastic region of the curves is shown in Fig. 4(b). As can be noticed, the alloy foams exhibited quite different stress–strain curves, compared to the curves of pure Al in Fig. 2(a) for the same έ. The samples under deformation showed elastic and plateau region but not the densification region as the samples could not withstand the load till the densification of the foams. The curves are jagged in nature with continuous ups and downs and possessed very small plateau region. The foams revealed their brittle nature with the fracture initiated soon after reaching the maximum strength, i.e., Y s. Cracks were generated in the samples when compressed beyond Y s and gradually the solid content started falling out of the boundary (in parts) indicating the local brittle fracture. By contrast, the foams showed complete universal compressive characteristics when subjected to a έ of 2.0 s−1. Figure 5(a) shows the stress–strain curves of 7075-T6 alloy foams having ρrel = 0.32, 0.35, 0.40, 0.45, and 0.50 when compressed at έ = 2.0 s−1 (static loading), and Fig. 5(b) presents the zoom-in view of the elastic region of the curves. The possible reasons behind such a wide variation in deformation behavior for two different έ could be the microstructural features of the struts and the phenomenon by which the DB progressed throughout the sample. As mentioned earlier, at quasi-static έ, the cells get enough time to respond to the applied load and the stress is released by means of fracture in the cells. However, at static and dynamic processes, due to fast compression, the propagation of DB to the next layers takes place with partial rupturing of the cells. This is reflected in the stress–strain curves as a flat plateau region [Fig. 5(a)]. The typical Y s values observed in the alloy foams of ρrel = 0.32, 0.35, 0.40, 0.45, and 0.50 are 9.60 MPa, 13.39 MPa, 19.32 MPa, 23.00 MPa, and 26.72 MPa when compressed at έ = 0.002 s−1. The values increased to 21.63 MPa, 25.41 MPa, 26.20 MPa, 29.49 MPa, and 36.35 MPa in the corresponding samples when compressed at έ = 2.0 s−1 (Table II). Similar to the pure Al foams, a monotonic increasing trend of Y s with increasing ρrel was observed. It is quite rational that the strength of the foams would improve with the increase in ρrel due to the increased moment of inertia to bend the struts. Among the pure Al and 7075-T6 foams of almost similar ρrel and processed under same experimental conditions, the later yielded higher Y s at both strain rates (0.002 and 2.0 s−1). This can be attributed to the properties of the parent materials. The bulk 7075-T6 alloy has higher strength than pure Al. It is also apparent that the two set of samples have some difference in the microstructure of the struts (e.g., grain size, defects, etc.).
(a) Stress–strain curves of 7075-T6 alloy foams having ρrel = 0.25, 0.28, 0.32, 0.35, 0.40, 0.45, 0.47, and 0.50 compressed at έ = 0.002 s−1 and (b) the zoom-in view of the elastic region of the curves.

(a) Stress–strain curves of 7075-T6 alloy foams having ρrel = 0.32, 0.35, 0.40, 0.45, and 0.50 and compressed at έ = 2.0 s−1 and (b) the zoom-in view of the elastic region of the curves. (c) Stress–strain curves of 7075-T6 alloy foams having ρrel = 0.35 for two different C s values when compressed at έ = 0.002 s−1.

Mechanical properties of 7075-T6 alloy foams derived at two different strain rates (έ = 0.002/s and 2.0/s).

a The bracketed terms denote the values at εd.
The values after the ± sign represent the standard deviation.
As can be noticed in Table II, the simultaneous increase in both the C s (0.75–1.0 to 1.5–2.0 mm) and ρrel (<0.35 to >0.40) result in significant rise in the strength values during quasi-static loading, while no such inference can be made for static loading. Apart from sample dimension and ρrel of the foams, the dimension of the cells and strut thickness also play crucial roles in determining the overall mechanical properties of the foams. Reports on the effects of C s on the mechanical properties of foams reveal a complex behavior.Reference Kanahashi, Mukai, Nieh, Aizawa and Higashi2,Reference Nieh, Higashi and Wadsworth4,Reference Cao, Wang, Ma, Zhao and Yang8,Reference Jiang, Wang and Zhao38 In the present work, foams with ρrel > 0.35 were formed using salt particles of size 1.5–2 mm, while the rest were fabricated with particles of 0.75–1 mm size (Table II). To investigate the effects of C s on the strength of the foams, compressive tests at quasi-stating loading (έ = 0.002 s−1) were conducted on few sets of samples of same ρrel but different C s values (0.75–1.0 and 1.5–2.0 mm). Figure 5(c) shows the stress–strain curves of 7075-T6 alloy foams having ρrel = 0.35 for two different C s values when compressed at έ = 0.002 s−1. The sample with larger C s showed higher Y s with slight deviation in E. It suggests that at quasi-static έ, the strength of the 7075-T6 foams is enhanced with the increase in C s (larger the C s, higher is the strength). With the simultaneous increase of both C s (0.75–1 to 1.5–2 mm) and ρrel (<0.35 to >0.40) at quasi-static έ, a large rise in the strength substantiated that C s plays a vital role (along with ρrel) in controlling the strength of the foams. The observed Y s values at έ = 2.0 s−1 are much higher compared to the values observed at έ = 0.002 s−1. This indicates that the strength of the foams is sensitive to έ. However, the percentage increase in the Y s values between the quasi-static and static έ for ρrel = 0.32 is 125%, which became as low as 28% with the increase in ρrel up to 0.45. This points out that under static έ and with simultaneous increase of ρrel and C s, the rate of enhancement in Y s decreases. At έ = 2.0 s−1, there is a monotonous increase in the strength of the foams with increasing ρrel and samples seem to be sensitive to the έ. With smaller C s, the sample is more sensitive to έ while larger C s proves to be detrimental for Y s with increasing ρrel at static έ. The percentage increase in Y s between έ = 0.002 s−1 and έ = 2.0 s−1 with ρrel = 0.32, 0.35, 0.40, 0.45, and 0.50 is approximately 125, 123, 36, 28, and 36%, i.e., the change decreased with increasing ρrel. However, as mentioned in Table II, the samples with ρrel = 0.32 and 0.35 were composed of C s = 0.75–1 mm and the samples with ρrel = 0.40, 0.45, and 0.50 had C s = 1.5–2 mm, i.e., for smaller C s, the samples are more sensitive to έ.
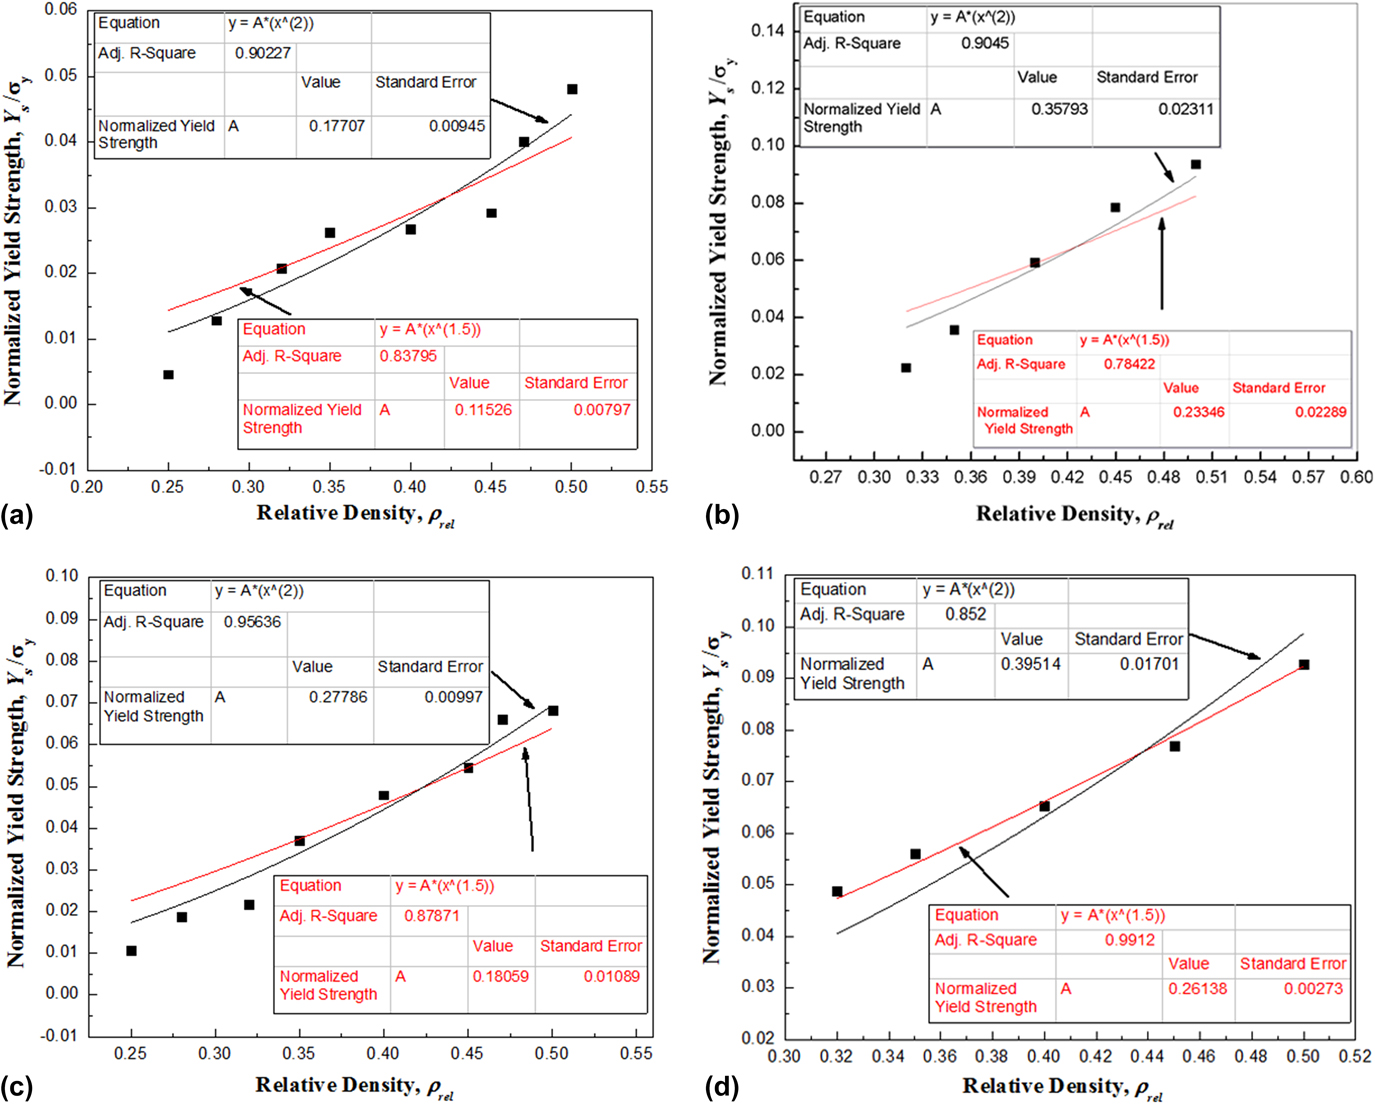
Figure 6 shows the normalized compressive Y s versus ρrel plots of pure Al at (a) έ = 0.002 s−1 and (b) έ = 2.0 s−1, and 7075-T6 foams at (c) έ = 0.002 s−1 and (d) έ = 2.0 s−1, respectively. For open-cell foams, the scaling law for normalized Y s can be taken as,Reference Ashby, Evans, Fleck, Gibson, Hutchinson and Wadley11,Reference Gibson and Ashby22
 $${{{Y_{\rm{s}}}} \over {{\sigma _{\rm{y}}}}} = C{\left( {{\rho _{{\rm{rel}}}}} \right)^{1.5}}\quad ,$$
where C is a parameter related to the topology of the foam and varies between 0.1 and 1, and σy is estimated from the microhardness data (∼HV/3).Reference Bafti and Habibolahzadeh10,Reference Ashby, Evans, Fleck, Gibson, Hutchinson and Wadley11,Reference Murr, Amato, Li, Tian, Cheng, Gaytan, Martineza, Shindo, Medina and Wicker25,Reference Mahmutyazicioglu, Albayrak, Ipekoglu and Altintas26 The average HV values for pure Al and 7075-T6 alloy foams were obtained as 85, 79, 70, 85, 88, 87, 80, and 87 and 129, 127, 132, 135, 139, 123, 117, and 120 for ρrel = 0.25, 0.28, 0.32, 0.35, 0.40, 0.45, 0.47, and 0.50, respectively. Although the scaling law for open-cell foams indicates that the normalized Y s is proportional to (ρrel)1.5, a better fitting of the experimental data was obtained with (ρrel)2 except for the 7075-T6 Al alloy foams, when compressed at έ = 2.0 s−1 [Fig. 6(d)].
Normalized Y s − ρrel plots of Al foams compressed at (a) έ = 0.002 s−1 and (b) έ = 2.0 s−1, and 7075-T6 alloy foams compressed at (c) έ = 0.002 s−1 and (d) έ = 2.0 s−1, respectively.

Structural stiffness is another important property that defines the characteristics of MFs and helps in classifying them for different applications. The E value defines the extent up to which any material can resist deformation on application of external load. As mentioned before, the E of the foams depend on ρrel, pore geometry, and cell topology. The structural flaw induced stress concentrations in the foams may lead to a slight plastic bending at a very low stress level. Consequently, the E value obtained from the loading stress–strain curve may not be the real representation of the stiffness. By contrast, the unloading slope remains roughly constant unless the foam was loaded up to its plastic collapse stress.Reference Wang and Zhou41 Hence, stiffness values are generally preferred from the unloading data. However, in the literature, many authors reported E values derived from the loading data to understand the compressive properties of the foams. Song et al.Reference Song, Chen, Yanagita and Frew42 and Wouterson et al.Reference Wouterson, Boey, Hu and Wong43 reported E values estimated from the initial portions of the loading data. Esen and BorReference Esen and Bor44 calculated E from curve fitting the linear elastic region of the stress–strain curves prior to the onset of the elastic–plastic region. Saha et al.Reference Saha, Kabir and Jeelani45 and Michailidis et al.Reference Michailidis, Stergioudi and Tsouknidas46 were also measured E from the slope of the initial linear part of the stress–strain curve. Chang et al.Reference Chang, Huang, Yang, Kuo and Lee47 defined E as the slope of the linear region of the stress–strain curve in the 5–15% of the strain range. Recently, Koohbor et al.Reference Koohbor, Mallon, Kidane and Lu48 also reported the same method of deriving the effective E by best line fitting of the stress–strain plots prior to the elastic limits. In the present work, we also reported the E values estimated from the loading curve. In MFs, some imperfections, such as cell edge curvature, materials concentrated at cell nodes rather than cell edges, corrugations and curvature of cell walls, and nonuniform ρ*, contribute significantly in degrading the stiffness values.
It was also observed that E follows an increasing trend with the decrease in Ø, similar to Y s for both the samples. The moment of inertia to bend/deform the struts both in elastic and plastic regions increases with ρrel, which lead to the enhancement of the compressive properties (Y s and E) of the MFs. The typical values of E of the pure Al foams when compressed at έ = 0.002 s−1 are 65 MPa, 117 MPa, 309 MPa, 354 MPa, 385 MPa, 390 MPa, 490 MPa, 734 MPa for ρrel = 0.25, 0.28, 0.32, 0.35, 0.40, 0.45, 0.47, and 0.50, respectively. The trend of E under static compression (έ = 2.0 s−1) was also found to be similar to the quasi-static compression but the magnitude of E enhanced significantly with the increase in ρrel. The mass distribution in the foam matrix also plays a vital role in controlling the strength and stiffness of the foams.Reference Simone and Gibson35 As described earlier, the present foams possess uniformity in the pore and density distribution. Therefore, we conclude that the stiffness will not be affected by the morphology of the present foams. The typical E values of the foams at έ = 2.0 s−1 are 112 MPa, 376 MPa, 498 MPa, 1008 MPa, and 3212 MPa for ρrel = 0.32, 0.35, 0.40, 0.45, and 0.50, respectively. The changes are higher as compared with quasi-static compression. It is expected that the έ sensitivity of E and Y s should quantitatively behave in a similar manner. However, in the present set of samples, it can be noticed that E is more sensitive to έ. The possible reason could be the microplasticity in the samples.Reference Zhou, Shrotriya and Soboyejo49 In general, when the foam is compressed at high έ, the inertia of the struts opposes the buckling process, which causes the rupturing or deformation of the cells at a delayed time. As a result, a rise in E is observed with ρrel. Some areas/domains in the MFs may possess plastic property or microdefects (impurity phase, cracks) trapped in the struts which under compression releases the localized stress (in the elastic region), resulting in the reduction of strength. Since the effect of local microplasticity in ductile metals is observed well before the onset of bulk yielding, the onset of local microplasticity may not lead to significant shape changes in the individual struts and the foam block, but their presence may lower down the Y s.Reference Zhou, Shrotriya and Soboyejo49
Similar behavior of E was observed in the 7075-T6 alloy foams. The E values observed at έ = 0.002 s−1 for ρrel = 0.25, 0.28, 0.32, 0.35, 0.40, 0.45, 0.47, and 0.50 are 95 MPa, 256 MPa, 342 MPa, 387 MPa, 462 MPa, 545 MPa, 674 MPa, and 916 MPa, respectively. With the increase in έ by 1000 times (έ = 2.0 s−1), the E values were enhanced by 105%, 90%, 120%, 137%, and 188% (701 MPa, 736 MPa, 1018 MPa, 1292 MPa, and 2637 MPa) for ρrel = 0.32, 0.35, 0.40, 0.45, and 0.50, respectively. In the present study on pure Al and 7075-T6 alloy foams, dissimilar trends of E with έ are observed, even though the processing parameters and cell parameters are similar. Therefore, it can be concluded that the mechanical properties of the MFs also depend on the parent material, apart from the ρrel, cell morphology, and έ. A large variation in the C s as well as a large population of morphological defects are common features of cellular metals/alloys and hence a significant variation in the foam properties can also be expected.Reference Paul and Ramamurty50 However, in the present work, the foams possess a very narrow C s distribution and hence we conclude that the observed behavior of the foams describes their inherent response to the applied load (and έ).
The σpl and εd primarily depend on ρrel, foam microstructure, and the applied έ. Raj et al.Reference Raj, Parameswaran and Daniel51 reported σpl of Al foams to increase with the increase in both ρrel and έ. Wang et al.Reference Wang, Shen, Lu and Zhao27 also observed σpl to increase from low to medium έ for closed-cell Al alloy foams. However, in Alulight and Duocell foams, the σpl is almost insensitive to έ (up to 5000 s−1).Reference Campana and Pilone39 In the present work, the σpl values of the pure Al foams obtained from energy absorption efficiency-based approach [Eq. (1)] at έ = 0.002 s−1 are 12 MPa, 18 MPa, 19 MPa, 26 MPa, 32 MPa, 34 MPa, 39 MPa, and 40 MPa for ρrel = 0.25, 0.28, 0.32, 0.35, 0.40, 0.45, 0.47, and 0.50, respectively. The σpl values at έ = 2.0 s−1 are 24 MPa, 32 MPa, 56 MPa, 59 MPa, and 77 MPa corresponding to ρrel = 0.32, 0.35, 0.40, 0.45, and 0.50. To study the έ sensitivity of σpl, we have adopted the reported criterion of 20% increase in the value.Reference Wang, Shen, Lu and Zhao27 With the increase in έ by 1000 times, σpl nearly doubled the values as compared with έ = 0.002 s−1 for ρrel = 0.50. Wang et al.Reference Wang, Shen, Lu and Zhao27 reported a similar kind of increase in σpl values for ρrel = 0.09 when έ was increased by 5 orders of magnitude. The samples with lower ρrel, viz, 0.32, 0.35, 0.40, and 0.45 showed an enhancement in σpl of 24.19%, 37.23%, 77.21%, and 76.82%, respectively. The possible reason for such high rise could be the large strut thickness which requires higher deformation load. With the increase in έ, the plastic deformation is often confined to the initial cell layer where impact occurs. Mondal et al.Reference Mondal, Goyal and Das52 reported that σpl highly depends on ρrel and not on the έ for very light Al foams. Since the present foams possess larger strut thickness, the inertial effect at high έ along with ρrel shall contribute toward the enhancement of σpl. An increasing pattern of σpl with ρrel was also observed in the 7075-T6 alloy foams (although the increment is much smaller than the pure Al foams). The typical σpl values at έ = 2.0 s−1 are 15.79 Mpa, 24.44 Mpa, 28 Mpa, 31.55 Mpa, and 19.23 Mpa for ρrel = 0.32, 0.35, 0.40, 0.45, and 0.50, respectively.
Similarly, the εd is also a vital parameter to characterize the mechanical properties of foams and is mainly influenced by the έ, morphology, and strut microstructure of the foams.Reference Wang, Shen, Lu and Zhao27,Reference Schüler, Fischer, Bührig-Polaczek and Fleck28 As can be observed in Figs. 2(a), 3(a), and 5(a), both Al and 7075-T6 alloy foams hardly exhibit any abrupt switching between different deformation regions and hence an accurate identification of εd is difficult. As mentioned before, we have followed an energy efficiency-based approach to identify the most accurate marking of the onset of the densification mechanism in the present samples. The obtained values of εd are given in Tables I and II for pure Al and 7075-T6 alloy foams, respectively. The εd values of the pure Al foams at έ = 0.002 s−1 decreased with the increase in ρrel, as expected due to the increase in solid content in the foam. The typical values of εd are 0.584, 0.535, 0.538, 0.52, 0.53, 0.485, 0.48, and 0.464 corresponding to ρrel = 0.25, 0.28, 0.32, 0.35, 0.40, 0.45, 0.47, and 0.50, respectively. It can also be observed that with the increase in έ, the decreasing trend of εd is not so prominent and no dependency of εd on the C s for both the έ is revealed. For έ = 2.0 s−1, the typical values of εd are 0.54, 0.54, 0.55, 0.51, and 0.53 corresponding to ρrel = 0.32, 0.35, 0.40, 0.45, and 0.50, respectively. The εd decreased nearly by an amount of 0.02 or more (∼2.5–8%) for most of the samples at quasi-static έ, whereas for static έ, both increase and decrease in εd were observed with increasing ρrel. The 7075-T6 alloy foams showed an opposite behavior. When compressed at έ = 0.002 s−1, the samples did not show the densification rather it collapsed soon after achieving the Y s at very low strain [Fig. 4(a)]. The foams with low ρrel (∼0.25–0.35) collapsed even before reaching ε = 0.3. For higher ρrel, the foams collapsed completely above ε = 0.4. It can also be observed that above the Y s value, there is a continuous decrease in the stress. It indicates the fracture of the cells taking place in the foams. By contrast, for έ = 2.0 s−1, full stress–strain curves were obtained. The maximum value of εd of 0.61 was obtained for ρrel = 0.40, while a minimum of 0.54 was obtained for ρrel = 0.35. No particular trend of the εd values with ρrel can be derived. Few reports are available in the literature highlighting the effects of ρrel and έ sensitivity on εd. Wang et al.Reference Wang, Shen, Lu and Zhao27 reported negligible dependence of εd on έ for Al foams with closed-cell morphology. Mondal et al.Reference Mondal, Goyal and Das52 showed that the εd of closed-cell Al-fly ash composite foams is almost invariant to both the ρrel and έ. Yi et al.Reference Yi, Zhu, Zu, Hu and Yi53 reported that the compaction strain for the Al alloy decreases with the increase in έ. Han et al.Reference Han, Cheng, Li and Wang37 mentioned that the εd decreases with έ in open-cell pure Al foams processed by infiltration method. Bafti et al.Reference Bafti and Habibolahzadeh10 reported that εd decreases with the increase in ρrel of Al foams produced by powder-carbamide spacer route. As can be noticed in the present set of pure Al and 7075-T6 foams, the εd did not reveal any particular trend with respect to ρrel at έ = 2.0 s−1.
In MFs, the applied compressive load is absorbed during the deformation process. In this regard, the W and I m are two important parameters of foams, defined as followsReference Kanahashi, Mukai, Nieh, Aizawa and Higashi2,Reference Paul and Ramamurty7 :
 $$W = \int_{\rm{0}}^{{\varepsilon _{\rm{m}}}} {\sigma \left( \varepsilon \right){\rm{d}}\varepsilon } \quad ,$$
 $${I_{\rm{m}}} = {1 \over {{\sigma _{\rm{m}}}{\varepsilon _{\rm{m}}}}}\int_{\rm{0}}^{{\varepsilon _{\rm{m}}}} {\sigma \left( \varepsilon \right){\rm{d}}\varepsilon } \quad ,$$
where σ(ε) is the compressive stress (function of ε), εm is the limit of plateau strain up to the onset of densification, and σm is the corresponding compressive stress. The W increases with ρrel (Y s and σpl also increase with ρrel) since the volume of the solid content in the foams increases and so do the area under the stress–strain curve. Larger area under the stress–strain curve reflects higher energy absorption. Therefore, for excellent absorption capacity of the foams, it is good to have large elastic region and also the deformation in the plateau region should progress with nearly constant or slowly increasing stress with strain. As shown in Table I, the values of W (for Al at έ = 0.002 s−1) in both the elastic and plateau regions increase with ρrel, with the maximum value of 17.29 MJ/m3 for Ø = 50%. To assess the effects of έ on the absorption energy of the foams with different ρrel, comparative studies were performed between samples with same ρrel and foam morphology. At higher έ, the energy absorption increased and depicted a higher rate of increase above ρrel = 0.35. The percentage increase in the energy absorption at higher έ for ρrel = 0.32, 0.35, 0.40, 0.45, and 0.50 are 26%, 37%, 76%, 91%, and 117%, respectively. The large C s in the foams plays a contributing role in this regard. The foams with ρrel > 0.35 have C s in the range 1.5–2 mm (Table I). As mentioned before, the C s also contributed positively to enhance the compressive properties at elevated έ, thereby increasing the area under the stress–strain curve. By contrast, I m at both the έ did not follow any specific trend and the sample with ρrel = 0.45 was found most efficient in terms of energy absorption till the εd. In addition, the observed I m values mostly show positive έ sensitivity.
The trend of W of 7075-T6 alloy foams was also found to be similar with those of pure Al foams. Since the foams fractured at small strain when compressed at quasi-static loading (έ = 0.002 s−1), the absorption energy in the elastic region (till ε = 0.1) is only considered for the analysis. As expected, the W values in the elastic region mostly increased with ρrel, excluding the ρrel = 0.50 sample. With the increase in the έ from 0.002 to 2.0 s−1, the observed change (%) in the W values in the elastic region were 626%, 444%, 518%, 498%, and 493% for ρrel = 0.32, 0.35, 0.40, 0.45, and 0.50, respectively. This reflects that the energy absorption is έ sensitive. The absorption efficiency at static compression also increased with ρrel and the foam with ρrel = 0.45 was found to be the most efficient with I m = 92%.
IV. CONCLUSIONS
MFs of pure Al and 7075-T6 alloys were developed following the pressurized salt infiltration casting process. X-ray CT scan imaging confirmed the interconnected open-cell morphology in the MFs. Compressive tests under quasi-static (έ = 0.002 s−1) and static (έ = 2.0 s−1) loading were performed on the foams. The results show a three-stage deformation process: linear elastic stage, plastic collapsing stage, and densification stage. With the increase in ρrel of the Al and 7075-T6 foams, both Y s and E increased monotonically at both έ.
The foams also showed έ sensitivity. At high ρrel, the έ effect was clearly evident in Al foams vis-à-vis the alloy foams where the έ effect was pronounced at low ρrel. The observed results suggest that the material composition is also playing a role in the έ sensitivity.
At quasi-static loading, the C s had negligible effect on the strength of the Al foams, whereas an increased C s enhanced the strength of the 7075-T6 alloy foams. The effect of C s was more pronounced at static loading for both Al and 7075-T6 alloy foams.
A monotonic increase in E with increasing ρrel was observed in all the MF samples irrespective of the parent material and έ. The E values of all the MF samples of both sets of materials were also found to be sensitive to έ.
The average HV values of both Al and 7075-T6 alloy foams do not show any apparent relationship with ρrel.
The σpl increased with ρrel in all the samples. In addition, the σpl of Al foams showed έ sensitivity.
The εd decreased with increasing ρrel under quasi-static loading in the case of pure Al, whereas the decreasing trend of εd was not so prominent under static loading and also did not depend on C s. In 7075-T6 alloy foams, under static loading, the εd did not show any particular trend with ρrel, while the sample collapsed before densification under quasi-static loading.
The sample with ρrel = 0.45 demonstrated to be the most efficient in terms of energy efficiency for both Al and 7075-T6 alloy foams.
In conclusion, the mechanical properties of MFs are controlled by several dominating parameters including ρrel, έ, parent material, and their processing route. Strut thickness and C s also contribute significantly but their effects may vary with έ and composition of the parent material.
ACKNOWLEDGMENT
This work has been financially supported by the Department of Science and Technology, Government of India (Project No. SR/FTP/PS-214/2011).