Introduction
The global loss of biodiversity, accelerated by anthropogenic disturbance and climate change (Pimm et al. Reference Pimm, Jenkins, Abell, Brooks, Gittleman and Joppa2014; Wang et al. Reference Wang, Li, Zhang, Luo and Li2025), underscores the critical need for effective conservation interventions. While habitat protection remains a cornerstone of species conservation (Genes and Dirzo Reference Genes and Dirzo2022; Calfayan et al. Reference Calfayan, Cavia, Fraschina, Guidobono, Gorosito and Busch2024; Zimin et al. Reference Zimin, Zimin, Grismer, Bauer, Chapple and Dembitzer2025; Liu et al. Reference Liu, Zhang, Ameca, Wang, Cai and Long2026), the scarcity of ecological data for many rare species impedes the development of evidence-based conservation strategies. Consequently, understanding patterns of habitat use is not merely beneficial but essential for designing and implementing successful conservation measures for threatened species (Jones Reference Jones2001; Zhang Reference Zhang2005; Devries et al. Reference Devries, Clark and Armstrong2018; McGarigal et al. Reference McGarigal, Wan, Zeller, Timm and Cushman2016; Sabrate et al. Reference Sabrate, Hanane, Bouaamama and Ichen2025).
Habitat use is fundamentally shaped by key environmental factors, including microclimate, vegetation structure, and human disturbance, which collectively establish the physical template for habitat selection (Jones Reference Jones2001; Proudman and Allen Reference Proudman and Allen2025; Fernández-Cabello et al. Reference Fernández-Cabello, Franch, Vilella, Fernandez-Arrieta, Rota and Sanglas2024; Tsunoda et al. Reference Tsunoda, Hisano, Enomoto and Saito2026; Bei et al. Reference Bei, Lai, Bai, Bin, Qin and Chen2025). Within these constraints, habitat utilisation represents a behavioural optimisation process centered on trade-offs between safety, thermoregulation, and foraging opportunities (Korhonen Reference Korhonen1980; Lu and Zheng Reference Lu and Zheng2002). For instance, most pheasants optimise this trade-off by balancing concealment against access to food resources (Chalfoun and Schmidt Reference Chalfoun and Schmidt2012). This challenge is particularly pronounced during winter, when survival requires a precise balance between acquiring sufficient food and minimising exposure to predators (Fan et al. Reference Fan, Bu, McShea, Shen, Li and Li2020; Kauth et al. Reference Kauth, Gregory, Kauth, Harsh, Runia and Lonsinger2022; Martin et al. Reference Martin, Norris, Porto and Sherratt2026).
The montane pheasants present a compelling case study of a winter survival bottleneck, as freezing temperatures and persistent snow cover reduce food availability and increase predation pressure (Cong et al. Reference Cong and Zheng2008; Bei et al. Reference Bei, Lai, Bai, Bin, Qin and Chen2025; Ye et al. Reference Ye, Chen, He, Fu and Liao2026; Zhao et al. Reference Zhao, Ye, Chen, Cao, Tian and Wu2026). Therefore, understanding the behavioural mechanisms and decision-making processes underlying winter habitat use is an essential research objective. This knowledge provides the foundation for developing reliable, spatially explicit models aimed at informing effective conservation interventions and population management strategies.
The Temminck’s Tragopan Tragopan temminckii, a sexually dimorphic pheasant endemic to China’s montane forests, is listed as Least Concern (IUCN 2025) due to habitat loss, fragmentation, and hunting pressure, and receives national protection (China Biodiversity Red List). It inhabits dense, moist temperate forests with well-developed understories at elevations of 1,800–3,900 m (Cong et al. Reference Cong and Zheng2008; Zheng and Zhang Reference Zheng, Zhang, Zheng and Zhang2009). Despite existing studies on its activity rhythms (Feng et al. Reference Feng, Hu, Shi, Wang, Qu and Jin2021; Zhao et al. Reference Zhao, Chen, Yan, Liu, Liu and Li2021), niche characteristics (Wang et al. Reference Wang, Zhu, Xu, Yang, Zhao and Dou2022a), flocking behaviour (Cui and Deng Reference Cui and Deng2013), roosting and foraging habitats (Cong et al. Reference Cong and Zheng2008; Cui et al. Reference Cui, Kang and Deng2008; Zhao et al. Reference Zhao, Ye, Chen, Cao, Tian and Wu2026), and breeding ecology (Li Reference Li1987), a systematic understanding of its winter microhabitat requirements remains limited. This study examines winter (December–February) microhabitat use by this species in the Laojunshan National Nature Reserve, Sichuan, China. Specifically, our aims were to (1) identify the key environmental variables shaping winter microhabitat use by comparing microhabitat characteristics between used and random control plots and (2) analyse habitat preferences and their potential underlying drivers. The results will support targeted conservation strategies and contribute to the broader theoretical framework for microhabitat protection in ground-dwelling pheasants (Zhou et al. Reference Zhou, Zhao, Connelly, Li and Xu2017).
Methods
Study area
From December 2024 to February 2025, fieldwork was conducted within the Laojunshan Nature Reserve (approximately 35 km²), located in the Xiaoliang Mountains of Sichuan Province, China (28°45′N, 103°56′E). Elevation within the study area ranges from 1,000 to 2,010 m. The climate is humid, with an annual mean temperature ranging from 12.0–14.7°C. July is the hottest month, with mean temperatures of 24.0–27.4 °C, while January is the coldest, with mean temperatures of 4.9–8.4 °C, and an extreme minimum of -10 °C. Annual precipitation is approximately 1,500 mm. During winter (December-February), total precipitation accounts for 1-7% of the annual total, with occasional snowfall at higher elevations. The evergreen broadleaf forest is dominated by tree species such as Castanopsis delavayi, C. omeiensis, Davidia involucrata, and Cyclobalanopsis myrsinifolia. The understorey is well developed, with a shrub layer composed primarily of Eurya loquiana, Alangium chinense, Rhododendron hunnewellianum, and Camellia oleifera, as well as dense thickets of the bamboo Chimonobambusa quadrangularis.
Fieldwork
We implemented a systematic, transect-based methodology to investigate winter habitat use by Tragopan temminckii. A network of 28 permanent transects (1–3 km in length) was established across the reserve and strategically distributed to encompass the full range of topographic gradients (Figure 1). Each transect was surveyed once per month, resulting in a total of three surveys. All surveys were conducted under sunny and no wind conditions, by the same team of observers, at a constant walking speed to standardise sampling effort. All direct sightings or auditory detections of tragopans, together with fresh indirect signs (e.g. feathers, droppings, and foraging traces) detected within 100 m on either side of a transect line, were recorded and georeferenced. Auditory cues were followed by a cautious approach to visually confirm the location of the individual.
Location of the study area and distribution of transects for surveying Temminck’s Tragopan T. temminckii microhabitat use in Laojunshan Nature Reserve, Sichuan Province, China.

Figure 1. Long description
The left panel shows a map of China with Sichuan Province highlighted in orange. A black box over Sichuan expands via diagonal lines to the right panel.
The right panel is a topographic map of Laojunshan Nature Reserve. The top X-axis shows longitude from 103 degrees 58 minutes East to 104 degrees 4 minutes East. The right Y-axis shows latitude from 28 degrees 39 minutes North to 28 degrees 44 minutes North.
A legend at the bottom left indicates that blue lines represent Transect lines. An elevation scale bar shows a gradient from green (800 meters) to dark red (2008.7 meters). The highest elevations (red) form a central ridge running West to East, while lower elevations (green) are located at the northern and southern perimeters.
Twenty-eight numbered transects are distributed across the reserve.
* In the Northwest, transects 14, 15, 18, and 21 are located in high-to-mid elevation zones.
* In the West and Southwest, transects 20, 22, 23, and 24 follow river valleys.
* Along the central high-elevation ridge, transects 2, 3, 13, 16, 25, and 27 are positioned.
* In the East and Southeast, transects 1, 4, 5, 6, 7, 8, 9, 10, 11, 12, 17, 19, 26, and 28 are clustered, mostly following the drainage patterns toward lower elevations.
A scale bar at the bottom right indicates a distance of 0 to 4 kilometers.
When an individual or fresh indirect sign was detected in the transects, we established a 10 m × 10 m used quadrat centered at the exact location of occurrence for detailed habitat characterisation. Measurements within each plot encompassed three categories of variables: topography (elevation, slope, and aspect), vegetation structure (height, diameter at breast height, and canopy cover of trees, shrubs, and herbs, as well as litter cover), and distance to key landscape features (nearest stream, vehicle-accessible road, and forest edge, defined as the ecotone between closed-canopy forest and open habitat). To quantify fine-scale understorey conditions, bamboo height and cover were measured using five 1 m × 1 m subquadrats (four at the plot corners and one at the center). For comparison, considering spatial autocorrelation while maintaining habitat consistency, we established a paired control plot 100 m away in a randomly selected direction within the same elevation band. Control plots were also 10 m × 10 m, with five 1 m × 1 m subquadrats measured identically, and contained no T. temminckii individuals or signs of their activity. A similar distance has been adopted in previous galliform microhabitat studies (e.g. Ye et al. Reference Ye, Chen, He, Fu and Liao2026). The entire survey protocol, including the specific methods used to quantify each variable, followed procedures established in previous studies (Ye et al. Reference Ye, Chen, He, Fu and Liao2026).
Statistical analyses
Field surveys during winter were conducted using a total of 80 sampling quadrats, including 40 presence quadrats where T. temminckii was recorded and 40 paired control quadrats. We first assessed whether the data met parametric assumptions using the Shapiro–Wilk test for normality and Levene’s test for homogeneity of variance. As most variables violated these assumptions, differences in continuous habitat characteristics between used sites and randomly selected control sites were evaluated using the non-parametric Mann–Whitney U test, while the categorical variable was analysed using a chi-square test. To identify the primary environmental gradients influencing winter habitat use, we conducted a principal component analysis (PCA) on 15 standardised habitat variables. Principal components with eigenvalues greater than 1, according to the Kaiser–Guttman criterion, were retained for ecological interpretation. We applied Varimax rotation to the retained components to improve interpretability, and the rotated component scores were then used as predictors in binomial logistic regression models to quantify their influence on habitat use.
Model selection was performed using the small-sample corrected Akaike Information Criterion (AICc). All possible combinations of the retained principal components were systematically generated and evaluated. Candidate models with ΔAICc <2 relative to the best-supported model were subsequently incorporated into a multi-model inference framework using the MuMIn package in R version 4.3.0 (Barton Reference Barton2020). This approach enabled the calculation of robust, model-averaged parameter estimates while accounting for model selection uncertainty. Model performance was assessed using the area under the receiver operating characteristic curve (AUC). All statistical analyses were conducted in R version 4.3.0 (R Core Team 2021). A significance level of α = 0.05 was adopted for all statistical tests.
Results
The establishment of used quadrats was based on independent field occurrences of the species, which included 11 direct sightings, 3 auditory detections, and 26 indirect signs (feathers and fresh faeces). Topographic analysis indicated that the species primarily occurred at elevations ranging from 1,310 to 1,860 m (Figure 2A). Although no strong preference for specific slope gradients was detected, occupied sites consistently averaged approximately 24° in slope (Figure 2B). Aspect analysis further revealed a clear selection for shady and semi-shady slopes (Figure 2C). In addition, T. temminckii significantly favored habitats with taller trees, greater tree and bamboo canopy cover, and higher litter coverage, while avoiding areas with dense shrub cover and tall herbaceous vegetation (Table 1).
Topographic variation in microhabitat use by the Temminck’s Tragopan T. temminckii during the non-breeding season (n = 40). (A) Distribution of the used elevations. (B) Distribution of the used slopes. (C) The proportion of locations across aspects. Aspect categories: N (north), NE (northeast), E (east), SE (southeast), S (south), SW (southwest), W (west), and NW (northwest).

Figure 2. Long description
Panel A is a density plot of elevation in meters. The x-axis ranges from 1300 to 1800. The y-axis represents density from 0.000 to 0.002. A green curve shows a primary peak near 1500 meters and a secondary, smaller peak near 1800 meters. A vertical dashed red line marks approximately 1600 meters. Individual data points are marked as green ticks along the x-axis.
Panel B is a violin plot with an overlaid box plot and jittered data points for slope in degrees. The y-axis ranges from 10 to 40. The violin shape is widest between 20 and 30 degrees, indicating the highest frequency of use. The internal box plot shows a median value around 25 degrees, with the interquartile range spanning roughly 19 to 27 degrees.
Panel C is a bar chart showing the percentage of locations across eight aspects. The y-axis ranges from 0 to 30 percent. The highest bars are for N and N E, both at 25 percent. S W and N W follow at 15 percent each. S is at approximately 7 percent, while S E and W are at 5 percent. E has the lowest frequency at approximately 2 percent.
Comparisons of microhabitat variables of T. temminckii between used microhabitats and control quadrats in winter. Continuous variables were compared using a Mann-Whitney U test (presented as median and U statistic). Categorical variables (Aspect) were analysed using a chi-square test.

Table 1. Long description
The table consists of five columns: Variables, Microhabitat (n = 40), Control Quadrat (n = 40), U / chi-squared, and P.
Key significant findings (P < 0.05) include:
* Tree height (m): Microhabitat 11.0 vs Control 10.0 (P = 0.026).
* Tree coverage (%): Microhabitat 52.5 vs Control 30.0 (P < 0.001).
* Litter coverage (%): Microhabitat 85.0 vs Control 62.5 (P < 0.001).
* Herb height (cm): Microhabitat 8.0 vs Control 30.0 (P = 0.002).
* Bamboo height (m): Microhabitat 3.81 vs Control 3.2 (P = 0.018).
* Bamboo coverage (%): Microhabitat 56.0 vs Control 25.0 (P < 0.001).
Non-significant variables (P > 0.05) include:
* Elevation (m): 1574.5 vs 1576.0.
* Slope (degrees): 25.0 vs 16.0.
* Aspect: chi-squared = 3.02 (P = 0.384).
* Shrub height (m): 4.55 vs 4.25.
* Shrub coverage (%): 20.0 vs 30.0.
* Herb coverage (%): 16.0 vs 16.5.
* Distance to stream (m): 21.5 vs 27.5.
* Distance to road (m): 647.5 vs 841.0.
* Distance to forest (m): 5.0 vs 6.0.
* P <0.05; ** P <0.01; *** P <0.001.
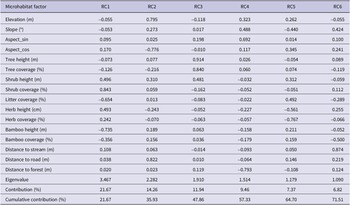
To further examine winter microhabitat use patterns, we conducted a principal component analysis (PCA) on 15 microhabitat variables. This analysis extracted six components with eigenvalues greater than 1, which together explained 71.51% of the total environmental variation (Table 2). The first principal component (RC1), accounting for 21.67% of the variance, was strongly associated with shrub and bamboo structure, with high positive loading on shrub coverage (0.843) and negative loading on bamboo height (−0.735). The second component (RC2, 14.26% of variance) reflected topographic influences, with notable loadings on distance to road (0.822), elevation (0.844), and aspect cosine value (−0.776). RC3 (11.94% of variance) primarily represented tree-layer structure, dominated by tree height (0.914) and tree canopy cover (0.840). The remaining components (RC4, RC5, and RC6) were respectively associated with distance to forest edge, herbaceous cover, and proximity to streams (Table 2).
Principal component loading matrix of microhabitat variable of Temminck’s Tragopan T. temminckii in winter
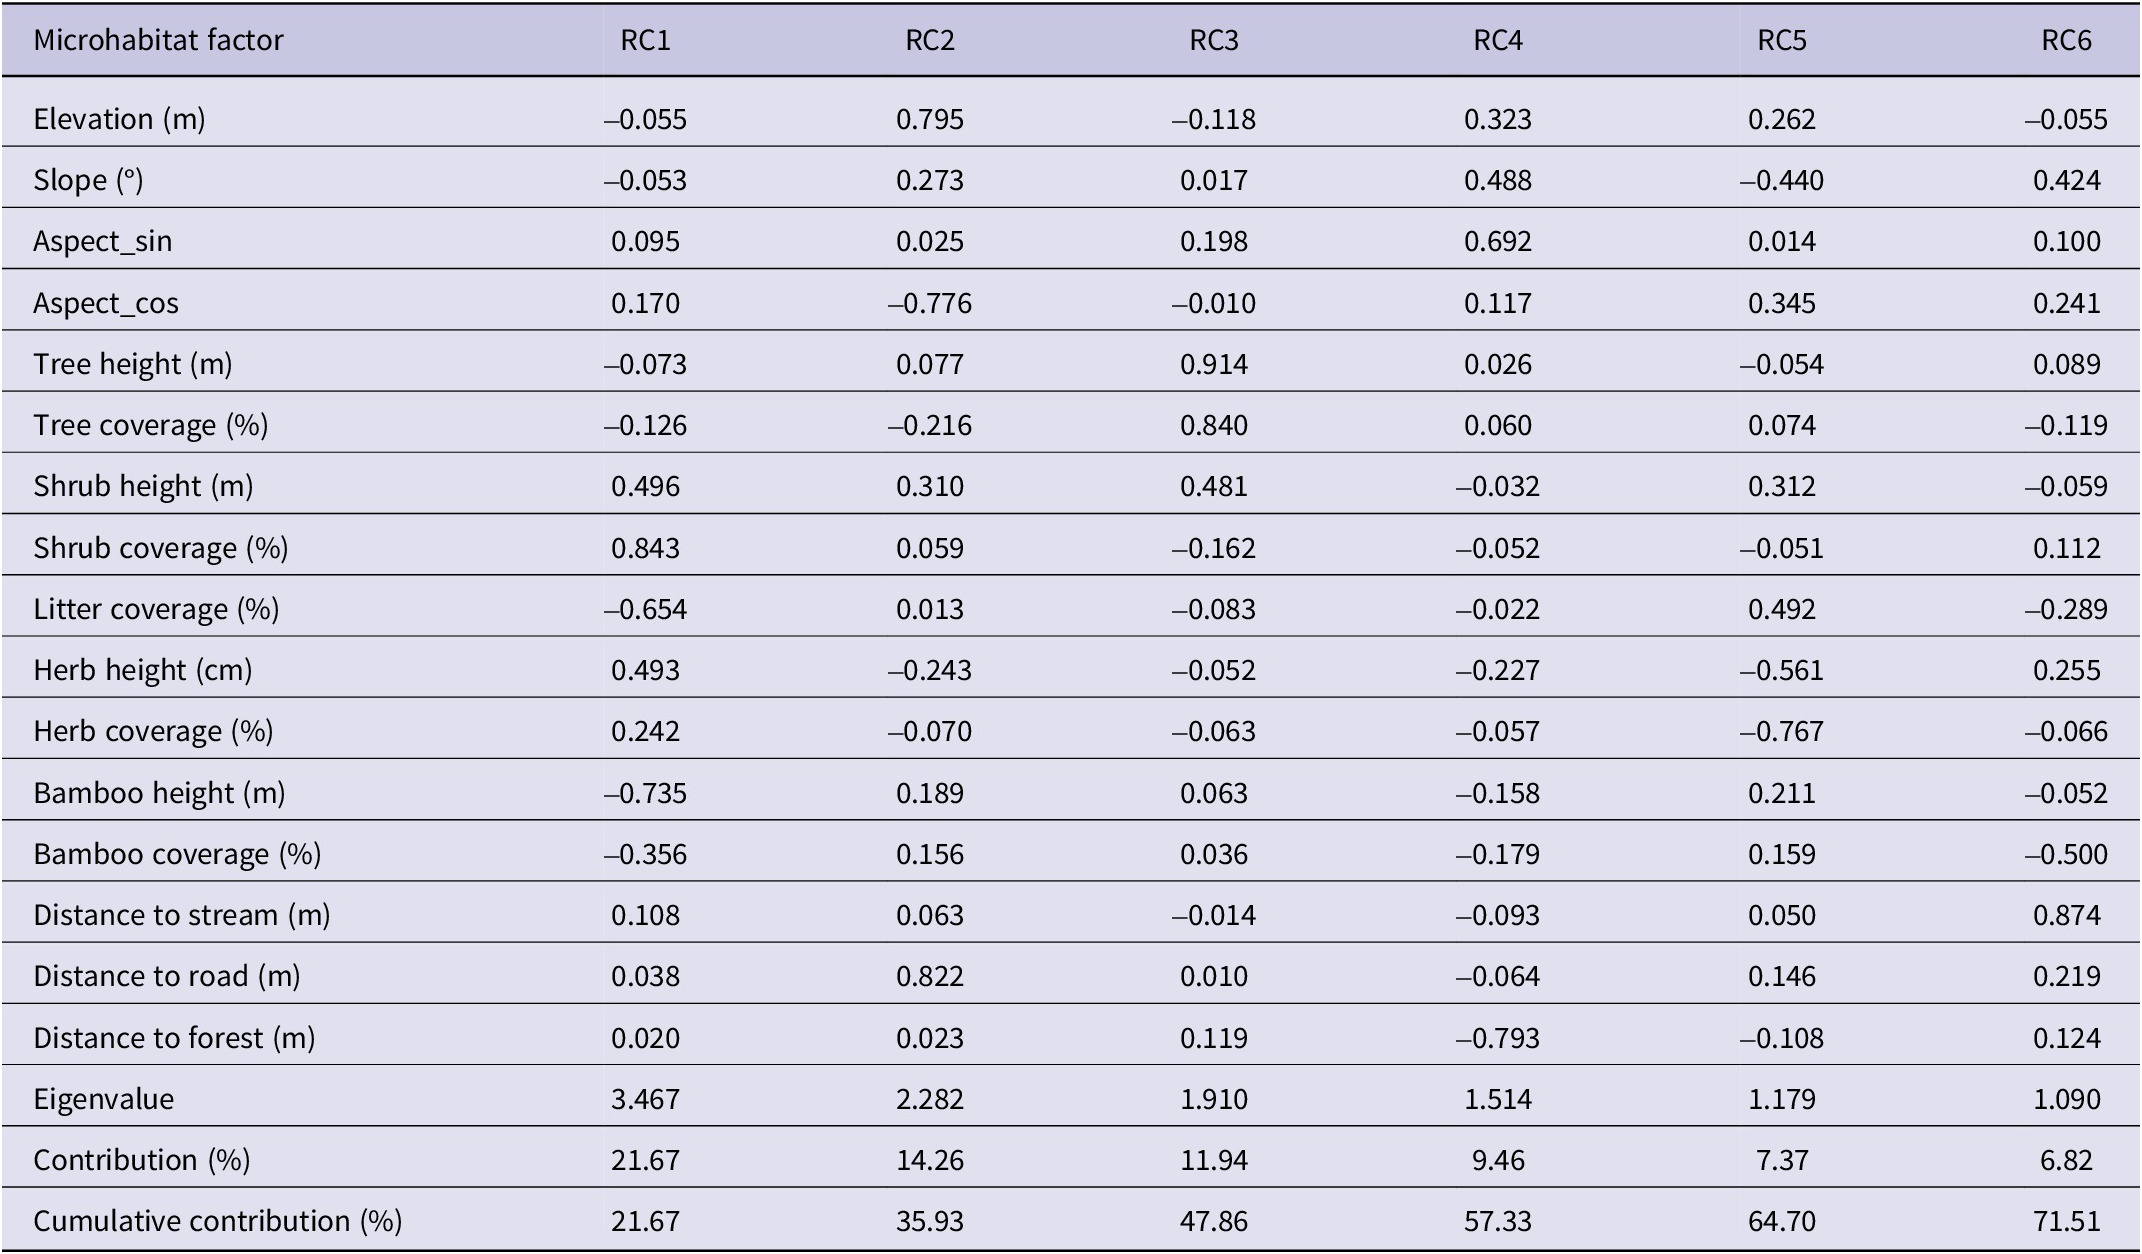
Table 2. Long description
The table consists of 7 columns: Microhabitat factor, R C 1, R C 2, R C 3, R C 4, R C 5, and R C 6.
Microhabitat factor rows and their primary loadings:
* Elevation (m): 0.795 on R C 2.
* Slope (degrees): 0.488 on R C 4.
* Aspect_sin: 0.692 on R C 4.
* Aspect_cos: -0.776 on R C 2.
* Tree height (m): 0.914 on R C 3.
* Tree coverage (percent): 0.840 on R C 3.
* Shrub height (m): 0.496 on R C 1 and 0.481 on R C 3.
* Shrub coverage (percent): 0.843 on R C 1.
* Litter coverage (percent): -0.654 on R C 1.
* Herb height (cm): -0.561 on R C 5.
* Herb coverage (percent): -0.767 on R C 5.
* Bamboo height (m): -0.735 on R C 1.
* Bamboo coverage (percent): -0.500 on R C 6.
* Distance to stream (m): 0.874 on R C 6.
* Distance to road (m): 0.822 on R C 2.
* Distance to forest (m): -0.793 on R C 4.
Statistical summary rows:
* Eigenvalue: Ranges from 3.467 for R C 1 down to 1.090 for R C 6.
* Contribution (percent): R C 1 (21.67), R C 2 (14.26), R C 3 (11.94), R C 4 (9.46), R C 5 (7.37), R C 6 (6.82).
* Cumulative contribution (percent): Reaches 71.51 percent by R C 6.
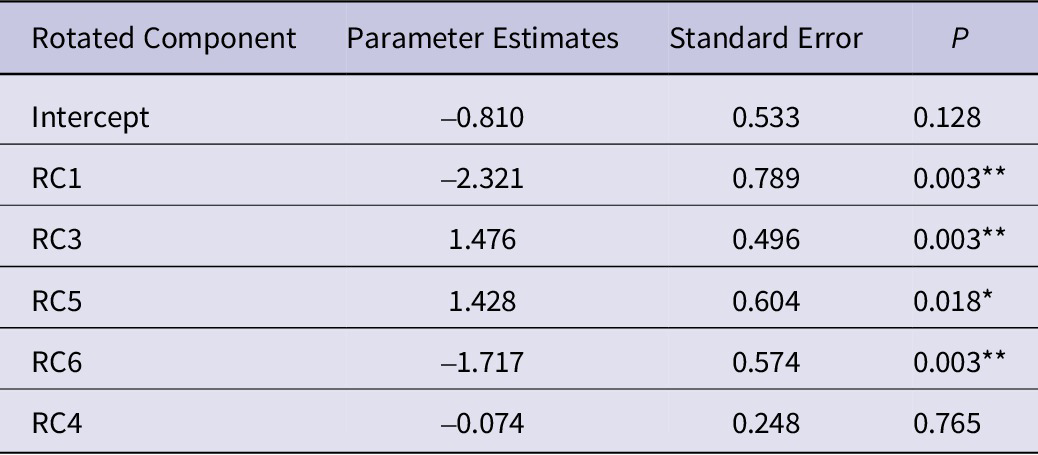
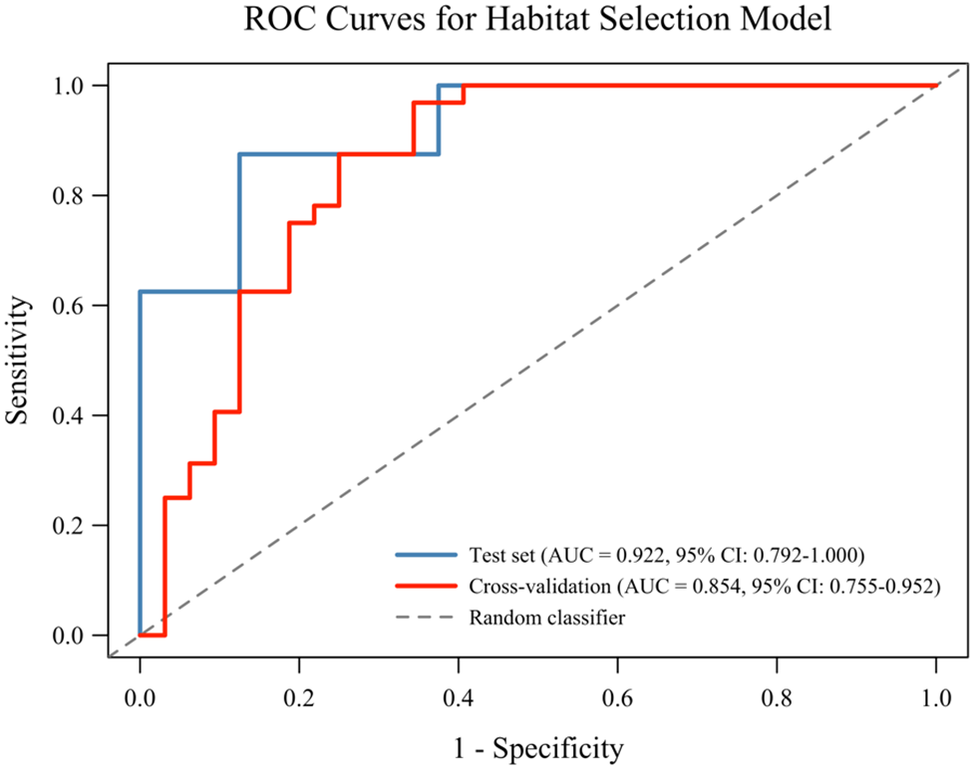
We constructed a logistic regression model based on the rotated component scores to predict winter microhabitat use by T. temminckii. The best-supported model (ΔAICc <2) indicated that RC3 (representing tree structure) and RC5 (representing herb coverage) had significant positive effects on habitat use (β = 1.476, P = 0.003; β = 1.428, P = 0.018, respectively; Table 3). In contrast, RC1 (associated with bamboo and shrub structure) and RC6 (related to distance to streams) exerted significant negative effects (β = −2.321, P = 0.003; β = −1.717, P = 0.003, respectively; Table 3). RC4 (related to distance to forest edge) did not contribute significantly to the model (β = −0.074, P = 0.765; Table 3). Model performance was robust, with ROC curve analysis yielding high area under the curve (AUC) values of 0.922 for the test set and 0.854 under cross-validation, indicating strong predictive accuracy and reliable generalisation (Figure 3).
The parameters of logistic regression models of Temminck’s Tragopan T. temminckii microhabitat use in winter. Only models with ΔAICc ≤2 are shown

Table 3. Long description
The table consists of four columns: Rotated Component, Parameter Estimates, Standard Error, and P.
* Intercept: Parameter Estimate -0.810, Standard Error 0.533, P 0.128.
* R C 1: Parameter Estimate -2.321, Standard Error 0.789, P 0.003 (significant at P < 0.01).
* R C 3: Parameter Estimate 1.476, Standard Error 0.496, P 0.003 (significant at P < 0.01).
* R C 5: Parameter Estimate 1.428, Standard Error 0.604, P 0.018 (significant at P < 0.05).
* R C 6: Parameter Estimate -1.717, Standard Error 0.574, P 0.003 (significant at P < 0.01).
* R C 4: Parameter Estimate -0.074, Standard Error 0.248, P 0.765.
Footnote indicates that one asterisk denotes P < 0.05 and two asterisks denote P < 0.01.
*P <0.05; **P <0.01; ***P <0.001.
ROC curves assessing model performance for habitat use by Temminck’s Tragopan T. temminckii during non-breeding seasons. ROC represents receiver operating characteristic; AUC represents the area under the ROC curve.

Figure 3. Long description
A line graph titled R O C Curves for Habitat Selection Model. The x-axis is labeled 1 minus Specificity with values from 0.0 to 1.0. The y-axis is labeled Sensitivity with values from 0.0 to 1.0.
* A gray dashed diagonal line represents the Random classifier, extending from the origin 0,0 to the top-right corner 1,1.
* A blue stepped line represents the Test set. It rises sharply from the origin, reaching a sensitivity of approximately 0.6 at 1 minus specificity of 0.0, then steps up to nearly 0.9 at 0.15, and reaches 1.0 at approximately 0.4.
* A red stepped line represents Cross-validation. It follows a more gradual stepped increase, staying below the blue line initially, crossing it around 0.35 on the x-axis, and reaching a sensitivity of 1.0 at approximately 0.45.
The legend in the bottom right quadrant provides the following data:
* Test set (blue line): A U C equals 0.922, 95% C I: 0.792-1.000.
* Cross-validation (red line): A U C equals 0.854, 95% C I: 0.755-0.952.
* Random classifier: gray dashed line.
Discussion
Our findings suggest that T. temminckii exhibits pronounced, multi-scale selection for specific winter microhabitats. At the landscape scale, the species preferentially occupies mid-elevation zones (1,310–1,860 m) with slopes averaging approximately 24° and shows a clear affinity for shady and semi-shady aspects. At the fine scale, it favors mature forest stands characterised by tall trees, high tree and bamboo canopy cover, and greater litter accumulation. Among these habitat features, the structural complexity provided by the tree and bamboo layers appears to be the primary factor driving winter habitat use.
The winter microhabitat strategy of T. temminckii in subtropical montane ecosystems reflects an integrated response to environmental heterogeneity, combining stable topographic preferences with flexible resource-based choices. Our study reveals consistent selection for mid-elevation terrain (1,310–1,860 m), areas with moderate and uniform slopes, which aligns with a common anti-predator strategy in phasianids. Such topographic features help minimise predation risk by providing unobstructed lines of sight and predictable escape routes (Xi et al. Reference Xi, Luo, Ran, Feng, Chen and Chen2020). Unlike some other montane galliforms, such as Cabot’s Tragopan Tragopan caboti and the Sichuan Hill Partridge Arborophila rufipectus, which undertake seasonal elevational movements (Liao et al. Reference Liao, Fuller, Hu and Li2008; Bei et al. Reference Bei, Lai, Bai, Bin, Qin and Chen2025), our study did not find evidence of a distinct downward shift in T. temminckii during winter. The winter elevations recorded in this study (1,310–1,860 m) largely overlap with the breeding season elevations reported for this species in the same reserve (Zhao et al. Reference Zhao, Ye, Chen, Cao, Tian and Wu2026). Instead, the winter habitat selection of T. temminckii appears to be primarily driven by microclimatic and food resource considerations within the mid-elevation zone. Thus, rather than undertaking a pronounced altitudinal shift, the species may simply remain within the same elevational belt while adjusting its microhabitat use by, for example, selecting dense canopy cover to buffer against winter conditions. Climate change could alter this pattern: rising winter temperatures might reduce the need for such behavioural buffering, whereas more extreme winter conditions (e.g. increased snow depth) could intensify it. However, long-term empirical data on altitudinal movements for this species in Laojunshan are lacking, and future research should prioritise systematic year-round monitoring.
The Temminck’s Tragopan also selects slopes averaging approximately 24°, which provide an optimal trade-off between drainage and insulation, preventing ice accumulation while retaining protective snow cover (Nyairo Reference Nyairo2024). This is consistent with the preference for gentle to moderate slopes reported in other pheasant species during winter (Liu et al. Reference Liu, Huang, Gu and Lu2012; Ye et al. Reference Ye, Chen, He, Fu and Liao2026). These moderate slopes further reduce wind exposure, aiding in energy conservation. Additionally, the species exhibits a clear preference for shady and semi-shady aspects, which may offer a more stable microclimate by prolonging snow cover, and reducing wind chill (Liao et al. Reference Liao, Li, Hu and Lu2007). Such slopes also support denser understorey vegetation, providing enhanced cover from predators and improved access to winter food resources, including buds, seeds, and invertebrates.
Beyond thermoregulation, resource acquisition plays a critical role in shaping the winter habitat use of T. temminckii. A marked preference for habitats near perennial streams likely ensures reliable access to water, an essential physiological requirement for adult birds, a pattern also observed in other galliform species (Guo et al. Reference Guo, Xu, Pu, Yin, Fu and Huang2025). This is strongly supported by the significant negative loading of the rotated component associated with distance to water (RC6) in our models. Thus, the winter strategy of T. temminckii can be understood as a combination of two complementary adaptations. On the one hand, individuals select topographically stable sites which reduce wind exposure, prevent ice accumulation, and provide a more stable microclimate. On the other, they select lower-risk sites while simultaneously optimising access to key resources by selecting locations near perennial streams and with high canopy and thick litter layers.
The habitat ecology of T. temminckii may reflect a strategic balance between consistent topographic preferences and seasonal flexibility in vegetation use (Bei et al. Reference Bei, Lai, Bai, Bin, Qin and Chen2025). While the species shows fidelity to specific elevation zones and slope angles, it demonstrates notable plasticity in its selection of vegetation structure in several key aspects across seasons, adapting to shifting priorities for concealment and resource acquisition (Wang et al. Reference Wang, Zhou, Zhang, Wang, Li and Hu2022b). During the breeding season, T. temminckii strongly selects for tall bamboo and taller shrub layers (Zhao et al. Reference Zhao, Ye, Chen, Cao, Tian and Wu2026), which provide essential concealment for nesting. In winter, by contrast, the species showed a tendency to avoid areas with dense shrub cover and exhibited a weaker association with bamboo structure (RC1 had a negative effect in winter but was the strongest positive predictor in breeding). In addition, breeding birds avoid both tall and dense herbaceous vegetation, while winter birds mainly avoid tall herbs but not herb cover. These differences reflect a seasonal trade-off that breeding prioritises concealment and nest-site safety, whereas winter prioritises thermal shelter and foraging efficiency while minimising energy expenditure and avoiding understorey structures that hinder movement. In winter, the species prefers sites with well-developed tree structure and substantial litter accumulation. The overhead canopy offers shelter from precipitation and wind, aiding thermoregulation and reducing visibility to predators, while the dense litter layer insulates against cold ground and serves as a critical foraging substrate. This aligns with dietary studies indicating a greater reliance on plant material, such as fruits, over invertebrates during winter (Cui and Deng Reference Cui and Deng2013), a pattern supported by our field observations of feeding traces, faecal matter, and abundant acorns near recent activity signs. Together, these structural and trophic adaptations allow T. temminckii to minimise energy expenditure, reduce heat loss, and limit exposure during the demanding winter months.
Dense shrub cover is widely regarded as an adaptive response to predation pressure in many pheasant species, representing a convergent anti-predator strategy (Walsberg Reference Walsberg1986; Whitaker et al. Reference Whitaker, Stauffer, Noman, Devers, Alen and Bitter2006). For example, the Sichuan Hill Partridge uses high shrub cover in winter to enhance habitat quality by reducing predation risk (Liao et al. Reference Liao, Li, Hu and Lu2007). Similarly, concealment is the primary criterion for winter habitat selection in the Brown Eared-pheasant Crossoptilon mantchuricum (Zhang et al. Reference Zhang, Zheng, Zhang, Guo, Wang and Gong2005), and Tibetan Eared-pheasants C. harmani select high-coverage shrub habitats during non-breeding periods to reduce vulnerability at nocturnal roosts (Lu and Zheng Reference Lu and Zheng2002). In contrast, T. temminckii avoids winter habitats with dense shrub cover, a preference likely to be linked to its distinct foraging ecology and predator-avoidance behaviour. As a large, predominantly arboreal pheasant that feeds on fruits, buds, and invertebrates both in trees and on the forest floor, dense understorey can impede movement and limit access to food. Instead, the species appears to rely more on the vertical structure of taller trees for roosting and escape rather than on low shrubs for concealment. Moreover, dense shrub cover may create microclimates with higher humidity or greater snow retention, which could be less favorable for thermoregulation (Walsberg Reference Walsberg1986; Yuan et al. Reference Yuan, Yan, Cheng and Jiang2018). This avoidance pattern also extends to areas with tall herbaceous layers, which obstruct sightlines, delay detection of ground predators, and consequently increase vulnerability.
Based on the winter habitat-use patterns identified for T. temminckii, we propose several targeted management actions for Laojunshan National Nature Reserve and similar subtropical montane ecosystems where conservation of Temminck’s Tragopan is a primary objective. Priority should be given to preserving bamboo patches and intact litter layers on gentle slopes, as these microhabitat features are crucial for foraging and shelter. Maintaining vertical structural complexity in both the forest canopy and understorey is also essential, as it provides concealment and helps reduce predation risk during winter. While these recommendations stem from a local population and require validation across the species’ range, and while it should be noted that other threatened species in reserves such as Laojunshan may have different habitat requirements, thus an approach maintaining a mosaic of habitats may also need to be considered, depending on the conservation objectives of the management plan. In addition, given that the reserve‘s maximum elevation is only slightly above the species’ current upper elevational limit, further upward shifts under climate warming could reduce available habitat area. Thus management should also integrate climate projections and prioritise core areas with stable microclimate and water sources. In any case, our findings highlight the importance of seasonally tailored habitat management for effective conservation.
We acknowledge that our plot-based habitat assessments may not fully capture proportional habitat use or subtle selection behaviours across demographic groups. Future studies using radio telemetry or GPS tracking could clarify fine-scale habitat selection, movement patterns, and potential age- or sex-related behavioural differences, thereby helping to refine conservation strategies. Although habitat enhancement measures are underway in the reserve, anthropogenic disturbances, such as tourism, and forest grazing, continue to affect galliform habitats (Ye et al. Reference Ye, Chen, He, Fu and Liao2026). We therefore recommend that local governments promote alternative livelihoods to reduce community dependence on forest resources while also strengthening enforcement against poaching within the reserve to support long-term species recovery and habitat integrity.
In summary, the Temminck’s Tragopan employs a stage-specific winter habitat strategy that dynamically balances thermoregulation with survival demands. It is plausible that this strategy may involve a distinct diel rhythm, in which diurnal periods prioritise microhabitats that enhance foraging efficiency, while nocturnal selections shift decisively toward sheltering structures that minimise thermoregulatory costs and predation risk. However, this hypothesis requires direct testing with time-resolved observational data. If confirmed, such temporal niche partitioning would represent a critical adaptive trade-off, optimising fitness by separating energy-intensive activities from periods dedicated to energy conservation. Regardless, the behavioural plasticity underscores the species’ capacity to respond to fine-scale environmental variation and highlights the need for conservation frameworks that preserve both the structural and temporal complexity of its montane forest habitat, particularly under ongoing climate change.
Acknowledgments
We would like to thank CY Su, S Cao and Y. Yang for their assistance in data collection during the experiment. This research was funded by the National Natural Science Foundation of China (32370456; 32200338), the Key Project of Natural Sciences Foundation of Sichuan Province (22NSFSC0011) and the Fundamental Research Funds of China West Normal University (25KE019).