I. INTRODUCTION
Oxide-dispersion-strengthened (ODS) ferritic alloys are believed to be the most promising candidates of structural materials for advanced nuclear systems, such as Generation IV fission systems and the demonstration fusion reactors. Reference Noh, Kasada and Kimura1–Reference Ribis and de Carlan4 Traditional high Cr ferritic creep resistant alloys, which are used as header and main/reheat steam pipe in thermal power plant, possess enhanced creep strength at the elevated temperatures. Those materials are mainly strengthened by solid solution strengthening and carbide or nitride precipitation strengthening. Reference Tanelke, Abe and Sawada5 However, these strengthening mechanisms become ineffective above 650 °C as a result of the precipitation coarsening or dissolution. Large drop in creep strength of high Cr ferritic creep resistant alloys was observed in long-term high temperature service condition, Reference Kimura6 whereas higher temperature is required to improve the reactor's efficiency. Compared with traditional high Cr ferritic creep resistant alloys, the advanced ferritic ODS alloys will be served in a more adverse circumstance in which there are higher operating temperature and higher neutron-radiation damage than that of current light water reactor. Reference Hin and Wirth7,Reference Lescoat, Monnet, Ribis, Dubuisson, de Carlan, Costantini and Malaplate8 Dispersion of homogenously nanoscale oxide particles is effective in increasing the operating temperature of the first wall in future fusion up to around 700 °C, leading to an improved efficiency (≥40%) of reactors. Reference Lindau, Möslang, Schirra, Schlossmacher and Klimenkov9,Reference Hsiung, Fluss, Tumey, Choi, Serruys, Willaime and Kimura10 Moreover, these nanoscale oxide particles can provide effective traps for the insoluble helium, thus retarding degradation of the steels under irradiation by neutrons, electrons, and ions. Reference Ukai, Mizuta and Fujiwara11,Reference Kishimoto, Kasada, Hashitomi and Kimura12
The nanoscale oxide particles give a major push to the improvement of mechanical performance of the ODS alloys. However, these particles do not possess perfect stability under irradiation. Monnet et al. pointed out that the dissolution almost occurs for all oxide particles and MgAl2O4 and Y2O3 particles have relatively high stability. Reference Monnet, Dubuisson, Serruys, Ruault, Kaïtasov and Jouffrey13 MgAl2O4 and Y2O3 particles are equally stable under irradiation, but their strengthening effect for the mechanical properties varied to some extent. Cayron et al. elaborated MgAl2O4 ODS alloy and Y2O3 ODS alloy through different additions and the results indicated that the alloy reinforced by MgAl2O4 has more superior mechanical properties. Reference Cayron, Rath, Chu and Launois14 In this study, a new economical method by the addition of MgO and Al2O3 was used for the elaboration of MgAl2O4 reinforced ODS alloy. The objective of this work was to study microstructural evolution of the mixed powders at each step of elaboration and the formation of MgAl2O4 oxide particles. This paper presents recent achievements in the processes of the ODS alloy elaboration, with the aim of clarifying some important information in microstructural control.
II. EXPERIMENTAL PROCEDURES
Iron powders (99.99% Fe with a particle size of 45 μm), chromium powders (99.99% Cr with a particle size of 45 μm), magnesium oxide powders (99.5% MgO with a particle size of 50 μm), and aluminum oxide powders (99.5% Al2O3 with an average size of 50 μm) were used. The powders were weighed separately and then mixed to achieve the desired composition of Fe–9Cr–0.5%MgAl2O4 (the mixed powders before hot isostatic pressing (HIP) were called as Fe–9Cr–0.14%MgO–0.36%Al2O3). The original powders were manually mixed before mechanical milling (MM), and then mechanically milled for 200 h in a high-energy planetary-type ball mill (QM-3SP2) at a rotation speed of 300 rpm in argon gas atmosphere. The weight ratio of ball to powder was 15:1. The mechanically alloyed powders were then cold pressed at 50 MPa in a graphite die and the cold pressed billets were subsequently hot pressed in high-purity argon gas atmosphere at 1373 K/70 MPa.
X-ray diffraction (XRD) analysis was performed on a RIGAKU D/MAX 2500V/PC (Rigaku Corporation, Austin, TX) using Cu Kα radiation. The grain size changed by MM was estimated from the full width at half maximum (FWHM), using Scherrer's formula Reference Danilchenko, Kukharenko, Moseke, Protsenko, Sukhodubi and Sulkio-Cleff15,Reference Jiang, Rühle and Lavernia16 :
 $$L = 0.91\lambda /(\beta \cos \theta )\quad {\rm{,}}$$
where λ is the x-ray wave length and β is the FWHM. The peak position and the FWHM of the corresponding peaks were analyzed by the software installed in the RIGAKU D/MAX 2500V/PC diffractometer. It should be noted that the mixed powders Fe–9Cr–1.4%MgO–3.6% Al2O3 used for XRD measurement contain about 10 times MgO and Al2O3 (compared with the nominal composition) which is beneficial to the detection. The microstructure of the mechanically milled powders was observed by a XL30E scanning electron microscope (SEM; Philips Corporation, Netherlands). To observe the microstructure of the nanoscale oxide particles in the mechanically milled powders, the chemical extraction was used, and the detailed procedure can be seen in Ref. Reference Dai, Liu and Dong17. For TEM observation of the HIPped materials, the specimen was prepared by twin-jet reduction and ion cleaning and the detailed steps are reported in Ref. Reference Dai, Liu, Dong, Yu and Ma18. TEM observations of the microstructure of the HIPped materials were conducted on a JEM-100CX II transmission electron microscope (TEM; JEOL Ltd., Tokyo, Japan). Highly magnified observations for the nanoscale oxides in matrix of the HIPped materials were carried out on a JEM-2100F TEM.
III. RESULTS AND DISCUSSION
A. Microstructural changes of the mixed powders during MM
Figure 1 shows the SEM observations of the initial iron powders and the Fe–9Cr–0.14%MgO–0.36%Al2O3 powder mixture after being mechanically milled for various periods. The initial iron powders have a globular shape. With increasing milling time, the morphology of the mixed powders shows the typical plate shape with irregular edge. That is ascribed to severe plastic deformation during MM. The ductile iron got flattened, while the brittle oxide particles (MgO and Al2O3) became fragmented by the ball-powder-ball collisions. The particle size of the mixed powders was remarkably affected by MM, which is 35, 10, and 2 μm after being mechanically milled for 30, 80, and 200 h, respectively. Figure 2 shows the aggregation of the Fe–9Cr–0.14%MgO–0.36%Al2O3 powders after being milled for 30 h. The increasing size of the thick powder particle (shown in Fig. 2) is due to the effect of cold welding process. The grain size of the mixed powders after being mechanically milled for 200 h is reduced to 17 nm (calculated by Scherrer's formula). Severe plastic deformation, coupled with the characterization of brittleness of oxide particles, promotes grain refinement with increasing milling time.
Typical scanning electron microscopical images exhibit the morphology of (a) un-milled pure iron powder and the Fe–9Cr–0.14%MgO–0.36%Al2O3 powders mechanically milled for (b) 30 h, (c) 80 h, and (d) 200 h.

Aggregation of the milled powder of the Fe–9Cr–0.14%MgO–0.36%Al2O3 powders mechanically milled for 30 h. The cold welding process is considered to be dominant in the early stage of MM.

B. Dissolution of the additive of MgO and Al2O3 powders
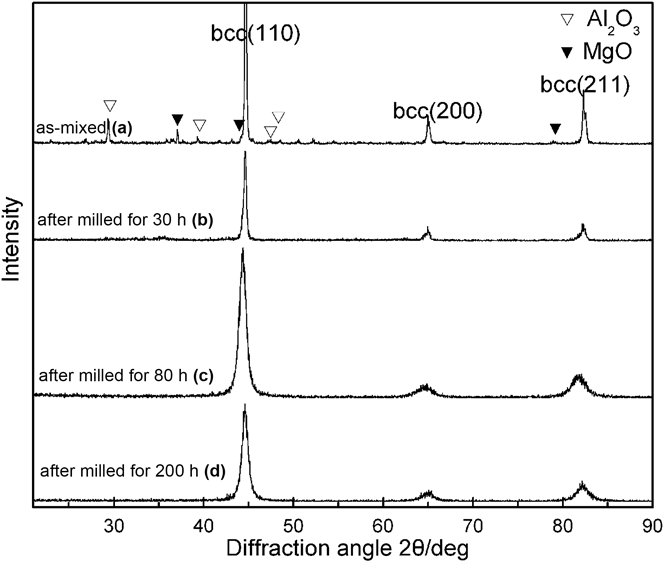
Figure 3 shows the XRD patterns of the Fe–9Cr–1.4%MgO–3.6%Al2O3 mixed powders after being mechanically milled for a maximum period of 200 h. The intensity of the MgO and Al2O3 diffraction peak decreases with increasing MM time. The diffraction peaks almost disappear as a result of broadening of the peak after being mechanical milled for 80 h and 200 h. Broadening of the diffraction peaks can be attributed to decreasing size and strain arising from crystal imperfection and distortion after being mechanically milled for long milling time. The cell parameter calculated from XRD result of the mixed powders after being mechanically milled for 200 h is 0.28607 nm, which is slightly greater than that of pure iron. However, it is hard enough to determine whether magnesium, aluminum, and oxygen atoms move into the bcc crystalline lattice during MM due to XRD measurement has difficulties in detecting the enlargement of the peaks induced by MM. To probe the existence of MgO and Al2O3 powders, further testing and discussion will be done later.
XRD patterns of the Fe–9Cr–1.4%MgO–3.6%Al2O3 powders after being mechanically milled for different periods: (a) as-mixed, (b) 30 h, (c) 80 h, and (d) 200 h.

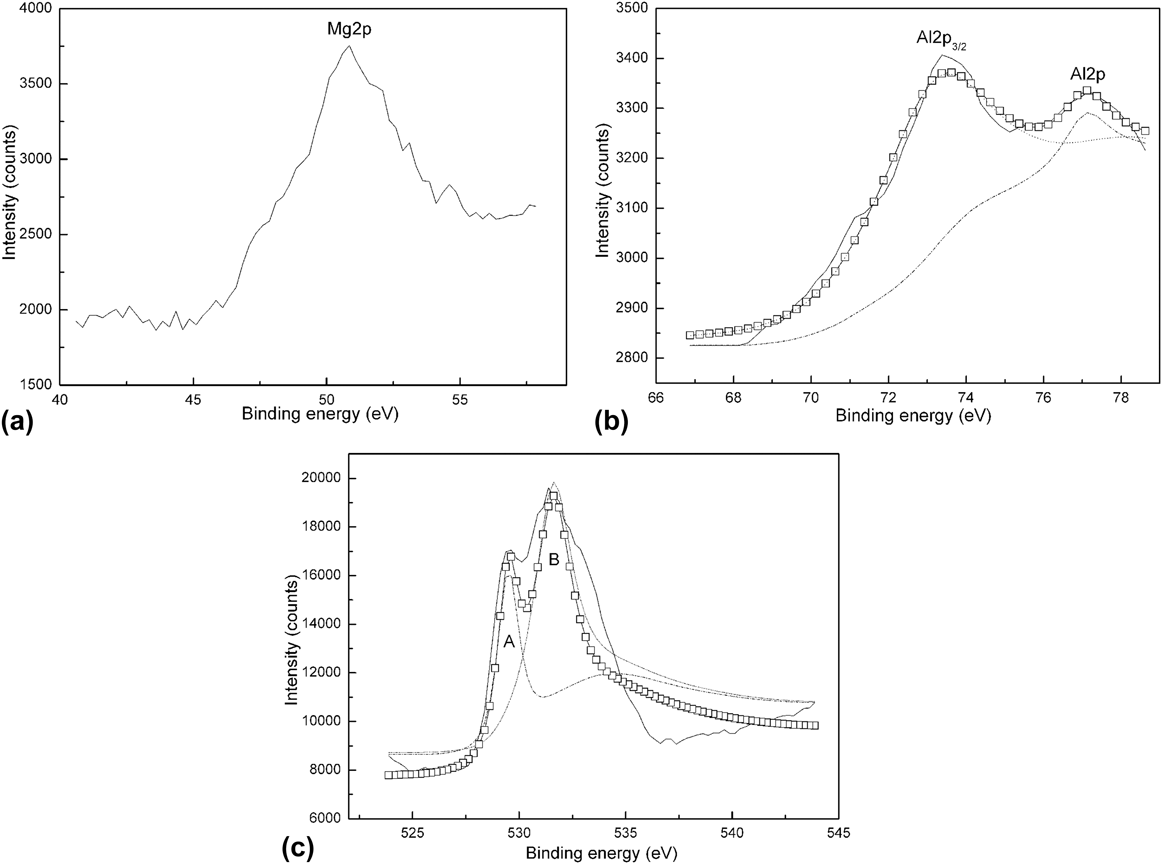
Figure 4 shows the XPS spectra for Mg2p [Fig. 4(a)], Al2p [Fig. 4(b)], and O1s [Fig. 4(c)] for MgO and Al2O3 phase in Fe–9Cr–1.4%MgO–3.6%Al2O3 powders mechanically milled for 200 h. The peak of Mg2p for MgO phase appears at 50.8 eV which is close to 51 eV of the reported values for MgO published by Hoogewijs et al. Reference Hoogewijs, Fiermans and Electron19 The peaks of Al2p3/2 and Al2p for Al2O3 phase appear at 73.8 eV and 77.3 eV, respectively, in accordance with 73.9 eV and 77.3 eV from the reported values for Al2O3 published by Sugama et al. Reference Sugama, Kukacka and Carciello20 and Chen et al. Reference Chen, Splinter, Do and Mcintyre21 It confirms that magnesium and aluminum atoms still bond with oxygen atoms and that MgO and Al2O3 also remain in the mixed powders after being mechanically milled for 200 h. This indicates that magnesium, aluminum, and oxygen atoms remain clustered during their incorporation into the Fe–Cr binary system and they may exist in amorphous state or very small crystallites. The existence of combination between magnesium and aluminum atoms and oxygen atoms is also proved by the O1s spectrum shown in Fig. 4(c). The O1s peaks located at 529.7 eV and 531.3 eV are consistent with the reported value. Reference Chen, Splinter, Do and Mcintyre21
(a) Mg2p, (b) Al2p, and (c) O1s XPS spectra for oxide powders in Fe–9Cr–1.4%MgO–3.6%Al2O3 powders milled for 200 h. The solid squares represent the experimental points and the overlaying solid line and shot dot, dash dot, dash and solid line is the result of Gaussian multipeak fitting.

Figure 5 shows TEM image, EDS, and selected area electron diffraction (SAED) pattern spectra of the mixed powders of Fe–9Cr–1.4%MgO–3.6%Al2O3 after being mechanically milled for 200 h. EDS [Fig. 5(b)] analysis was performed to determine the concentration of the milled powders. Peaks of Cu and C came from the background of the supporting grid. The result indicates that the milled powders still contain magnesium, aluminum, and oxygen.
(a) Typical TEM image, (b) EDS spectrum, and (c) the corresponding SAED pattern of the Fe–9Cr–1.4%MgO–3.6%Al2O3 powder mixture after being mechanically milled for 200 h.

The rings in the SAED allow us to identify the bcc lattice. The three rings belong to Fe (110), Fe (200), and Fe (211), respectively. The rings indicate a very small size of crystallites (nanostructure) of iron phase.
Figure 6 shows HRTEM image of the mixed powders of Fe–9Cr–1.4%MgO–3.6%Al2O3 after being mechanically milled for 200 h. It can be seen from the image that the specimen contains crystalline domains (circled with white dots) where atoms are arranged in an orderly way and amorphous domains where atoms are arranged in a disorderly way. Based on the above TEM analysis, it can be concluded that the crystalline domains correspond to iron nanocrystallites and the amorphous domains are amorphous existence of MgO and Al2O3. The original MgO and Al2O3 powders are fractured and welded with rotation and vibration of container during MM and their long-range order structure is gradually damaged during the process. The dissolution of MgO and Al2O3 powders has occurred after MM for 200 h, and nanometric clusters of Mg, Al, and O are formed.
HRTEM image of the 200 h milled powders of Fe–9Cr–1.4%MgO–3.6%Al2O3, the parts circled with white dots indicate the shape of crystalline domains, and the other parts are amorphous domains distributed around crystalline domains.

Free energy stored during the process of MM is beneficial to the formation of amorphous phase. The milling powders store energy in the form of disordered atoms, grain boundaries, and lattice defects.
Reference Di and Bakker22
The volume fraction of grain boundary increases due to the decrease of iron grain size during MM. Koch
Reference Koch23
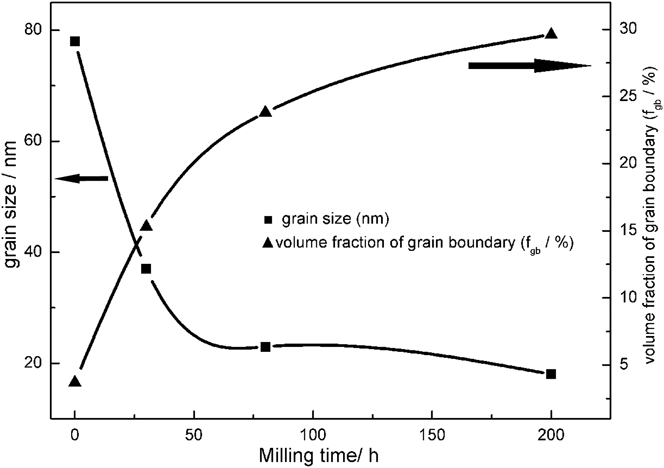
stated that the extra energy needed for the transformation from crystallite to amorphous comes from the large amount of grain boundary and grain boundary energy. In this study, the decrease of iron grain size during MM provides grain boundary and grain boundary energy needed for amorphization of MgO and Al2O3 particles. Figure 7 illustrates the measured grain size and corresponding volume fraction of grain boundaries of the Fe–9Cr–1.4%MgO–3.6%Al2O3 powders after being milled for different periods. The volume fraction of grain boundary was calculated by the equation
 ${f_{{\rm{gb}}}} = 3\{ \delta /D - {(\delta /D)^2}\}$
(where δ is the thickness of grain boundary, D is the grain size).
Reference Capolungo, Jochum, Cherkaoui and Qu24,Reference Kimura, Takaki, Suejima, Uemor and Tamehiro25
The volume fraction of grain boundary can be up to 30% when the grain size was reduced to 17 nm.
The measured grain size and corresponding volume fraction of grain boundary of the Fe–9Cr–1.4%MgO–3.6%Al2O3 powders milled for different periods.

C. Microstructural evolution after HIP
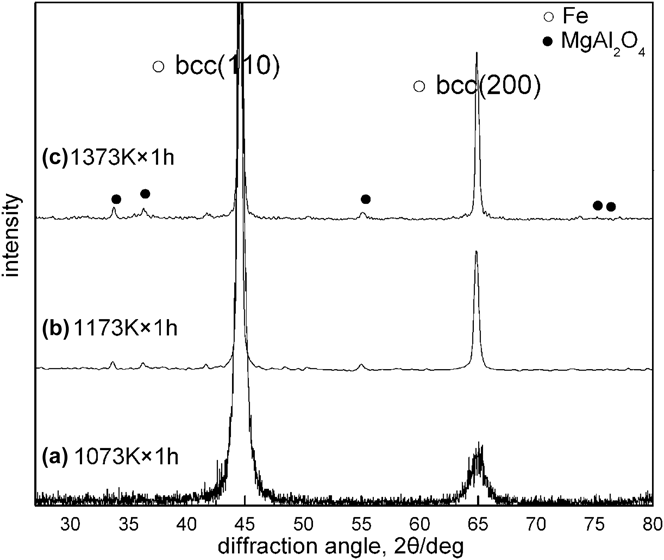
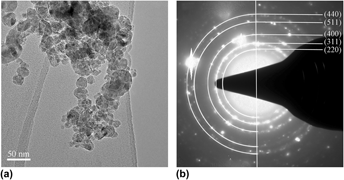
Figure 8 illustrates XRD pattern of mechanically milled powders of Fe–9Cr–1.4%MgO–3.6%Al2O3 after HIP at different temperatures. It can be seen from the image that the MgAl2O4 nanoscale oxide particles formed at 1173 K which is far below the traditional sintering temperature (1873 K) of the raw material. Crystallization of amorphous phase results in formation of MgAl2O4 nanoscale oxide particles during the process of sintering. Figure 9 shows the TEM image and the SAED pattern of oxide particles extracted from HIPped (1273 K × 1 h) powders of Fe–9Cr–0.14%MgO–0.36%Al2O3. It can be seen from the graph that the majority of oxide particles has a size ranging from 5 to 25 nm. A HRTEM micrograph from an oxide particle in which two atomic planes are simultaneously visible is shown in Fig. 10. A combination of the interplanar distances and the angle between the systems of the planes is marked in Fig. 10(a) for the (400) and (222) atomic planes of MgAl2O4 phase. FFT image derived from the image [marked with white solid lines in Fig. 10(a)] of the oxide particle is shown in Fig. 10(b). The diffraction spots from MgAl2O4 particle of {222} and {400} types are marked with circles.
XRD pattern of mechanically milled powders of Fe–9Cr–1.4%MgO–3.6%Al2O3 after HIP at (a) 1073 K × 1 h, (b) 1173 K × 1 h, and (c) 1373 K × 1 h.

(a) TEM image and (b) the corresponding SAED pattern of MgAl2O4 particles in mechanically milled powders of Fe–9Cr–0.14%MgO–0.36%Al2O3 after HIP at 1273 K × 1 h and chemical extraction.

(a) TEM and (b) FFT images of MgAl2O4 particles in mechanically milled powder mixture after HIP at 1273 K × 1 h and chemical extraction. The diffraction spots from MgAl2O4 particle of {222} and {400} types are marked with circles.

Figure 11 shows the TEM image and the SAED pattern of the HIPped Fe–9Cr–0.5%MgAl2O4 alloy. It can be seen from the graph that the HIPped alloy exhibits a full ferritic microstructure and the grains are equiaxed with a micrometric size. The grain size of the HIPped Fe–9Cr–0.5%MgAl2O4 alloy is about 1 μm. The SAED pattern of the matrix indicates the existence of the ferrite matrix with bcc structure. No obvious particles are recognized in the HIPped Fe–9Cr–0.5%MgAl2O4 alloy [shown in Fig. 11(b)]. Highly magnified image (shown in Fig. 12) was obtained by TEM to characterize the MgAl2O4 nanoscale oxide particles in the HIPped Fe–9Cr–0.5%MgAl2O4 alloy. It can be seen from the graph that the MgAl2O4 nanoscale oxide particles with nearly globular shape are dispersed in the grains of the HIPped Fe–9Cr–0.5%MgAl2O4 alloy.
(a) TEM image of the HIPped alloys of Fe–9Cr–0.5%MgAl2O4 and (b) the corresponding SAED pattern.

Highly magnified TEM image of the HIPped alloys of Fe–9Cr–0.5%MgAl2O4.

IV. CONCLUSIONS
In this work, microstructural evolution of MgAl2O4 ODS alloy was studied at each step of elaboration processes of mechanically milling and subsequent HIP. The following conclusions are reached.
-
(1) Particle size and grain size of the mixed powders decreased. The original MgO and Al2O3 powders are fractured and welded by severe plastic deformation during MM and their long-range order structure is gradually damaged during the process. The dissolution of MgO and Al2O3 powders has occurred after MM for 200 h, and nanometric clusters of Mg, Al, and O are formed.
-
(2) Amorphous phase composed of magnesium, aluminum, and oxygen was observed in the milled powders of Fe–9Cr–1.4%MgO–3.6%Al2O3. There are two main factors resulting in the formation of amorphous phase: large volume fraction of grain boundary and grain boundary energy provided by the decrease of bcc Fe grain size and the increase of interfacial energy due to the decrease of MgO and Al2O3 powder size during MM.
-
(3) The MgAl2O4 nanoscale oxide particles were formed at 1173 K. Microstructure consists of fine grains within nanoscale MgAl2O4 particles was realized after HIP. Ultrafine grains obtained after MM grow and nanoscale oxide particles with nearly globular shape were formed during sintering process.
ACKNOWLEDGMENT
The authors are grateful to the National Natural Science Foundation of China and Shanghai Baosteel Group Company (No. 50834011), the International Thermonuclear Experimental Reactor (ITER) Program Special Project (No. 2014GB125006), and Personnel Research Fund of Three Gorges University (No. KJ2013B001) for grant and financial support.