

1. Introduction
Economic growth and prosperity is a function of both the resources available and the institutions under which these resources are put to productive use. Institutions are the formal and informal rules governing human interactions (see North Reference North1990, Reference North1991). The link between these institutions and economic growth has been recognized since the time of Smith (Reference Smith1976 [Reference Smith1776]), and major theoretical contributions that furthered our knowledge in this area have been advanced by many authors including Hayek (Reference Hayek1944 [Reference Hayek1994], Reference Hayek1945), North (Reference North1990, Reference North1991), Easterly (Reference Easterly2001), Olson (Reference Olson1982), and Baumol (Reference Baumol1990).
Only more recently has this literature expanded into the empirical arena, with a robust modern literature confirming this hypothesis empirically with different institutional measures, including frequently the Economic Freedom of the World (EFW) index by Gwartney et al. (Reference Gwartney, Lawson and Hall2015). Evidence that higher levels of economic freedom lead to a number of improved societal outcomes is now abundant. Footnote 2 For example, higher levels of economic freedom have been shown to lead to higher levels of income, economic growth, entrepreneurship, investment productivity, happiness, and longevity. At the other end of the spectrum, those countries with the worst institutions not only stagnate, but also are often better off stateless or with private governance mechanisms (see Leeson, Reference Leeson2007 and Leeson and Coyne, Reference Leeson and Coyne2012).
Although the literature is clear on the importance of good institutions, we understand little about how and why countries go through transitions from poor institutions to good ones, and vice versa. There has been only sparse and unrelated work on these transitions, leaving a major gap in our understanding of the process of economic and institutional reform.
This paper attempts to contribute to our understanding of these institutional changes by empirically analyzing the dynamic properties present in the EFW data for countries undergoing major transitions. I pose several questions of interest. For example, are there similarities between institutional declines and institutional improvements or are these different processes? Is the process of transition generally a single large, abrupt change or does it occur over a longer time period? Are there particular areas of policy that tend to move first, being ‘leading indicators’ so to speak of institutional change?
My empirical analysis finds that indeed institutional improvements and declines share many similarities, including the policy areas that tend to move first. However, they differ in terms of the time length, with declines happening much more abruptly. Institutional improvements appear to be a process of sustained gradual reforms. In addition, the permanence of the changes does not appear to be systematically related to whether they happened quickly or slowly. I use these empirical regularities to attempt to link together the separate but equally applicable areas of literature on institutional changes including the work regarding the U.S. government growth in the 20th century and the transition process of the post-socialist economies.
2. Literature review
As was mentioned in Section 1, though generations of scholars have contributed to our understanding of what makes for ‘good’ institutions, only recently has this literature expanded into the empirical arena, with a more robust modern literature confirming this hypothesis empirically with different institutional measures. Although some authors have used measures of the colonial or legal origins of countries (see for examples, Acemoglu et al. 2001; Glaeser and Shleifer, Reference Glaeser and Shleifer2002; La Porta et al., Reference La Porta, Lopez-de-Silanes and Shleifer2008; and Robinson et al., Reference Robinson, Acemoglu and Johnson2005), by far the most predominant statistical measure employed in the recent literature is the EFW index by Gwartney et al. (Reference Gwartney, Lawson and Hall2015), which has been published annually since 1996, and contains an index ranking the institutional quality of countries on a 0 to 10 scale. The data span the range of 1970–2013 in the most recent report, at five year intervals from 1970 to 2000, and annually afterward.
Although the literature is clear on the importance of good institutions, we understand little about how and why countries go through transitions from poor institutions to good ones, and vice versa. There is a strand of literature that attempts to explain why some countries have poor institutions, whereas others have good institutions, examining everything from the colonial and legal origins of countries to ethnolinguistic fractionalization, resource endowments, and religious homogeneity.Footnote 3 However, there has been only sparse and unrelated work on the transitions and changes, leaving a major gap in our understanding of the process of economic and institutional reform.
Some studies have examined how foreign aid impacts the institutions of the recipient countries, generally finding that it causes deterioration or no change.Footnote 4 However, changes in foreign aid do not explain any of the major transitions, such as the collapse of socialism in the Soviet Union, the Arab Spring movements, or the socialist swings in Cuba or Venezuela. Quite simply, the foreign aid explanations for institutional change, in practice, probably explain only small downward movements in the institutional quality of already weak nations, and yield little insight into major institutional reforms.
Other studies examine how ‘crisis’-type events tend to lead to expansions in the size and scope of government. With respect to institutional changes that decrease economic freedom, perhaps the largest such literature is the seemingly stand-alone body of research on the transition to growth of the U.S. Federal Government during the early 1900s. After over 100 years of remaining relatively small as a percentage of the economy, both in terms of spending and regulation, the U.S. Federal Government began a transition to rapid growth in many areas of the economy at that time.Footnote 5 Obviously, the economic freedom level of the United States fell significantly from the late 1800s to mid-1900s but this predates measures of economic freedom. Although Anderson and Hill (Reference Anderson and Hill1980) trace the origin to an increase in regulatory power allowed by the courts in the 1877 Munn v. Illinois case; Holcombe (Reference Holcombe1992, Reference Holcombe1999, Reference Holcombe2002) discusses many other factors such as the rise of Union Civil War veterans as an interest group pushing for increased government transfers. Higgs (Reference Higgs1987) attributes the growth to a change in political ideology in the progressive era, and many larger ‘shock’ type events that have created ‘ratchets’ in the size and scope of government (e.g., the Great Depression, World War II, September 11th terrorist attacks). This literature seems to suggest that expansions in the scope of government (i.e., declines in economic freedom) happen quickly and abruptly as the result of single major crisis events or court rulings. Some recent work in this area considers whether financial or inflationary crises result in the initiation of economic reforms with mixed results.Footnote 6 Olson (Reference Olson1982) argued that institutional declines happen through time as interest groups become more entrenched and argued that shocks were one of the few ways to dislodge these entrenched interests. Various other ‘single event’ factors that may (or may not) explain institutional changes are present in the literature, including theories about transformational leaders, political party control changes, expansions in the voting franchise, and military interventions.Footnote 7
There is evidence that institutional reforms do spillover between neighboring countries (see Leeson et al., Reference Leeson, Sobel and Dean2012 and Sobel and Leeson, Reference Sobel, Leeson, Gwartney and Lawson2007), as well as evidence that the EFW institutional measure is non-stationary (i.e., not ‘mean reverting’) suggesting that reforms do indeed have permanent effects rather than decaying away through time (Coyne and Sobel, Reference Coyne, Sobel, Gwartney and Lawson2010; Sobel and Coyne, Reference Sobel and Coyne2011).
Perhaps the largest body of stand-alone literature related to this topic regards the transition process in post-communist countries that emerged in the 1990s after the collapse of the Soviet Union. In most cases, these are performed as case studies and illustrate a deep divide among scholars in that literature about whether the speed or sequence of reforms mattered for the effectiveness of the transition. Although many authors argued for quick ‘shock’ transitions, others argued for a more gradual approach, and despite almost two decades of post-collapse transition data, this debate still persists.Footnote 8
As should be evident from the preceding discussion, there are several strands of literature that have developed independently, with little cohesion or cross-citation. This leaves a lot to be desired in terms of developing a unified understanding of the process of intuitional change and leaves many unanswered questions as to how these processes relate.
3. How big is big?
When one speaks of major institutional changes, this obviously means a degree of reform that is significantly larger than normal policy variation. So what does normal variation look like, and how large do the changes need to be to be significantly different from normal? Figure 1 shows the relative frequency distribution of the annual changes in the EFW, using 16 equal width intervals from the minimum to maximum value of the annual changes. Although the entire dataset goes back to 1970, it is at five year intervals until 2000, so the data depicted are for the annual changes in the chain-linked index for all 123 countries in the data from 2000 to 2013.Footnote 9
Relative frequency distribution of one year changes in economic freedom, 2000–2013.

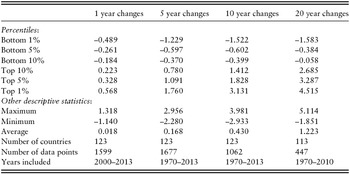
In the figure, the distribution appears very narrow, with over 70% of observations lying in the two (of the 16) groupings closest to the center of the distribution. Although the visual perspective will be highly important for the comparison that follows, the statistics presented at the bottom of the figure are the initial point to discuss. The proper interpretation of these values is as follows: Because the value corresponding to ‘Bottom 1%’ is −0.489, this means that if we pick a random country, in a randomly selected one year interval, the probability that the EFW will show a decline of 0.489 or more is only 1%. Thus, a country declining by a half a point in the index in one year would place it in the 1% lower tail of the distribution. Similarly, an annual increase of 0.568 or greater only happens in 1% of the cases. Thus, based on the numbers shown in the figure, if we use a standard 90% confidence interval around the mean in both directions, a ‘significant’ annual change in economic freedom is a change that is outside of the range −0.261 to 0.328.Footnote 10 Bear in mind that ‘significant’ in this context is not ‘statistically significant’ as the result of a statistical test procedure, but simply out of the ordinary from the large bulk of countries and how they are changing from year to year.
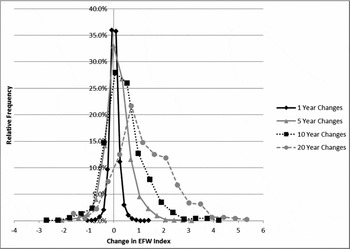
These relative frequency and percentile data, when performed at varying time intervals, yield some interesting insights. Figure 2 shows how the relative frequency distribution changes, as the time length horizon expands, whereas Table 1 shows the percentile data and descriptive statistics for these periods of time.Footnote 11
Relative frequency distributions changes in economic freedom, by period, 2000–2013.

Descriptive statistics for changes in economic freedom by time length

Note: Underlying data is annual beginning in 2000, prior in five year intervals back to 1970.
The most striking aspect of Figure 2 is how the distribution widens as the time interval considered lengthens. Normally, for a ‘mean-reverting’ stationary series, the variation collapses with expanded lengths of time, as random year-to-year fluctuations tend to cancel over longer periods of time. As was supported in Sobel and Coyne (Reference Sobel and Coyne2011), the EFW series is indeed non-stationary and therefore is not-mean reverting. This means changes are more permanent and build upon one another, rather than cancelling out. In other words, the policy reforms stick. This is particularly true of the right tail of the distribution as can be seen in the figure.
The fact that the right tail of the distribution grows through time, whereas the left tail does not is of great importance. It suggests that when there are declines in institutional quality, the full declines happen fairly rapidly to their full extent. We tend not to see the decline process stretch out as long as the process of positive institutional reform. The full extents of institutional improvements appear to take longer to unfold. For example, though we see almost no cases of countries jumping by 2 points in the EFW index in a single year, there are a substantial number of cases of a 2 point increase over longer periods of time as is shown by the growing height of the relative frequency distribution curve at a value of +2.0. At this point, the question of whether increases and decreases follow the same pattern seems to be evidence against it due to the lack of symmetry with which the distribution expands.
Turning to the data shown in Table 1 allows a more precise discussion. Take, for example, the rows showing the percentile cut-off values for the bottom 1% and top 1%. Moving to the right in the columns shows how those values change as the time horizon considered changes. Note that looking across the row for the bottom 1%, there is a little change moving out from the 10 to 20 year periods. Contrast this with the row for the top 1%, in which the values continue to climb by large amounts even between 10 and 20 years. The interpretation is straightforward, the declines that happen, in the abundance of cases, seem to be fully concluded by 10 years after the transition begins, whereas for the improvements in institutional quality, a substantial number of cases continue to climb in the second decade of reform.
The skewness of the distribution also means that what is a ‘big’ or significant change differs for declines and increases in the data. Over 20 year periods, only 1% of cases show declines of more than 1.583, whereas the similar statistic for improvers is 4.515. Thus, a country falling two points in economic freedom over two decades would be rare, whereas a country rising two points in economic freedom over two decades does not even make it into the top 10% tail of the upper distribution (which begins at 2.685). Again, I shall conclude by pointing out the 90% ‘confidence intervals’ that are five year changes outside the range −0.597 to 1.091, 10 year changes outside the range −0.602 to 1.828, and 20 year changes in EFW outside the range −0.384 to 3.287. Countries rising (or falling) by more than these values have experienced what one may consider a ‘significant’ change in institutional quality relative to the other countries of the world.
4. How long does ‘significant institutional change’ take?
The data in the previous section took specific time intervals, and then computed the changes in EFW over those specified intervals. This section basically does the opposite by computing the time lengths for the changes seen in the underlying index data.
The EFW data present some hurdles when considered this way. To capture the time length, it required for a country to ‘reform’ in a positive direction one would in theory find the minimum value prior to the improvement, the ending maximum, and then compute the difference in the year values from the minimum to maximum values of EFW. Although easy in theory, there are the following issues in the practical data: (1) How to handle cases wherein there are multiple years that take on the same minimum (or maximum) value, (2) how to handle cases wherein first year in the data (or last year) are the maximums and minimums such that a full time length for the reform cannot be computed within sample; and (3) how to handle cases wherein a country has two maximums (or minimums) with a minimum (maximum) occurring between them (e.g., V-shaped patterns).
Although there are no perfect solutions, as a first step, the following procedures were used to arrive at a statistically useful sample of countries undergoing transitions: (1) for a county that improves, I employ the most recent year of the EFW minimum (largest year value among minimum EFW years), and the earliest EFW maximum year (smallest year value among maximum EFW years); thus, for example, if a country had EFW values 4, 4, 4, 5, 6, 7, 8, 8, 8, the third year would be used as the year of the minimum, whereas the seventh year would be used as the year of the maximum, so the time length of reform would be year seven minus year three or four years taken to fully reform; (2) for now, I exclude any country whose maximum or minimums occur at the endpoints, because the full time length for the reform cannot be calculated, but I will reintroduce and reconsider the specific countries with ending maximum or minimum in a later section; (3) for now, I proceed by excluding any country that has a minimum value between two maximum values, or vice versa, (e.g., V-shapes) to focus on countries that clearly reformed upward or downward through time.
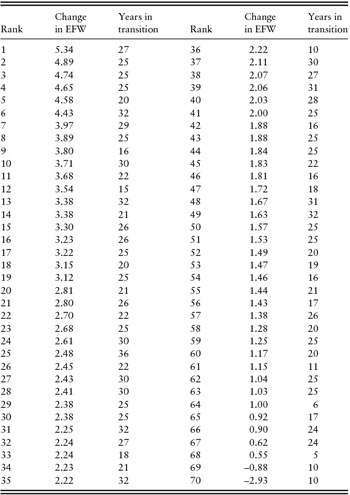
Table 2 shows the results using the beginning useful sample of 70 countries that have transitioned fully from their maximum to minimum EFW values (or vice versa) within the years covered in the EFW index data. Names have been omitted intentionally. Prior literature has treated these changes each like special individual cases. The entire point of the undertaking at hand is to look for systematic patterns in the data that apply across all countries. Examining the first column of Table 2, the largest minimum to maximum positive changes are listed at the top of the column. Strikingly, the years it took to undergo change is surprisingly similar across most of the countries in the top half of the first column of countries. Three of the top five all took 25 years, with the other two narrowly surrounding that value at 20 and 27 years. Looking down the first column, it seems clear that the vast overwhelming majority of upward reformers took somewhere between 20 and 30 years to complete the institutional reform process.
Years in transition from minimum to maximum EFW values (or vice versa)

Note: Maximum possible is 43 years given the length of the data in the EFW index.
At the other end of the list, there are only two countries in this smaller sample of clean data that declined, both taking 10 years. Although one would normally be skeptical of drawing conclusions from only two data points, recall the relative frequency distributions presented earlier that included all data from all countries. Those figures already demonstrated that the process of decline was finalized more rapidly than the process of improvement. There are now several aspects of the EFW data that seem to point to declines occurring more rapidly than upward reforms. It is worthwhile to now revisit the literature with respect to this data-driven conclusion. The ‘crisis’ or ‘ratchet’ theory of single events driving expansions in the size and scope of government seems to be entirely consistent with the data. These would obviously be declines in economic freedom, and if caused by abrupt changes would play out more quickly. Events such as the terrorist attacks of September 11th causing a large abrupt change in airline and other types of security spending and regulations, the 1929 stock market crash (and the one in 2008) leading to large government responses could be examples of this phenomenon. This does not mean that declines in EFW are always caused by shocks or abrupt ratchet type changes, only that these crisis events that result in expansions in government are consistent with this view.
However, this theory seems to not explain movements in the opposite direction (large positive EFW movements) very well. There apparently are no analogous ‘shock’ type events that drive significant and quick reforms in the upward direction. Instead, significant increases in economic freedom seem to be a long-run process of smaller changes that accumulate through time. Creating an environment of enhanced economic freedom seems to be a longer, but effective, battle; destroying an environment of economic freedom seems to be (unfortunately) accomplished more rapidly.
5. Speed of reform versus permanence: does ‘shock’ work as well as ‘gradual’ transitions
As was cited earlier in this paper, what was, and is, a lively and hotly contested debate in post-socialist countries is whether the reforms should be done quickly or slowly. Although those debates focused on those specific set of countries, the data at hand allow an exploration of this at a meta-level across all countries. The question is simple, does the ‘years in transition’ variable from Table 2 correlate with whether the final ending value persisted into the future meaning the reform ‘stuck’.
The difference between the maximum EFW value at the end of transition and the EFW value at the end of the sample (2013) is employed as the measure the amount of ‘erosion’ in the reforms post-transition. More precisely, I compute an ‘erosion’ variable equal to 1 minus the ratio of the ending EFW to the maximum post-transition value. In simpler terms, this number reflects the percent of the maximum EFW score they obtained that decayed away. If gradual reforms, for example, work better than ‘shock’ reforms, then it should be the case that the longer the time of transition, the less erosion that follows subsequently. Figure 3 shows the data for all countries that improved by more than two points in the EFW from Table 2.
Does transition process length matter for permanence?

As is clear in Figure 3, there is no relationship. The degree of erosion does differ across countries, but it neither systematically grows nor shrinks with the duration taken to complete the reform process. At the face value, this implies that shock transitions work equally well as gradual transitions when all countries are considered.
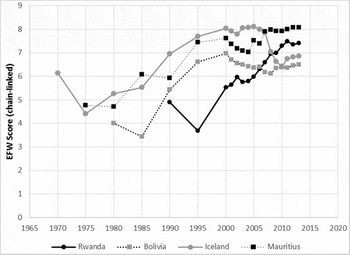
However, given the clear importance of this finding for the large literature on post-socialist transition policy, it is worth showing a few underlying cases. From Table 2, beginning at the top of the left column of countries, of those with the largest positive changes two near the top stick out as doing it faster than the rest. The 9th and 12th data points listed took 16 and 15 years to complete their transitions, whereas other countries in the list that experienced similar changes in EFW took slightly longer than average, the 10th and 13th data points. Thus, though the 9th and 10th data points from Table 2 experienced almost identical changes in EFW, they took drastically different time periods to complete the change, and a similar logic applies for the 12th and 13th data points. Would a comparison of these countries allow additional insights into whether the changes remained in place (or deteriorated), differently for fast versus slow reformers? Figure 4 reveals these countries and their end results as of the most recent 2015 EFW index (which has data up to 2013).
Fast versus gradual transitions: some examples.

First, consider Iceland, the solid line with the circle markers. This country had a minimum to maximum change that began in 1975 from an EFW value of 4.40 to a maximum of 8.11 in 2005. Thus, in Table 2, it was shown to have a 3.71 EFW improvement over a period of 30 years. Since 2005, however, the country has gone backward, with its EFW ending at a value of 6.85 in 2013. In other words, Iceland improved substantially over a long gradual transition, but the reforms have recently decayed, eroding almost half the improvement. However, Mauritius (shown by the dashed black line with the square markers) had a similar improvement, a 3.38 increase in EFW over 32 years, and its reforms have not decayed but have seemingly stuck in place. Thus, for two of the longer gradual transitions, we see one remained, whereas another decayed. A similar split is evident in the two faster reformers, Rwanda and Bolivia. Rwanda (the black solid line with circle markers), experienced a 3.8 improvement in EFW over 16 years, and this reform has seemingly stuck in place, whereas Bolivia underwent a 3.54 improvement in EFW over 15 years that has partially decayed by a point. Again a split, as two faster reforming countries have opposite experiences with permanence. These four cases seem to illustrate firsthand the general finding from Figure 3 that there seems to be little correlation between the time length and durability of the changes. What this implies for the literature is that factors other than time duration must be the primary determinants of whether reforms stick or erode.
6. Simon says: which areas lead and which follow?
I now examine the subareas of the EFW index. In particular, I wish to see if countries that underwent major reforms showed any similarities in terms of which subareas moved first in the process. This could be important information, as it may indicate that if we wish to begin the reform process in a country that a particular set of policies are the first to push or initiate to get the process rolling more broadly.Footnote 12 For those that decline an analogous question would be which areas decline first. If a country wishes to maintain a high level of economic freedom, this knowledge may help to indicate which areas of policy change are most important to prevent as they tend to get larger declines started.
There are five subareas of the EFW index. Area 1 measures the size of government (in terms of government consumption expenditures, transfers and subsidies, taxes, and government-run enterprises); Area 2 measures the legal structure and security of property rights (impartial courts, protection of property rights, contract enforcement, etc.); Area 3 measures access to sound money (inflation and currency control measures); Area 4 measures the freedom to trade internationally (tariff and non-tariff barriers, as well as capital movement controls); and Area 5 measures regulation of credit, labor, and business (interest rate controls, workplace regulations and minimum wages, and ease of doing business measures).
It is actually unfair to ask which area moves as an early warning signal precisely, because the areas are components of the overall index. Movement in any one area will also move the entire index value for the country. Thus, a better measure of leading reform policies is whether the area moved ‘first’ among the five sub-component areas. So for example, if Area 1 begins to trend upward in 1980, while the other areas do not begin their upward trend until a later year, then I consider Area 1 a first mover. If two areas both begin upward earliest, I consider that a tie, and count both.
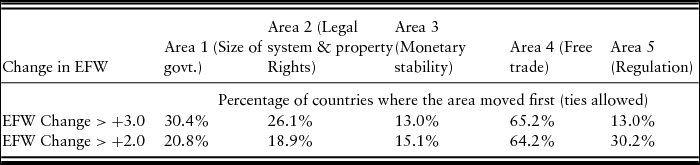
I begin with those countries that moved up in the index by computing the percentage of the cases of upward EFW reform in which that particular sub-area moved first. I do this separately for the countries improving by 3 or more points (23 countries), and also for those moving up by 2 or more points (53 countries). Included here are both countries that completed their transitions within the sample (Table 2), and those that are still rising (that have maximum values at the final year of data) as the length of the reform process is not relevant, only what subareas moved first. The results are presented in Table 3. Because there are ties in the data when two areas move first, the percentages presented in the table can sum to greater than 100%.
First mover analysis of sub-areas: institutional improvements

In roughly two-thirds or more of the cases of large reforms, Area 4 (freedom to trade internationally in capital and goods) seemed to be the clear first mover in cases of institutional reforms toward greater economic freedom. Areas 2 (legal structure and security of property rights) and 1 (size of government) moved early in roughly one-fourth of the cases. On the opposite end of the spectrum, Areas 3 (access to sound money) and 5 (regulation of credit, labor, and business) rarely moved early in the process, tending to lag behind the other areas in the upward process, especially for the larger (>3.0 unit) movements in the index.
Taken at the face value, this suggests that the single most important area of policy to target early to trigger reforms in a country is changing policies regarding restrictions on international trade and capital movements. Constraining the size of government (and/or cutting government spending, taxes, and ownership of enterprises) as well as improving the legal structure and security of property rights comes in as second tier targets in early stages of reform. But the data suggest that widespread EFW reforms generally are not initiated by changes in policies that target monetary stability or reducing government regulations. The idea that free trade can be a precursor to widespread economic reform is also consistent with the view that free trade is a foundational value for a society. In fact, the economists of the enlightenment including Adam Smith argued for free trade and this was a primary first-mover policy argument in the entire classical liberal movement.
The two countries with clear declines in the sample, Venezuela and Zimbabwe, do not present a clear picture with regard to the first mover areas and whether they differ for declining nations. Venezuela was already declining at the start of the index in 1970, as were its Areas 1, 3, and 4. Zimbabwe's Areas 2 and 4 were the two areas that moved first in their process of decline. Area 4 does appear in both cases, however, which is one of the few times of finding a consistency between risers and decliners. However, with such a small sample of decliners, it is difficult to draw any conclusions about them specifically. To the contrary, they also present no evidence conflicting with the conclusion that Area 4 (freedom to trade internationally in capital and goods) is a key first mover in the process of institutional reform.
The above analysis simply asked which area moved first in terms of timing. However, there are other ways to approach this issue of first movers. For example, though a particular area may have moved first, it may not have moved much, and therefore did not contribute much to the overall improvement (or decline). An alternative question would be to ask what areas contributed most to the overall change in EFW and were there particular areas dominant in the early versus late years of the reform process.
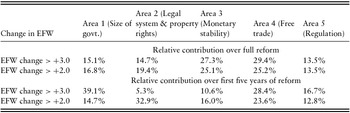
Again, for the big movers, those moving by more than 2 or 3 points in the index, I estimate the percentage of the overall EFW improvement that is attributable to the changes in each subarea. I then repeat the calculation for only the first five years of the overall institutional improvement. By comparing these numbers, we can see that what areas drive overall reforms and what areas tend to matter most at the beginning. The results are presented in Table 4.
Percentage contribution of sub-areas to overall reform: institutional improvements

In Table 4, we see that for those countries improving by more than 3 points in the EFW, the single largest area contributing to the reforms is Area 4, free trade, which accounts for 29.4% of the entire EFW change for the average country in this group. Similarly for the larger group of countries improving by 2 or more points, Area 4 free trade also is the largest contributor at 25.2%. The area contributing the second most heavily over the entire sample is Area 3, monetary stability. However, when one examines the next rows in the table, showing the percentages only for the first five years of reform, the picture changes slightly. Although free trade is still a major contributor (28.4% and 23.6%), Areas 1 (size of government) and 2 (legal system and property rights) seem to play a major role. Interestingly, Area 1, size of government, is the largest contributor in the case of countries moving by more than 3 points, although it is way down the list even for the first five years once you move to all countries improving by 2 or more points. Similarly, Area 2 legal system and property rights appear to have a sizeable impact during the initial years for countries rising by more than 2 points, but not those who move more than 3 points. In summary, what the table seems to suggest is that improvements in Area 4, free trade, are critical to reforms and are again an important first mover area. Areas 1 (size of government) and 2 (legal system and property rights) are the two other areas important to monitor in the early stages of major institutional change.
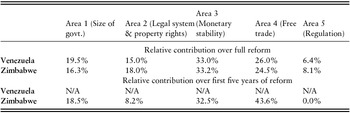
I now examine the two countries suffering the largest declines in EFW, Venezuela and Zimbabwe, shown in Table 5. For these two countries, over the full period, worsening monetary stability and free trade were the dominant areas over the entire period. Because Venezuela was already moving in a downward direction prior to the first year of data, I cannot compute what occurred in the first five years for Venezuela. But for Zimbabwe, Area 4, free trade was the first mover. This again suggests a striking similarity with countries that improved, an early strong change in international free trade policies. For Zimbabwe, Area 3 (sound money) also seems to be more important in contributing to the overall decline. As prior literature has argued, sometimes financial or fiscal crisis are factors that cause dramatic declines in government policy and high rates of inflation. These data are consistent with the literature.
Percentage contribution of sub-areas to overall reform: institutional decliners

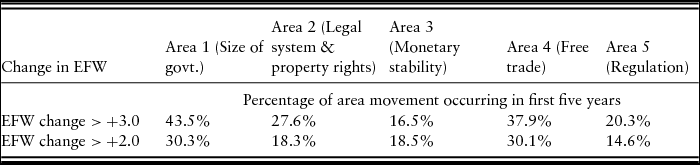
A final method of approaching this question is to compute for each area, what percentage of the improvement in that specific area occurred within the first five years of reform (versus what percent of the change in the area that happened in the remainder of the reform years). These data are given in Table 6.
Percentage of reforms in first five years by area: institutional improvements

This final approach to looking at the issue of areas that lead the reform process seeks to understand what percentage improvements in each area occur early and late in the reform process. According to Table 6, for example, for countries rising 3 or more points in EFW, of the total movement in the Area 1 score, 43.5% of the Area 1 improvement occurs in the first five years (implying that the remaining 56.5% occurs in the rest of the later reform period). The two areas whose movements seem to be the most heavily weighted toward the early years are again Area 4 free trade and Area 1 the size of government.
7. A closer examination of free trade policy
Focusing on trade liberalization as a first step in promoting reform seems like a promising conclusion driven by this data analysis. In virtually every way of analyzing the data, this one area (Area 4) dominates the discussion. It is the single area contributing most to the overall changes, and the clear robust first mover across measures, both for countries improving and those declining. This section takes a closer look at this area both in theory and in the data. But prior to discussing these issues, it is important to note that this area of the EFW index contains several variables on which it is based. The area includes measures of tariff rates and revenue, non-tariff trade barriers (e.g., quotas), currency controls (measured by black market exchange rates), freedom of foreigners to visit, capital controls, and restrictions on foreign investment and ownership.
A focus on trade policy as a first step has theoretical merit from the previous literature on institutional reform. In particular, Christopher Coyne's Reference Coyne2008 book After War: The Political Economy of Exporting Democracy examines cases of targeted military interventions in nations that have been undertaken in the name of ‘nation building’ to improve institutions. His book concludes that these have generally been failures and argues that the best strategy is to promote a policy of free trade with these nations instead. Similarly, Leeson et al. (Reference Leeson, Sobel and Dean2012) and Sobel and Leeson (Reference Sobel, Leeson, Gwartney and Lawson2007) explore how institutional improvements spread between nations using spatial econometric modeling, and obviously one key factor in the linkages between these countries that ‘catch’ better institutions from each other is their linkage in trade volume. However, what appears to be important is not just opening domestic trade toward these nations, but getting them to open their policies in return (as in a trade agreement). The implications for the current situation with Cuba are clear. Negotiating free trade policies that cause improvements in Cuba's trade openness may well be the best first target in attempting to promote larger and broader economic and institutional reforms in that country. Given the data for this area include restrictions on foreign ownership and investment, and freedom of travel, both of which are problem areas for Cuba, these seem to be logical first steps in any trade negotiations aimed at long run reform in that country.
At the risk of pushing this conclusion too far, but with the reward of possibly linking two strands of literature, it is worthwhile to discuss how the timing of restrictions on international trade correlated with the clear decline in what would have been the measured EFW index score for the United States in the early 1900s. As discussed earlier, scholars differentially have attributed this to a variety of factors, such as an 1877 court ruling, successful interest group evolution in the 1890s, the ‘Progressive Era’ ideology evolving from the 1890s to 1920s, the ratchet/crisis response to the 1920 stock market crash, the 1933–38 enactment of New Deal programs, and the expanded government control and onset of income tax withholding during World War II. Arguably, if the EFW was measured, then the largest changes would have occurred under the New Deal from 1933 to 38 caused by the higher levels of government spending and greater regulatory controls on banking and labor. However, one of the often-blamed factors for the severity of the Great Depression that preceded the onset of New Deal programs caused by this ‘crisis’ induced ratchet in the size and scope of government was the Smoot-Hawley Tariff Act of June 17, 1930 that raised tariffs by more than 50% on approximately 3200 imported products (to the highest levels in the U.S. history).Footnote 13 This would have caused a decline in Area 4 of the index in 1930 that preceded the declines in the size of government (Area 1) and increased regulation (Area 5) during the 1933–38 New Deal period. Thus, had economic freedom been measured then, Area 4, restrictions on free trade, may have very well moved first for the United States in the process of the institutional erosion in economic freedom that occurred in the early 20th century. Although most authors point to other factors, and an earlier gradual start, clearly the measured decline in the U.S. economic freedom during the New Deal would have been correlated with a preceding change in trade policy. This correlation with the Smoot–Hawley Tariff Act is perhaps a fruitful avenue of research that could meld two islands of research on institutional change in the literature.Footnote 14
Also interestingly, one area of concern is the recent decline in the economic freedom in the United States. After maintaining a rank of third in the index for years, the United States fell fairly dramatically into the teens in the EFW rankings, experiencing a decline of almost 1 point in the chain-lined EFW score between 2000 and 2011. Figure 5 shows the EFW overall score, along with the two sub-areas of the index that moved first with the overall decline, Areas 2 and 4.
First mover areas in the recent EFW decline for the United States.

Consistent with what we have found, in general, Area 4 (freedom to trade internationally in capital and goods) and Area 2 (legal structure and security of property rights) were the two first movers in the recent decline in EFW for the United States. The U.S. trade policy moved away from free trade through increases in tariffs that were sometimes large, such as the tariffs on Chinese steel and tires. Quite ironically, these are the same two areas that were first movers in Zimbabwe's EFW decline as well. Although these are anecdotal conjectures, they do appear to be consistent with the idea that expanding or adopting restrictions on free trade tend to be precursor events for larger changes to come in institutional quality. It is also suggestive that future research will be better able to integrate these separate strands of research on institutional decline and transitions.
8. Are the post-socialist transition economies special cases?
Up to this point, I have treated all countries the same, data are data. For a country moving from an EFW of 4–7, a change of 3 units is examined similarly to one moving from 6 to 9. However, on early drafts of this paper, a common comment was that these countries are somehow different. They are, after all, moving from socialism to capitalism, not just changing their level of capitalism. Also, given the stand-alone nature of the transition literature and my desire to move toward an integration of these various areas of literature, it is worth examining this question in more detail.
The most common list of such countries includes Estonia, Latvia, Lithuania, Poland, Czech Republic, Slovak Republic, Hungary, Romania, Bulgaria, and Slovenia. All 10 of these countries are covered in the EFW data, although with differing first years of coverage. The earliest coverage begins for Hungary in 1980, with Bulgaria, Poland, and Romania joining in 1985, and the remainder in 1995. In this section, I simply ask, do the general conclusions found earlier across all countries still hold up when examining only the transition economies.
First, let us consider the question of the speed of reforms versus their permanence, the topic of the ‘shock’ vs. gradual transition arguments prevalent in the literature on these countries. Figure 6 shows the overall EFW scores for all 10 countries. Obviously, there is no way in black-and-white print to have 10 different lines labeled so they are discernable. However, this is part of the point, if we examine them as a group, what do we see?
The post-socialist transition economies.

One of the most striking features of the graph is that though the countries varied substantially in terms of how quickly their upward reforms began, and how long they took, all of them ended up within a very narrow band at the end ranging from 6.43 to 7.59. Slovenia is the lowest at the end of the sample, the clear single line trending down in the final few years of data. For the other nine, the band is even narrower with a range of only 7.17–7.59. Obviously, the differences in the processes yielded very similar long run outcomes. Two countries show significant decay of their advancements, Slovenia and Estonia, who have both fallen from their maximum scores. But again there appears to be no clear link between speed of transition and erosion. Slovenia had rapid improvements, but decayed, whereas Estonia's reform took longer and decayed. Similarly, Romania started slow, rose quickly, and shows no decay, whereas Hungary followed a longer process and shows no decay. Just as with the evidence from all countries, there is no clear link between speed of reform and permanence in these data – they are the same as other countries who reformed by similar magnitudes.
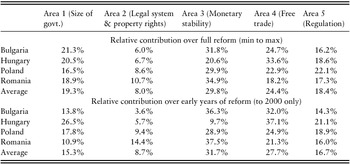
I now turn to the question of which areas move first, or account for the largest percent of the overall EFW movement. Again, what is important is whether these countries are different or similar from the entire sample shown earlier. Table 7 shows the data.
Percentage contribution of sub-areas to overall reform: post-socialist countries

Because the question is one of early movers, I here show the data for the only four countries whose data pre-dates 1995, and thus we have data on the early years. However, even using all of them, the results are similar. Again, just like for the overall sample, Area 3 (monetary stability) and Area 4 (free trade) carry most of the weight of the reform over the full sample and are the early movers as well. Quite simply, there is nothing here to discuss that is different from the overall sample. I find no evidence that these countries are somehow different in their data. The dynamics of their EFW changes is not significantly different from the dynamics experienced by other countries. Or more bluntly, there is no reason the transition economy literature cannot be intertwined with the other literature on institutional declines and institutional improvements. Integrating these various areas of the literature may indeed help make major advances toward our understanding of the process of institutional change more generally.
9. Conclusion
Broad and significant changes in country institutions and policies can, and do, happen. Despite knowing the clear importance of these changes for prosperity and well-being, there is a relatively sparse literature on this process other than several unrelated pockets of research in isolation regarding specific issues such as post-socialist transition economies, or the growth of the U.S. government in the 20th century. There is a little understanding of whether the process of institutional decline is similar or different to the process of institutional improvement, the timing and duration of such changes and the areas of policy that tend to move first. This paper attempts to uncover empirical regularities in the major institutional changes that have occurred in countries between 1970 and 2013 using the data from the 2015 EFW index.
The data points to several conclusions that may help to advance the future research in this area. First, there is clear evidence that institutional declines happen more rapidly and abruptly than institutional improvements. Although significant improvements in institutional quality generally unfold over periods of roughly 25 years, significant deteriorations are mostly complete within 10 year periods. This suggests that the driving forces may be different. It is supportive of a Higgs (Reference Higgs1987) type ‘crisis’ or ‘ratchet’ theory of government growth in both size and scope (which implies a decline in economic freedom). The process of positive institutional reform, however, is alternatively a continuous process of smaller improvements over a longer period of time. Similar to how small differences in economic growth rates can produce large differences in prosperity over longer time intervals, the key is sustained positive institutional reforms over time. Despite the apparent visibility of single transformative events such as the fall of the Berlin Wall, the Soviet Union, and the Arab Spring movements, true significant increases in institutional quality seem to be accomplished over longer timespans.
Second, there seems to be no evidence that the speed of the reform matters in terms of its durability. Despite the ongoing debate in the post-socialist transition literature on the relative merits of ‘shock’ versus ‘gradual’ policy reforms, the data do not point to a clear conclusion when we examine all the countries of the world who have experienced major institutional changes. Some countries that have improved rapidly have sustained, whereas others have not. Similarly, some that improved more slowly sustained, whereas others have not. In a broader cross section, there is no correlation between the durability of the change and the time length of the process. There is simply no conclusive evidence that either approach is better from a meta-analysis of the data.
Finally, government policies related to the freedom to trade internationally in capital and goods seem to be the clearest and most robust ‘first mover’ in cases of significant institutional reform, both upward and downward. It is also the largest contributor to the magnitude of the overall ending reform. This is consistent with the arguments made by Coyne (Reference Coyne2008), Leeson et al. (Reference Leeson, Sobel and Dean2012), and Sobel and Leeson (Reference Sobel, Leeson, Gwartney and Lawson2007) regarding the role of free trade in initiating and spreading positive institutional reform, as well as the correlation present in the Smoot–Hawley Tariff Act preceding the onset of the New Deal programs in the United States during the early 20th century (and the more recent decline in the U.S. institutional rank over the past two decades). Policies related to the legal structure and security of property rights and the size of government are the second most frequent early moving areas and thus early reforms (either upward or downward) in these areas need to be closely monitored as early indicators of transitions. On the opposite end of the spectrum, monetary policy and regulatory policy rarely move early in the process, tending to lag behind the other areas especially for the cases of larger institutional reforms. However, there is some evidence that over the entire period of reform, monetary stability is one of the largest areas contributing to institutional change. One implication for current policy is that negotiating for more trade openness with Cuba, for example by easing restrictions on foreign investment and ownership and travel restrictions, is indeed a worthwhile first step if the desire is to initiate a long-term process of positive institutional improvement in that country.