INTRODUCTION
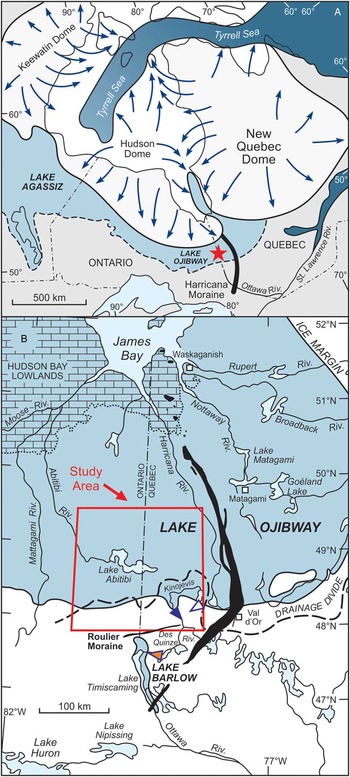
The decay of the Laurentide Ice Sheet (LIS) during the last deglaciation led to large-scale releases of meltwater that accumulated over the isostatically-depressed terrain of the Canadian prairie in the west and the James Bay basin in the east, resulting in the formation of Lake Agassiz and Lake Ojibway, respectively (Fig. 1A; Teller, Reference Teller1987). These ice-dammed lakes evolved independently until the final stages of deglaciation, when continued ice retreat presumably allowed their coalescence and gave rise to the so-called Lake Agassiz-Ojibway (Elson, Reference Elson1967; Dyke and Prest, Reference Dyke and Prest1987; Leverington et al., Reference Leverington, Mann and Teller2002; Teller et al., Reference Teller, Leverington and Mann2002; Dyke, Reference Dyke2004). Interest in the final stages of Lake Agassiz-Ojibway comes from its abrupt drainage into a climatically key region of the North Atlantic Ocean where the sudden and massive injection of meltwater likely slowed the meridional overturning circulation and triggered a major short-lived cold pulse around 8.2 ka (Alley et al., Reference Alley, Mayewski, Sowers, Stuiver, Taylor and Clark1997; Grafenstein et al., Reference Grafenstein, Erlenkeuser, Müller, Jouzel and Johnsen1998; Barber et al., Reference Barber, Dyke, Hillaire-Marcel, Jennings, Andrews, Kerwin and Bilodeau1999; Kleiven et al., Reference Kleiven, Kissel, Laj, Ninnemann, Richter and Cortijo2008). Assessing the impact of this freshwater forcing and the resulting feedbacks in the Earth’s climate system requires reliable estimates of the meltwater volumes involved in the drainage, as well as geochronological constraints on this lake discharge. However, geomorphological (shoreline) records constraining the changes in areal extent and depth of Lake Agassiz and Lake Ojibway during their late stages – including their northward expansion and subsequent confluence – are relatively rare and remain inadequately documented. The timing (and number) of the inferred lake stages is also still largely unconstrained due to the physiographic setting of these basins that does not favour the use of radiocarbon (14C) dating or other geochronological methods (e.g., Thorleifson, Reference Thorleifson1996; Dyke, Reference Dyke2004).
(A) Schematic extent of Lake Agassiz and Lake Ojibway in the context of the Laurentide Ice Sheet at ~8.5 cal yr BP (Dyke et al., Reference Dyke, Moore and Robertson2003; Dyke, Reference Dyke2004); location of the study area (red star). (B) Study area and main physiographic features of the Ojibway basin in Ontario and Quebec. Note that the red box covers the area shown in Fig. 3. Triangles show the location of the outlet system related to the main stages of Lake Ojibway (orange, Angliers; blue, early Kinojévis; white, late Kinojévis; after Vincent and Hardy, Reference Vincent and Hardy1979). (For interpretations of the references to color in this figure legend, the reader is referred to the web version of this article.)

The history of these glacial lakes is documented from complex sequences of raised shorelines and associated geomorphic features that record fluctuations in lake levels, which occurred in association with changes in basin configuration that were largely controlled by the position and dynamics of the retreating ice margin (Upham, Reference Upham1895; Johnston, Reference Johnston1946; Elson, Reference Elson1967; Vincent and Hardy, Reference Vincent and Hardy1979; Teller and Thorleifson, Reference Teller and Thorleifson1983; Smith and Fisher, Reference Smith and Fisher1993; Breckenridge, 2015; Veillette, Reference Veillette1994; Thorleifson, Reference Thorleifson1996; Teller and Leverington, Reference Teller and Leverington2004; Lewis et al., Reference Lewis, Blasco and Gareau2005; Fisher et al., Reference Fisher, Waterson, Lowell and Hajdas2009). Reconstructions of Lake Agassiz regroup the different lake levels reported into five main phases, the last of which comprises the coalescence and drainage of Lake Agassiz and Lake Ojibway (e.g., Thorleifson, Reference Thorleifson1996; Teller and Leverington, Reference Teller and Leverington2004). This last phase (named Ojibway), however, involves correlation of lake levels that are separated by several hundreds of kilometres and that are based on shoreline records that are, for the most part, still inadequately constrained due to their sporadic occurrence and scattered distribution across remote and forested northern regions.
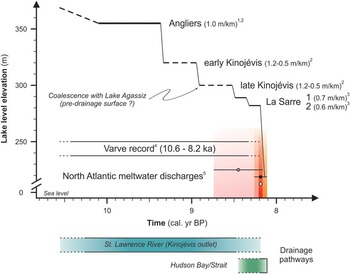
Our current comprehension of the final stages of Lakes Agassiz and Ojibway comes from the eastern (Ojibway) basin (Fig. 1B), where raised shorelines were used to define three lake stages (Fig. 2; Hughes, Reference Hughes1955; Vincent and Hardy, Reference Vincent and Hardy1979; Veillette, Reference Veillette1983; Reference Veillette1988; Reference Veillette1994). The Angliers lake stage represents the highest and best-defined lake level documented (Veillette, Reference Veillette1994), while the lower elevation early and late Kinojévis lake stages were defined by a lesser number of shorelines (Vincent and Hardy, Reference Vincent and Hardy1979), which introduces substantial uncertainties on the configuration (elevation, extent) of the associated water planes and regional isobases. Nevertheless, in the absence of a better-defined lake-level record, reconstructions have associated the lowest lake level – the late Kinojévis lake stage – with the time interval preceding the final drainage of the coalesced Lake Agassiz-Ojibway (c.f., at ~8.2 ka) (e.g., Leverington et al., Reference Leverington, Mann and Teller2002; Teller et al., Reference Teller, Leverington and Mann2002; Teller and Leverington, Reference Teller and Leverington2004). However, the recent recognition of well-defined shorelines standing below the late Kinojévis lake level raises new questions about the timing of lake-level changes in the Ojibway basin (Roy et al., Reference Roy, Veillette, Daubois and Ménard2015). The newly documented lake levels indicate the occurrence of additional (late) stages that point to a lake configuration characterized by a lower surface-elevation and restricted areal extent, which, in turn, has important implications for the reconstructions of the volumes of meltwater discharges of the late deglacial interval. Overall, these different lake-level reconstructions emphasize the importance of having reliable geochronological constraints on the sequence of shorelines in order to properly place the associated lake levels and their attendant meltwater volumes into the chronological framework of the last deglaciation.
Schematic representation of the main lake levels reported in the Lake Ojibway basin, with the corresponding uplift gradients (data sources: 1-Veillette, Reference Veillette1994; 2-Vincent and Hardy, Reference Vincent and Hardy1979; 3-Roy et al., Reference Roy, Dell’Oste, Veillette, de Vernal, Hélie and Parent2011). Full and dotted horizontal lines represent well- and poorly-defined lake levels, respectively. The timing and duration of each lake level is unknown; elevations are approximate and based on a crude projection of these lake levels in the southern Lake Abitibi region. Time span for the lake comes from a varve chronology (4-Antevs, 1955; Breckenridge et al., Reference Breckenridge, Lowell, Stroup and Evans2012), while its termination is given by the chronology of meltwater discharges associated with the final lake drainage (5-Jennings et al., Reference Jennings, Andrews, Pearce, Wilson and Ólfasdótttir2015). Shaded areas correspond to calibrated ages reported for the lake drainage (with 1-sigma error bars); pink is from marine sediment cores (Barber et al., Reference Barber, Dyke, Hillaire-Marcel, Jennings, Andrews, Kerwin and Bilodeau1999); orange is from continental sediment sequences (Roy et al., Reference Roy, Dell’Oste, Veillette, de Vernal, Hélie and Parent2011). Red bar corresponds to the 8.2 ka event documented in the Greenland ice-core records (Rasmussen et al., Reference Rasmussen, Andersen, Svensson, Steffensen, Vinther, Clausen, Siggaard‐Andersen, Johnsen, Larsen and Dahl‐Jensen2006). The lower rectangles show proposed drainage pathways for meltwater overflow/discharges for the lake. (For interpretations of the references to color in this figure legend, the reader is referred to the web version of this article.)

Here we apply 10Be surface exposure dating to erosional shorelines associated with the Angliers lake stage in the Ojibway basin in order to evaluate whether this method can be used to date former lake levels and gain insights on the timing of the main stages of Lake Ojibway during the late deglaciation. The novel approach developed here has the potential to bring new (and direct) geochronological constraints on the complex sequences of raised shorelines forming glacial lake reconstructions and their attendant estimates of meltwater volumes, a set of constraints that is critically needed to assess the role of meltwater discharges in the late deglacial climate interval.
HISTORY OF LAKE OJIBWAY STAGES
Lake Ojibway developed due to the accumulation of meltwater between the height of land formed by the Hudson Bay-St. Lawrence River drainage divide to the south and the ice margin to the north (Coleman, Reference Coleman1909); progressive retreat caused the lake to expand and form a large meltwater reservoir (Fig. 1A; Leverington et al., Reference Leverington, Mann and Teller2002; Dyke, Reference Dyke2004). Lake Ojibway was initially connected for a brief interval with glacial Lake Barlow, which had previously invaded the upper Ottawa River valley to the south of the divide (Vincent and Hardy, Reference Vincent and Hardy1979; Veillette, Reference Veillette1994). Temporal reconstructions of the Ojibway submergence, and the attendant positions of the retreating ice-margin, are mainly based on minimum-limiting 14C ages obtained from the first organic matter accumulated in small lakes present on high ground that rose above the former lake limit. Such sites are relatively scattered and not abundant, in addition to being located for the most part at the periphery (south) of the basin (Veillette, Reference Veillette1988; Richard et al., Reference Richard, Veillette and Larouche1989). Sedimentary archives relating directly to Lake Ojibway are largely deprived of organic matter suitable for 14C dating, and if present, the material is often prone to contamination by old carbon sources (Veillette, Reference Veillette1988; Stroup et al., Reference Stroup, Lowell and Breckenridge2013; Daubois et al., Reference Daubois, Roy, Veillette and Ménard2014). The time span of Lake Ojibway is currently constrained by a varve chronology (Antevs, Reference Antevs1925; Hughes, Reference Hughes1965; Hardy, Reference Hardy1976; Breckenridge et al., Reference Breckenridge, Lowell, Stroup and Evans2012) and 14C ages from continental sediment sequences and marine and lake sediment cores (Veillette, Reference Veillette1988; Lewis and Anderson, Reference Lewis and Anderson1989; Richard et al., Reference Richard, Veillette and Larouche1989; Barber et al., Reference Barber, Dyke, Hillaire-Marcel, Jennings, Andrews, Kerwin and Bilodeau1999; Ellison et al., Reference Ellison, Chapman and Hall2006; Hillaire-Marcel et al., Reference Hillaire-Marcel, de Vernal and Piper2007; Kleiven et al., Reference Kleiven, Kissel, Laj, Ninnemann, Richter and Cortijo2008). Together, these studies indicate that the glaciolacustrine episode lasted for about 2100 years (varve record), being bracketed between 10,570 and 8200–8150 cal yr BP, where the timing of the lake termination may vary depending on the chronology used for the meltwater outburst(s) associated with the final drainage of Lake Agassiz-Ojibway into Hudson Bay (Fig. 2) (e.g., Jennings et al., Reference Jennings, Andrews, Pearce, Wilson and Ólfasdótttir2015).
For most of Lake Ojibway’s existence, including its confluence with Lake Agassiz, meltwater overflow was controlled by a single outlet system located in the southern Ojibway basin (Fig. 1B). The elevation and position of a rocky sill forming this outlet varied through time due to the on-going glacial isostatic adjustment of the land, and complex changes in outlet configuration apparently played a strong role in the development of lake levels in the Ojibway basin (Vincent and Hardy, Reference Vincent and Hardy1979). The Ojibway lake-level history has long been articulated around three lake stages that are attributed to periods of maximum submergence (Fig. 2; Vincent and Hardy, Reference Vincent and Hardy1979; Veillette, Reference Veillette1994). The Angliers stage, presumably the oldest, was controlled by an outlet standing at 260 m near the Des Quinze River, while the early and late Kinojévis stages are associated with the Kinojévis River outlet standing at 275 m and 300 m, respectively (Fig. 1B). The Kinojévis stages, however, are based on the correlation of relatively few shorelines that are spread across a large area and were primarily defined to outline the trend of shoreline development within the basin (Vincent and Hardy, Reference Vincent and Hardy1979, p.14).
In spite of these uncertainties, regional isobases originally defined in the southern Lake Agassiz basin were subsequently modified and tentatively expanded at the scale of the entire Agassiz-Ojibway basin in paleogeographic reconstructions (Thorleifson, Reference Thorleifson1996). This approach led to the correlation of the Ponton lake level in the west with the late Kinojévis lake level in the east (Vincent and Hardy, Reference Vincent and Hardy1979), thereby giving rise to the confluence of Lake Agassiz and Lake Ojibway (Thorleifson, Reference Thorleifson1996). This connection, although probable, is not supported by firm geomorphological data, but rather inferred by paleoecological data (Stewart and Lindsey, Reference Stewart and Lindsey1983), an early varve chronology (Satterly, Reference Satterly1937; Elson, Reference Elson1967), and by ice margin histories that are broadly constrained for the time interval involved (c.f., Dyke, Reference Dyke2004). Nevertheless, extensive mapping in the Ojibway basin outlined several geological considerations and predictable relationships arguing for the existence of a stable water plane before the demise of the ice dam in Hudson Bay, which implied a pre-drainage lake surface controlled by an outlet standing at an elevation of ~300 m (Veillette, Reference Veillette1994), thus comparable to the one ascribed to the late Kinojévis stage in an earlier lake-level reconstruction (Vincent and Hardy, Reference Vincent and Hardy1979).
However, the recent documentation in the lowest parts of the Ojibway basin of post-late Kinojévis shorelines (Roy et al., Reference Roy, Veillette, Daubois and Ménard2015) provides evidence for significant changes in the configuration of the lake before its final drainage. These late-stage shorelines form two closely related lake levels projecting below the elevation of the main (Kinojévis) outlet (Fig. 2). These lake levels may be equivalent to similar low-elevation shorelines in the Agassiz basin (the Fidler beaches) that also lie below the Kinojévis outlet (Dredge, Reference Dredge1983; Klassen, Reference Klassen1983). The Fidler lake level is poorly understood and has been interpreted as evidence for a two-step drainage of Lake Agassiz-Ojibway involving separate (but closely spaced) discharges from the eastern (Ojibway) and western (Agassiz) basins (Thorleifson, Reference Thorleifson1996; Leverington et al., Reference Leverington, Mann and Teller2002; Teller et al., Reference Teller, Leverington and Mann2002). An alternative interpretation associates the low-elevation strandlines with subglacial drainage(s) across the ice dam in Hudson Bay (Klassen, Reference Klassen1983; Shoemaker, Reference Shoemaker1992), a mechanism that is now supported by glaciological modeling (Clarke et al., Reference Clarke, Leverington, Teller and Dyke2004) and geological data (Roy et al., Reference Roy, Dell’Oste, Veillette, de Vernal, Hélie and Parent2011). Regardless of their origin, the presence of the newly defined (low-elevation) shorelines in the Ojibway basin implies substantial changes in the areal extent and depth of the lake across the entire Agassiz-Ojibway basin near the end of the deglaciation, with water planes potentially lying up to 10 to 17 m below the late Kinojévis lake level. Unlike previous models articulated around a single drawdown from a fairly elevated lake surface, these results argue for multi-step lake drainage involving lower lake levels (and thus smaller meltwater volumes). Although these results point to a complex history that is more compatible with marine records showing several outbursts of meltwater during the late deglacial interval (e.g., Jennings et al., Reference Jennings, Andrews, Pearce, Wilson and Ólfasdótttir2015), the lack of geochronological constraints on the shoreline sequence defining these lake levels prevent the assignment of the associated lake stages with specific intervals of the late deglaciation.
GEOMORPHIC SETTING OF OJIBWAY SHORELINES
Reconstruction of Ojibway lake stages is complicated by the physiography of this basin, which forms a large clay plain averaging 310–320 m in elevation (e.g., Roy et al., Reference Roy, Veillette, Daubois and Ménard2015). This terrain is broken in places by topographic rises that lie, for the most part, below the maximum reported lake level (i.e., 460 m near Goéland Lake, ~250 km northeast from the study area) (Fig. 1B; Veillette, Reference Veillette1994), thus leaving very few bedrock-core hills to record the development of high- and intermediate-elevation lake levels. For this reason, Ojibway lake stages were identified using the elevation of dispersed shorelines throughout the basin, in addition to ice-front reconstructions providing insights on the northern limit of the lake (e.g., Veillette, Reference Veillette1994).
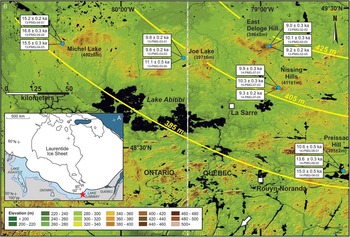
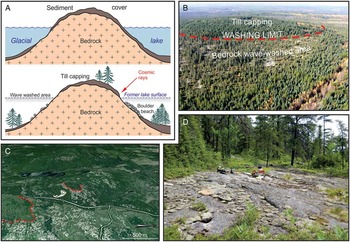
All shorelines targeted in this study come from the Angliers lake level (Figs. 2, 3A), which was primarily documented from distinct erosional shorelines that are commonly present on bedrock knobs (hills) standing above the clay plain (Fig. 3B; Veillette, Reference Veillette1994). During the lake inundation, these hills stood out as isolated islands where the littoral (wave) erosion caused the removal of the glacial sediment cover from the hill flanks, leaving narrow and sub-horizontal rims of bare bedrock that mark the former stable lake surface (Fig. 4, Supplementary Fig. 1). Extensive photogrammetric measurements of these so-called washing limits yielded a statistically significant large set of elevation data points that outlined a slightly tilted water plane, thereby constraining broad regional isobases (Veillette, Reference Veillette1994). This setting allows the sampling of this lake level with a high degree of confidence, while the bedrock forming these erosional shorelines is ideally suited for the application of 10Be surface exposure dating.
(A) Location of the study area (red star) with respect to Lakes Agassiz and Ojibway and the Laurentide Ice Sheet margin at ~9.5 cal ka BP (Dyke et al., Reference Dyke, Moore and Robertson2003; Dyke, Reference Dyke2004). (B) Digital elevation model showing the physiography of the study area. The low-lying areas (green colors) correspond to the flat-lying Ojibway clay plain, which is broken in places by hills (brown colors) where raised erosional shorelines of the Angliers lake level developed. Yellow lines show the isobases associated with the inclined water plane formed by the Angliers lake level (Veillette, Reference Veillette1994). White boxes show 10Be ages and sample numbers (see Fig. 5, Table 1, and Supplementary Table 1 for details). The high-rise terrains to the south of Lake Abitibi mark the continental drainage divide that encompasses the Kinojévis River outlet system. The outlet at the time of the Angliers lake stage was located ~40 km to the south of the river identified by the white arrow (see Fig. 1 for location). (For interpretations of the references to color in this figure legend, the reader is referred to the web version of this article.)

(color online) (A) Schematic model showing the development of lakeshore erosional shorelines known as washing limits (see text for details). (B) Photograph of Michel Lake site showing an oblique aerial view of wave-washed bedrock rim (treeless areas with whitish colors) formed by the lakeshore erosion. Note the presence of a capping of untouched sediments that marks the upper limit reached by the wave erosion. (C) Google Earth satellite image of the washing limit exposed at the Nissing Hills site. (D) Example of a bedrock surface sampled for 10Be surface exposure dating (Nissing Hills; rock saw width is 75 cm). Pictures of the three other sites sampled are showed in Supplementary Figure 1.

METHODS
We applied cosmogenic 10Be dating to raised erosional shorelines belonging to the Angliers lake stage. The premise behind our approach is that, once the sediment has been removed by lakeshore erosion and the lake surface has dropped in response to a partial or complete drawdown, the newly uncovered (wave-washed) bedrock surface becomes exposed to cosmic rays, starting the cosmogenic 10Be accumulation clock. As shown in Figure 4A, boulder beaches may be present in places in the basin, but these are primarily composed of small rounded boulders (25–40 cm in diameter) forming unstable surfaces, thereby precluding their use for 10Be surface exposure dating. The erosional shorelines were sampled at 5 sites along the 405 m isobase to ensure the dating of the same (Angliers) lake surface. This particular isobase has the advantage to intersect several prominent hills within a reasonably restricted area (Fig. 3B). The sites were chosen by means of aerial photographs and satellite imagery (Google Earth and ArcGIS 10.3) to favor settings characterized by sparse vegetation and a good exposure to the elements (wind). These sites were underlain by granitic or tonalitic lithologies rich in quartz, with slightly inclined and largely unweathered bedrock surfaces (Supplementary Fig. 2–6). Most rock surfaces exhibited a well-preserved glacial polish, with striations and grooves still present, thereby indicating negligible erosion of the bedrock surfaces by the lakeshore processes. Lakeshore erosion was apparently limited to the removal of the sediment cover and did not affect the underlying bedrock.
Specifically, three samples of surface rock averaging 500 g were collected at each site; the samples being separated by 10 to 15 m from each other along a given contour line (i.e., within the same elevation range). The samples were processed following standard procedures developed at the Lamont-Doherty Earth Observatory Cosmogenic Dating Laboratory (c.f., Schaefer et al., Reference Schaefer, Denton, Kaplan, Putnam, Finkel, Barrell and Andersen2009) and 10Be/9Be ratios were determined at Lawrence Livermore National Laboratory (California, USA). Ages were calculated with version 2.2 of the CRONUS Earth online calculator, using the Baffin Bay/Arctic 10Be production rate given in Young et al. (Reference Young, Schaefer, Briner and Goehring2013), which is similar in value to the North America production rate of Balco et al. (Reference Balco, Briner, Finkel, Rayburn, Ridge and Schaefer2009), and altitude and latitude scaling according to Lal (Reference Lal1991) and Stone (Reference Stone2000), referred to as “Lm” scaling (Balco et al., Reference Balco, Stone, Lifton and Dunai2008). 10Be ages for individual sample are given within 1-sigma analytical errors (Supplementary Table 1). The exposure ages for the raised shorelines were calculated using the arithmetic mean of the individual samples from this landform. The error of the exposure age for this landform includes the standard deviation of this arithmetic mean and the error of the production rate given by Young et al. (Reference Young, Schaefer, Briner and Goehring2013).
RESULTS
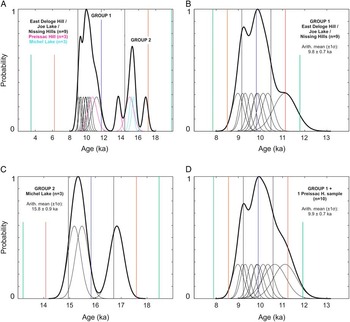
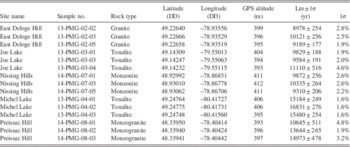
The 10Be ages show analytical uncertainties of typically 2–3% (only two samples yielded a >4% 1-sigma error) (Table 1). Total 10Be blank corrections were below 5000 atoms, boron corrections were below 0.5%, thus the total background corrections for the samples (300,000–1,500,000 atoms 10Be total) were smaller than 2%. With the exception of one site (Preissac Hill), the 10Be concentrations of the samples dated within each washing limit (i.e., at each site) show a remarkable internal consistency (Supplementary Table 1). When plotted together, the 15 samples dated show a distribution of 10Be ages falling into two groups (Fig. 5A). The first group is formed by samples from three sites (Joe Lake, Nissing Hills, and East Deloge Hill; n=9) showing ages ranging from ~9000 to 10,300 yr, with one sample being slightly older (11,100±500 yr) (Fig. 5B). At each of these three sites, the scatter of ages varies between ~1000 and 1500 yr (Table 1). The second group is represented by one site (Michel Lake; n=3) where ages range from ~15,200 to 16,800 yr (Fig. 5C), for an age spread of ~1600yr (Table 1). Finally, one last site (Preissac Hill; n=3) shows a distinctively larger age scatter (4300 yr), with ages of 10,600±500yr, 13,600±300yr, and 15,000±500yr (Fig. 5A, Table 1).
Probability density functions (PDF) plots for 10Be surface exposure ages and associated uncertainties (68%, 1-sigma confidence interval in black; 2-sigma confidence interval in red; and 3-sigma confidence interval in green). The blue vertical line denotes the arithmetic mean value of the age population; thin curves represent individual ages within 1-sigma uncertainties (see Table 1 and Supplementary Table 1 for data). (A) Distributions of all 15 ages obtained from 5 sites in this study. Note that the two oldest ages from Preissac Hill are considered as outliers (see text for details). (B) PDF for the ages forming Group 1 seen in (A). (C) PDF for the older ages forming Group 2. (D) PDF for the population of younger ages composed by the samples forming Group 1 and the younger age obtained at Preissac Hill. We used the arithmetic mean age (blue line) of this PDF as the formation age of the Angliers lake level. Reported errors for these ages are calculated by quadratic propagation of the standard deviation of the respective arithmetic mean and the production rate error given by Young et al. (Reference Young, Schaefer, Briner and Goehring2013). (For interpretation of the references to color in this figure legend, the reader is referred to the web version of this article.)

Samples information and surface exposure ages.

The main group of ages ranging from ~9000 to 11,100yr is consistent with previous time span estimates presented for Lake Ojibway, which range from ~10,600 and 8,200 cal yr BP according to varve and marine sediment records (e.g., Breckenridge et al., Reference Breckenridge, Lowell, Stroup and Evans2012; Jennings et al., Reference Jennings, Andrews, Pearce, Wilson and Ólfasdótttir2015). Conversely, the older ages forming the second group, which range between ~15,200 to 16,800yr, are incompatible with the history of Lake Ojibway and are difficult to reconcile with our current understanding of the regional deglaciation.
The large scatter of 10Be ages documented at Preissac Hill seems to underlie a complication with the application of surface exposure dating at this site. This age scatter may be explained by a slight but measureable inheritance of cosmogenic isotopes from previous exposure, which has not been entirely removed by the subsequent glacial erosion of the bedrock surfaces dated. Within this context, the youngest 10Be age at Preissac Hill could possibly provide a minimum-limiting age constraint on the timing of the rock surface exposure at this site during the deglaciation, and, in turn, on the formation of the Angliers shoreline. The youngest age of 10,600±500yr at Preissac Hill is indeed consistent with the 9 other 10Be ages obtained for Group 1 (Fig. 5A). Therefore, we include this sample into the calculation of the mean age for the younger group of ages (9900±700yr) (Fig. 5D). The remaining two 10Be ages at Preissac Hill are considered too old to relate to the regional deglaciation. Accordingly, these two samples are excluded from the data set and considered as outliers.
The old 10Be ages obtained at Michel Lake are also likely related to an inherited 10Be signal (and insufficient glacial erosion). However, because these three 10Be ages show a relatively good internal consistency, we cannot exclude that the apparent mean age of ~15,800yr±900yr may record another geomorphological feature reflecting a slightly earlier deglaciation process in the region. An alternative interpretation for this second group is discussed below within the framework of the last deglaciation.
DISCUSSION
The 9.9 ka ages and the chronology of lake levels
The well-defined group of ages centered at 9.9±0.7 ka (Fig. 5D) is consistent with the fact that the sampled shorelines belong to the same lake level, as shown by their elevation range (393–412 m) that roughly falls onto the 405 m isobase of this former water plane (Fig. 3B). Previous studies broadly assigned the Angliers lake stage to the onset of the regional deglaciation based on paleogeographic considerations articulated around 14C ages coming from outside the Ojibway basin (Vincent and Hardy, Reference Vincent and Hardy1979; Veillette, Reference Veillette1994). Current reconstructions place the beginning of ice retreat and the concomitant glaciolacustrine inundation in the study area at ~10.2 cal ka BP (i.e., 9.0 14C ka in Dyke et al., Reference Dyke, Moore and Robertson2003; Dyke, Reference Dyke2004). The 10Be age thus indicates that the high-elevation Angliers lake level developed during the early stages of the Ojibway invasion, which appears to have occurred rapidly after the withdrawal of the ice margin in the region. Considering the difficulties in identifying the position of the ice margin within the Ojibway basin during the deglaciation and the concomitant lack of chronological constraints on the continent-scale ice-margin histories, these results also yield important data for the deglacial chronology (Dyke, Reference Dyke2004). These 10Be ages provide a minimum-age constraint on ice withdrawal within the basin, which until now has relied on minimum-limiting 14C ages from lake sediment cores that typically document the disappearance of the lake and/or onset of post-glacial sedimentation. These 14C chronologies are also prone to centuries-scale lags with respect to the disappearance of ice (e.g., Ullman et al., Reference Ullman, Carlson, Hostetler, Clark, Cuzzone, Milne, Winsor and Caffee2016).
These 10Be ages bring the first direct constraints on the timing of lake-surface elevation changes in the Ojibway basin. Prior to this study, the overall lack of geochronological data on the three high-elevation lake levels had so far forced glacial lake reconstructions to rely on a chronology based on the above paleogeographic reconstructions, as well as on the assumption that the last (and lowest) lake level that was then defined in the Ojibway basin – the late Kinojévis lake stage – formed the lake surface that preceded the drainage of the coalesced Lake Agassiz-Ojibway, which took place ~8.2 ka (Barber et al., Reference Barber, Dyke, Hillaire-Marcel, Jennings, Andrews, Kerwin and Bilodeau1999; Roy et al., Reference Roy, Dell’Oste, Veillette, de Vernal, Hélie and Parent2011; Jennings et al., Reference Jennings, Andrews, Pearce, Wilson and Ólfasdótttir2015). The mean 10Be age of 9.9±0.7 ka obtained on the Angliers lake level now places an upper age limit on these three closely related Ojibway lake stages. Accordingly, if the assignment of the late Kinojévis lake level to the 8.2 ka time interval of the deglaciation is correct, this would indicate that Lake Ojibway experienced only two lake-level drops over a period of about 1700yr, which represents about three quarters of the lake’s existence. This apparent stable lake configuration seems rather improbable given the overall rapid ice retreat (450 m/yr) of the LIS margin in the region (Veillette, Reference Veillette1994) that likely caused the opening of lower outlets, as well as the occurrence of late-glacial readvances of the ice margin into the lake (Vincent and Hardy, Reference Vincent and Hardy1979) that may have produced additional lake-level fluctuations during that time interval. More importantly, the recent documentation of well-defined low-elevation shorelines forming water planes projecting below the Kinojévis outlet in the Ojibway basin (Roy et al., Reference Roy, Veillette, Daubois and Ménard2015) adds to similar findings in the Agassiz basin (Dredge, Reference Dredge1983; Klassen, Reference Klassen1983), which together argue for the existence of significant lake level(s) post-dating the late Kinojévis lake stage. Altogether, this situation could be improved by applying 10Be surface exposure dating to key shoreline sequences, which could potentially refine correlations of lake levels and the chronology of the attendant glacial lake reconstructions.
The 16 ka ages and the regional deglaciation
Current understanding of the deglaciation suggests that the mean age of 15.8±0.9 ka obtained at Michel Lake (Fig. 5C) is too old to be related to Lake Ojibway, whose initial formation is ascribed to ~10,600 cal yr BP by a varve chronology (Antevs, Reference Antevs1925; Breckenridge et al., Reference Breckenridge, Lowell, Stroup and Evans2012). Furthermore, paleogeographic reconstructions indicate that the area was still covered by ice at that time, with the southern LIS margin located into the Great Lakes basin (~700 km from the study area) at ~16 cal ka BP (c.f., the 13 14C ka time slice in Dyke et al., Reference Dyke, Moore and Robertson2003; Dyke, Reference Dyke2004). These data are consistent with the interpretation attributing these older 10Be ages to the inheritance of cosmogenic isotopes from previous exposure due to limited glacial erosion of the bedrock surfaces (washing limits) dated, a phenomenon commonly encountered in glaciated terrains (e.g., Stroeven et al., Reference Stroeven, Fabel, Harbor, Hättestrand and Kleman2002; Harbor et al., Reference Harbor, Stroeven, Fabel, Clarhäll, Kleman, Li, Elmore and Fink2006), and evidenced here by the large scatter of 10Be ages at Preissac Hill. As for the intensity of glacial erosion with respect to former ice-flow movements (Veillette et al., Reference Veillette, Dyke and Roy1999; Veillette et al., Reference Veillette, Roy, Paulen, Ménard and St-Jacques2017), our results do not show a clear trend between the occurrence of old ages and the position of a sample site on the bedrock topographic high versus the orientation of the main ice flows. Although Preissac Hill is located in a down-ice (sheltered) position from the dominant ice flows, the sites of Joe Lake and Nissing Hills were sampled in a similar setting and yielded a tight cluster of young ages. Furthermore, the washing limits of Michel Lake and East Deloge sites were both sampled on the up-ice (stoss) side of topographic highs and should thus have been subjected to severe glacial erosion; yet, they revealed contrasting results (Table 1). Consequently, the intensity of glacial erosion seems to be site-specific and is likely dependent on a combination of local macro- and micro-topographical features influencing the degree of abrasion and plucking in the subglacial processes.
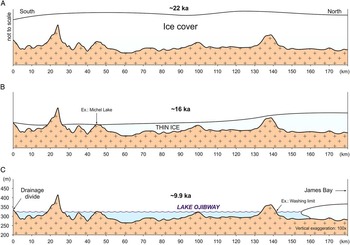
An alternative explanation could be related to the fact that the sites sampled are located on the highest topographic rises in the region (Fig. 3B). At about 16 ka (∼13 14C ka), the deglaciation was well underway and the latitudinal retreat of the LIS southern ice margin was apparently accompanied by a significant increase in surface melting (Carlson et al., Reference Carlson, Anslow, Obbink, LeGrande, Ullman and Licciardi2009; Ullman et al., Reference Ullman, Carlson, Anslow, LeGrande and Licciardi2015) consistent with marked changes in global ice volumes and sea level across this interval (e.g., Tarasov and Peltier, Reference Tarasov and Peltier2004; Lambeck et al., Reference Lambeck, Rouby, Purcell, Sun and Sambridge2014). If so, significant thinning of this sector of the ice sheet could have caused these hills to emerge (break) at the ice surface as “nunataks,” and then be exposed to cosmic rays early in the deglaciation (see model in Fig. 6). Comparable deglaciation processes have been documented in Fennoscandia, Greenland, and Antarctica (Brook et al., Reference Brook, Nesje, Lehman, Raisbeck and Yiou1996; Stone et al., Reference Stone, Balco, Sugden, Caffee, Sass, Cowdery and Siddoway2003; Rinterknecht et al., Reference Rinterknecht, Clark, Raisbeck, Yiou, Brook, Tschudi and Lunkka2004; Goehring et al., Reference Goehring, Brook, Linge, Raisbeck and Yiou2008). Yet, topographic rises in the study area show a relatively small elevation difference (~80–120 m) with respect to the lower clay plain, indicating that the ice cover had to be very thin to allow these moderate hills to break through the ice surface. Such an ice margin configuration appears incompatible with an active ice retreat and the damming of a large lake, and remains largely unsupported by available field evidence, geomorphological data, and existing ice retreat patterns. Furthermore, this thinning mechanism would also require the absence of a sediment cover on the hills dated (or a very thin one) in order to have a significant exposure of the bedrock surface and allow the onset of the 10Be clock. However, the geomorphological setting at the site of Michel Lake shows about the same sediment cover as the other sites dated.
(color online) Schematic model showing the deglacial thinning mechanism considered as an explanation for the small group of 10Be ages centered at ~16 ka. (A) Cross section depicting the ice cover during the full glacial conditions (ice thickness not to scale, unlike the underlying topography). (B) As the deglaciation proceeds, significant ice-mass loss is thought to occur through surface melting, causing the high-elevation terrains to be exposed to subareal conditions and cosmic rays. (C) Submersion by meltwater as the ice margin retreats north of the continental drainage divide. Several geological considerations indicate that this model cannot be retained (see Discussion for details).

Consequently, based on these arguments, we believe that the ~16 ka ages obtained at Michel Lake are best explained by a slight inherited 10Be signal related to insufficient glacial erosion of the bedrock surfaces dated. This small cluster of older 10Be ages thus calls for further investigations involving additional surface exposure dating of important topographic hills in the region, as the existing set of 10Be ages cannot entirely resolve this issue.
CONCLUSIONS
The application of 10Be surface exposure dating to raised shorelines marking a major stage of Lake Ojibway provides the first direct geochronological constraints on the glaciolacustrine episode and the associated history of lake-level changes in the north-central region of the LIS during the last deglaciation. The 10Be ages indicate that the Angliers lake level formed at around 9.9±0.7 ka, thus assigning the development of this high-elevation lake stage to the early part of the history of Lake Ojibway. This study also adds new data to deglacial chronologies documenting the recession of the ice margin across the Ojibway basin (c.f., Dyke, Reference Dyke2004), whereby the results provide minimum-limiting ages on the onset of ice withdrawal in this large region, which otherwise is difficult to constrain due to the overall lack of ice-margin features and the scarcity of material for 14C dating.
These results bring important constraints on the timing of lake-surface elevation changes associated with the three high-elevation lake levels in the Ojibway basin, in which the lowest lake level has long been associated with the drainage of Lake Agassiz-Ojibway. The 10Be ages obtained for the uppermost (Angliers) lake level tend to place this sequence to the early segments of the lake history and, combined with evidence for low-elevation lake levels in both Agassiz and Ojibway basins (Klassen, Reference Klassen1983; Roy et al., Reference Roy, Veillette, Daubois and Ménard2015), argue for a lake configuration involving a substantially less extensive and lower lake surface than the one presented in previous reconstructions for the late stages of the deglaciation. Accordingly, these results motivate further investigations focussing on the 10Be dating of key shoreline sequences that will facilitate correlations of lake levels and improve the overall chronology of the final stages of these glacial lakes.
This study demonstrates that 10Be surface exposure dating of raised shorelines represents an important step towards improving temporal reconstructions of glacial lakes. The approach outlined here could potentially be applied to other important ice-dammed lakes that formed and drained during the LIS deglaciation. Obtaining new chronological constraints on shorelines associated with particular lake stages and/or lake-level drawdowns could lead to more robust estimates of meltwater volumes for specific time intervals of the last deglaciation, thereby refining fundamental input data for ocean models that assess the impact of freshwater discharges on the North Atlantic thermohaline circulation and Earth’s climate (e.g., Bauer et al., Reference Bauer, Ganopolski and Montoya2004; Renssen et al., Reference Renssen, Goosse and Fichefet2007; Böning et al., Reference Böning, Behrens, Biastoch, Getzlaff and Bamber2016).
ACKNOWLEDGMENTS
This research was supported by a NSERC grant to MR and a FRQNT PhD fellowship to PMG. JMS and MR acknowledge support by the LDEO Climate Center. I. Randour contributed to fieldwork and M. Laithier provided assistance in the production of figures. Constructive comments and suggestions from journal Senior Editor N. Lancaster, Associate Editor T. Lowell and two anonymous reviewers were greatly appreciated and contributed to improve the manuscript.
SUPPLEMENTARY MATERIAL
To view supplementary material for this article, please visit https://doi.org/10.1017/qua.2017.40