Implications
Grazing may increase feed self-sufficiency in dairy goat production systems. Pasture may have a good nutritional value, but the milk yield of goats is largely affected by grazing management. This study provides new guidelines on nutrition and behaviour of grazing dairy goats according to pasture allowance that may help farmers to better manage their grazing systems under temperate conditions.
Introduction
Grazing management – including grazing pressure, stocking rate, pasture allowance and post-grazing sward height – has an important impact on ruminant intake or milk yield (Penning et al., Reference Penning, Hooper and Treacher1986; Poppi et al., Reference Poppi, Hughes, L’Huillier and Nicol1987; Bonanno et al., Reference Bonanno, Di Grigoli, Alicata, Tornambè, Avondo, Pagano, Giambalvo, Stringi and Di Miceli2007a). Under strip-grazing systems, daily pasture allowance (PA) is defined as the product of pre-grazing pasture mass by offered area per animal per day (PA, kg of DM/day). Pasture allowance has been shown to be a good predictor of the pasture intake (PI) in grazing dairy cows (Pérez-Prieto and Delagarde, Reference Pérez-Prieto and Delagarde2013) or in sheep (Penning et al., Reference Penning, Hooper and Treacher1986). However, no intake response to PA is available in the literature for grazing dairy goats. Recently, an experiment showed that the milk yield of Alpine dairy goats increases curvilinearly with increasing PA within a range of 1.6 to 3.0 kg DM/day offered at 4 cm above ground level (Charpentier and Delagarde, Reference Charpentier and Delagarde2018). Furthermore, most studies on the effect of grazing severity on grazing goats have been carried out on meat goats under continuous grazing management, through variations of stocking rate. Stocking rate is defined as the number of animals per unit area for a specific amount of time (Bonanno et al., Reference Bonanno, Di Grigoli, Alicata, Tornambè, Avondo, Pagano, Giambalvo, Stringi and Di Miceli2007a). Unfortunately, it does not take account of pre-grazing pasture characteristics nor of pasture growth rate. In goats, as in other ruminants, increasing stocking rate is known to negatively affect PI and milk yield (Bonanno et al., Reference Bonanno, Di Grigoli, Alicata, Tornambè, Avondo, Pagano, Giambalvo, Stringi and Di Miceli2007a), kids’ daily weight gain (Animut et al., Reference Animut, Goetsch, Aiken, Puchala, Detweiler, Krehbiel, Merkel, Sahlu, Dawson, Johnson and Gipson2005a; Beker et al., Reference Beker, Gipson, Puchala, Askar, Tesfai, Detweiler, Asmare and Goetsch2009; Celaya et al., Reference Celaya, Moreno-Gonzalo, López López, Ferreira, García, Ferre and Osoro2016) and diet selection behaviour (Animut et al., Reference Animut, Goetsch, Aiken, Puchala, Detweiler, Krehbiel, Merkel, Sahlu, Dawson, Johnson and Gipson2005a). Both PA and stocking rate are indicative of grazing conditions and severity, but dairy goat responses to PA under strip-grazing management cannot be predicted from continuous grazing experiments, as the variables predicting intake are different (Delagarde et al., Reference Delagarde, Valk, Mayne, Rook, Gonzàlez-Rodríguez, Baratte, Faverdin and Peyraud2011).
The aim of this study was to determine the effect of PA on the PI, milk yield and grazing behaviour of dairy goats under strip-grazing management on temperate multispecies swards in spring.
Material and methods
This experiment was carried out in spring from 13 May to 24 June 2016, at the Institut national de la recherche agronomique (INRA) experimental dairy farm in Méjusseaume (1.71°W, 48.11°N, Le Rheu, Brittany, France).
Treatments and experimental design
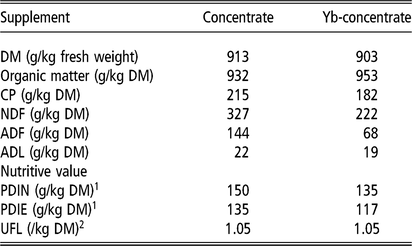
Three levels of PA were compared: 1.6, 2.4 and 3.2 kg DM/day determined at 4 cm above ground level (namely Low, Medium and High, respectively). These PA levels were chosen to test the adaptability of goats to restrictions in PA. It was considered that goats in High, receiving an amount of pasture 1.5 times greater than their pasture voluntary intake, were fed ad libitum (INRA, 2010). The experiment was a 3 × 3 Latin square design replicated six times, over three successive 14-day periods. The succession of treatments was opposite in three of these Latin squares compared to the three other ones, in order to balance the global experimental design for possible carry-over effects of treatments. In each period, days 1 to 7 constituted the adaptation period and days 8 to 14 constituted the measurement period. In all treatments, goats had access to pasture 11 h/day over two sessions, 7.5 h between AM and PM milkings (from 0830 to 1600 h) and 3.5 h after the PM milking (from 1730 to 2100 h). Goats were milked twice daily at 0700 h and 1615 h. Goats were penned indoors and grouped per treatment on deep litter at night. Each goat received 536 g DM/day of a commercial concentrate (Table 1), fed twice daily at milking times (2 × 268 g DM) through an automatic feeder, with no forage supplementation. The concentrate consisted of the following ingredients on a dry matter basis: barley, 28%; sugar beet pulp, 24%; soya bean meal, 23%; lucerne, 11.5%; wheat bran, 6%; molasses, 3%; linseed, 2%; vegetable oils, 1%; sodium chloride, 0.5%.

Goats
Thirty-six multiparous Alpine goats in mid-lactation were selected for the experiment. Their average kidding date was 10 February 2016. Goats were fed ad libitum with grass hay plus concentrate from kidding until turn-out to pasture, on 7 March 2016. In March and early April, goats had access to pasture 8 h/day, received 536 g DM/day of concentrate and 370 g DM/day of dehydrated lucerne. After a week of transition, a reference period was carried out from 30 April to 6 May in which all 36 goats grazed together during 11 h/day and individually received 536 g DM of concentrate and no more dehydrated lucerne. Six groups of six goats were then balanced according to their individual lactation number (3.9 ± 1.6 lactations), stage of lactation (89 ± 5.6 days in milk), milk yield (3.7 ± 0.6 kg/day), milk fat concentration (33.6 ± 3.4 g/kg), milk protein concentration (29.7 ± 2.5 g/kg) and BW (54.6 ± 6.2 kg). Differences between groups did not exceed 5% for any of these variables. Goats continued grazing together until 12 May and then were separated into treatments on the morning of 13 May.
Pasture and grazing management
The pasture used for the present experiment was sown in 2011 with a mixture of perennial ryegrass (Lolium perenne L. cv Tryskal, 10 kg/ha), tall fescue (Festuca arundinacea Schreb cv Callina, 10 kg/ha), white clover (Trifolium repens L. cv Trissid, 3 kg/ha), chicory (Cichorium intybus L. cv Puna, 1 kg/ha) and rhizobia-inoculated lucerne (Medicago sativa L. cv Prunelle, 10 kg/ha). The pasture was divided into four paddocks and strip-grazed in early spring by goats. During the trial, each paddock was divided into three sub-paddocks by electric fences with widths proportional to PA, and grazed successively. All groups grazed in adjacent sub-paddocks, working in a strip-grazing system with the front fence moved daily. The back fence was moved only twice per week; that is, goats had also access to the area grazed during the previous days for increasing available area for walking and lying. The area allocated daily to each treatment was calculated from a daily estimate of pre-grazing pasture mass by multiplying the daily pre-grazing sward height by the sward bulk density (see the Feed and pasture measurements section). Water was available at pasture and indoors, and salt blocks were only available indoors at night.
Feed and pasture measurements
The dry matter concentration of concentrates was determined daily from days 11 to 14 of each experimental period, on a 100 g subsample.
On days 1, 6 and 11 of each period, on each treatment, two pasture strips of 0.5 × 5 m were cut at 4 cm (compressed height) above ground level with a motor-scythe, ahead the front fence, in the area to be grazed in the next two days. Pasture harvested in each strip was weighed, and pasture DM concentration was determined on a representative 500 g subsample, to calculate pasture mass on a DM basis. Pre-cut and post-cut sward heights were measured 10 times on each cut strip with a rising platemeter (30 × 30 cm, 4.5 kg/m², Aurea Agrosciences, Blanquefort, France) to calculate the compressed depth of cutting. The sward bulk density (kg DM/ha/cm) was calculated by dividing the pasture mass by the compressed depth of cutting.
The chemical composition of the offered pasture was determined on another 500 g subsample collected on days 6 and 11 in each cut strip, washed to eliminate soil residuals and bulked per treatment and per period after drying.
The botanical composition of the offered pasture was determined on day 8, from handfuls of pasture (minimum 1 kg per treatment) cut with scissors above approximately 4 cm to ground level, randomly selected in the area to be grazed in the next 6 days. Samples were manually sorted into six classes: grasses, clovers, chicory, dandelion, lucerne and other species, then dried and weighed to calculate the proportion of each class on a dry matter basis.
The chemical composition of apparently selected pasture was determined on samples collected on days 11 to 14, every morning before grazing. Handfuls of pasture (minimum 500 g per treatment) were cut with scissors to the height of the previous days’ grazing. Samples were oven-dried and bulked per period and per treatment before chemical analyses.
Pre- and post-grazing pasture heights were determined each morning from 30 random measurements per treatment with a rising platemeter, on the strip open for grazing the next day and on the strip open for grazing the day before, respectively. Pre-grazing extended tiller height and extended sheath height were measured with a ruler on days 11 and 13 on 50 longest tillers of randomly selected ryegrass plants per treatment, ahead the front fence. Post-grazing extended tiller height and extended sheath height were measured on 100 randomly selected ryegrass tillers per treatment, on days 12 and 14, on the strip open for grazing the day before. Pre- and post-grazing lamina lengths were calculated using the difference between tiller height and sheath height. The post-grazing proportion of lamina-free tillers was calculated as the proportion of tillers whose main lamina was totally defoliated.
On days 12 and 14, before the post-grazing extended tiller measurement, the area of trampled pasture was estimated. A 0.1-m² quadrat was thrown at random 20 times in each treatment, and the area of trampled pasture within the quadrat was recorded and given a grade from 0 to 5 (0=no area trampled; 5=all the area trampled). The sum of all grades in a treatment gave the percentage of the area of pasture trampled (maximum 100%).
Animal measurements
Milk yield and body weight
Milk yield was measured individually at each milking. Milk fat and protein concentrations were determined at each milking from days 11 to 14 by mid infra-red spectrophotometry (Milkoscan, Foss Electric, Hillerød, Denmark). The BW was recorded on the last day of each period after the AM milking.
Intake and energy balance
The individual PI was determined during the last 5 days of each period from the daily faecal output and diet OM digestibility according to the indirect two-step calculation of the ytterbium oxide (Yb)/faecal index method (Pérez-Ramírez et al., Reference Pérez-Ramírez, Peyraud and Delagarde2012). Daily faecal output was estimated by diluting the Yb incorporated in a pelleted Yb-concentrate. The pelleted Yb-concentrate consisted of the following ingredients on a fresh matter basis: wheat, 35%; wheat bran, 29.5%; soya bean meal, 16%; maize, 15%; molasses, 4%; Yb, 0.5%. Throughout the experiment, each goat received 15.0 g (± 0.1 g) of the Yb-concentrate after each milking (i.e. 0.13 g/day of Yb). During the last 7 days of each period, the straw litter was covered by wood chips to prevent straw intake by goats. Faeces were rectally sampled from the PM milking on day 10 to the AM milking on day 15, after each milking. This means 10 collection periods in five days, suitable to have a good representativeness of the average marker faecal concentration when measured by total faecal collection, as shown in cattle (Delagarde et al., Reference Delagarde, Pérez-Ramírez and Peyraud2010). An average of 25 g of fresh faeces per goat was collected each time. Faeces per goat and per period were then stored at +4°C before oven-drying and chemical analyses. Then, PI was calculated according to equation (1) (Pérez-Ramírez et al., Reference Pérez-Ramírez, Peyraud and Delagarde2012) that describes the generic relationship between intake, faecal output and digestibility in ruminants.
 $$ {\rm{PI = }}{{\rm{1}} \over {{\rm{O}}{{\rm{M}}_{\rm{P}}}}}{\rm{ \times }}\left( {{{{{{{\rm{D}}_{{\rm{yb}}}}} \over {{{\rm{F}}_{{\rm{yb}}}}}}} \over {\left( {{\rm{1{-}OM}}{{\rm{D}}_{\rm{D}}}} \right)}} - {\rm{OM}}{{\rm{I}}_{\rm{C}}}} \right) $$(1)
where PI represents the daily PI (kg DM/day); OMP represents the selected pasture OM concentration (g/kg DM); Dyb represents the daily dose of Yb (mg Yb/day); Fyb represents the faecal Yb concentration (mg/ kg OM); OMIC represents the OM intake from concentrates (kg OM/day) and OMDD represents OM digestibility of the diet, calculated from equation (2):
 $$ {\rm{OM}}{{\rm{D}}_{\rm{D}}}{\rm{ = 0}}{\rm{.922}} - {{{\rm{0}}{\rm{.0175}}} \over {{{\rm{F}}_{{\rm{CP}}}}}} - {\rm{0}}{\rm{.445 \times F}}_{{\rm{ADF}}}^2 $$(2)
(n=41, R²=0.82, RSD=0.017)
where FCP represents the faecal CP concentration (g/g OM) and FADF represents the faecal ADF concentration (g/g OM).
This equation, suitable for lactating goats fed on fresh pasture and concentrates, was obtained from a series of five indoor experiments carried out between autumn 2015 and spring 2017 (Charpentier et al., Reference Charpentier, Mendowski and Delagarde2017). In these experiments, goats were fed a large range of diet quality, diet composition and intake levels, mimicking what could happen under grazing conditions. The intake of each feed and faecal output by total collection were precisely measured during five consecutive days at the end of each experimental period.
Individual energy (in Unité Fourragère Lait, UFL = 7.12 MJ of net energy) and metabolisable protein (in Protein Digestible in the Intestine, PDI) balances were calculated according to INRA (2010) criteria and expressed as proportions of requirements covered by supplies. The UFL and PDI requirements for maintenance and milk yield were calculated using BW and 3.5% fat corrected milk (FCM) yield (INRA, 2010). The UFL and PDI supplies were calculated using PI and concentrate intake, and based on their respective concentrations in UFL and PDI. Nutritive values (UFL and PDI) of pre-grazing and selected pasture were calculated using their chemical composition according to INRA (2010). The reduction of the net energy value of the diet compared to the net energy values of the individual feeds, related to high feeding level and digestive interactions between pasture and concentrates, was considered in the calculation as described by INRA (2010).
Blood metabolites
Blood glucose, urea and NEFA (non-esterified fatty acids) concentrations were evaluated on the morning of day 15, after weighing. A blood sample was collected by jugular venipuncture into evacuated collection tubes containing lithium heparin. After centrifugation (2000×g at 4°C for 15 min), the plasma was stored at –20°C.
Grazing behaviour
Grazing activities were determined using the Kenz Lifecorder Plus Device (LCP, Suzuken Co. Ltd, Nagoya, Japan) placed in a waterproof box under the goat’s neck. This device makes it possible to record grazing time and grazing activity pattern with good accuracy on dairy cows (Delagarde and Lamberton, Reference Delagarde and Lamberton2015) and dairy goats (Delagarde et al., Reference Delagarde, Piriou and Charpentier2018). Briefly, the acceleration of the goat’s head associated with grazing activity is processed as an activity level on a scale of 0 to 9 at 4 s intervals. The average of these recorded values is saved every 2 min. As the activity level is close to zero while goats are engaged in activities other than grazing, including rumination, grazing activity was simply defined as an activity level greater than 0.5. More details on the use of Lifecorder Plus in grazing dairy goats are given in Charpentier and Delagarde (Reference Charpentier and Delagarde2018). Grazing time was recorded from days 7 to 14, with at least three or four recording days per goat. As only 21 devices were available, seven goats per treatment were first equipped from days 7 to 11, the other five goats being equipped from days 11 to 14, along with two goats for which the first days of recordings were unsatisfactory. A grazing meal was defined by a grazing activity period of at least 6 min; that is, short activity periods of 2 or 4 min were not considered as grazing. Intra-meal intervals of 2 to 4 min were considered as grazing; that is, two meals are separated by at least 6 min of inactivity. The daily grazing time was calculated as the sum of all meals duration (Charpentier and Delagarde, Reference Charpentier and Delagarde2018). The pasture intake rate (g DM/h) was calculated per goat and per period by dividing the PI by the average grazing time.
Chemical analyses
The dry matter concentration of all feeds was measured by drying in a ventilated oven at 60°C for 48 h for pasture and supplements, and for 72 h for faeces. All oven-dried feed and faecal samples were ground through a 0.8 mm screen before chemical analyses. Ash concentration was determined by calcination at 550°C for 5 h in a muffle furnace (Association Française de Normalisation, 1997). Nitrogen concentration was determined using the Dumas method (Association Française de Normalisation, 1997) on a Leco apparatus (Leco, St. Joseph, MI, USA). Concentrations of NDF, ADF and ADL were determined according to van Soest et al. (Reference van Soest, Roberson and Lewis1991) on a Fibersac extraction unit (Ankon Technology, Fairport, NY, USA). Pepsin-cellulase digestibility was determined according to Aufrère and Michalet-Doreau (Reference Aufrère and Michalet-Doreau1988). The concentration of ytterbium oxide was determined using atomic absorption spectrophotometry with a nitrous oxide/acetylene flame after calcination and digestion in nitric acid, in accordance with Siddons et al. (Reference Siddons, Paradine, Beever and Cornell1985). Blood metabolite concentrations were assessed using a multi-parameter analyser (KONE Instruments 200 Corporation, Espoo, Finland).
Statistical analyses
The pasture data, averaged per treatment and per period, were analysed according to the following model (PROC GLM; SAS Institute, 2008):
 $$ {Y_{{\rm{ij}}}} = \mu + {\rm{P}}{{\rm{A}}_{\rm{i}}} + {\rm{perio}}{{\rm{d}}_{\rm{j}}} + {\varepsilon _{{\rm{ij}}}} $$
where Y ij, µ, PAi, periodj and ϵ ij represent the analysed variable, the overall mean, the fixed effect of the PA (n=3), the fixed effect of the period (n=3) and the residual error term, respectively.
Animal data were averaged per goat and per period, and were analysed according to the following model (PROC MIXED; SAS Institute, 2008):
 $$ {Y_{{\rm{ijk}}}} = \mu + {\rm{goa}}{{\rm{t}}_{\rm{i}}} + {\rm{perio}}{{\rm{d}}_{\rm{j}}} + {\rm{P}}{{\rm{A}}_{\rm{k}}} + {\varepsilon _{{\rm{ijk}}}} $$
where Y ijk, µ, goati, periodj, PAk and eijk represent the analysed variable, the overall mean, the random effect of goat, the fixed effect of period, the fixed effect of PA and the residual error term, respectively.
Pairwise comparisons between treatments were tested by Student’s t test and presented as superscript letters in Tables 2–4.
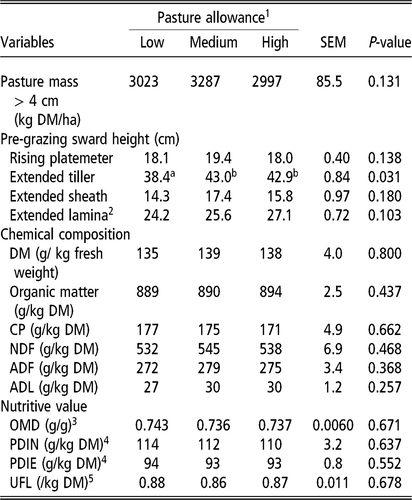
Pre-grazing pasture characteristics: pasture mass, sward height, chemical composition and nutritive value of pasture offered to the goats

SEM = standard error of the mean.
1 On the same row, adjusted means with different superscript letters are significantly different (P<0.05).
2 Difference between extended tiller height and extended sheath height.
3 OMD: organic matter digestibility, calculated from pepsin-cellulase digestibility (Aufrère and Michalet-Doreau, Reference Aufrère and Michalet-Doreau1988).
4 Metabolisable protein when nitrogen (PDIN) or energy (PDIE) is limiting for microbial synthesis in the rumen (INRA, 2010).
5 UFL=Unité Fourragère Lait (1 UFL=7.115 MJ of net energy; INRA, 2010).
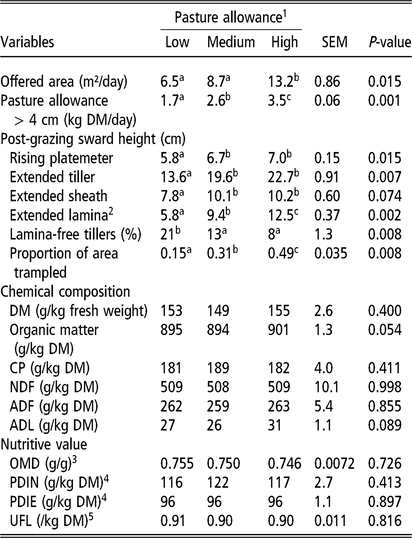
Effect of daily pasture allowance on post-grazing pasture characteristics and on quality of the pasture apparently selected by goats

SEM = standard error of the mean.
1 On the same row, adjusted means with different superscript letters are significantly different (P<0.05).
2 Difference between extended tiller height and extended sheath height.
3 OMD: organic matter digestibility, calculated from pepsin-cellulase digestibility (Aufrère and Michalet-Doreau, Reference Aufrère and Michalet-Doreau1988).
4 Metabolisable protein when nitrogen (PDIN) or energy (PDIE) is limiting for microbial synthesis in the rumen (INRA, 2010).
5 UFL=Unité Fourragère Lait (1 UFL=7.115 MJ of net energy; INRA, 2010).
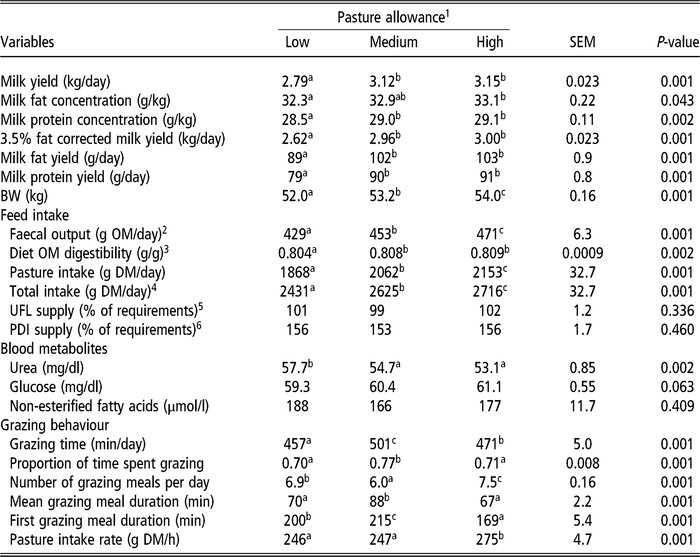
Effect of daily pasture allowance on milk yield, milk composition, body weight, intake, blood metabolites and grazing behaviour of strip-grazing dairy goats

SEM = standard error of the mean.
1 On the same row, adjusted means with different superscript letters are significantly different (P<0.05).
2 OM: organic matter.
3 From faecal indicators.
4 Total intake=pasture intake + 535 g DM/day of concentrate + 27 g DM/day of Yb-concentrate.
5 UFL=Unité Fourragère Lait (1 UFL=7.115 MJ of net energy; INRA, 2010).
6 PDI=Metabolisable protein (INRA, 2010).
Results
Weather
The weather conditions were typical of spring conditions for the region. The mean temperature and total rainfall during May and June were 15.3°C and 148 mm, respectively. These figures were close to the average for the period between 2011 and 2015 (14.8°C and 111 mm, respectively).
Pre-grazing pasture characteristics
As expected, pre-grazing pasture characteristics were similar between treatments (Table 2). The pasture’s botanical composition was 57% grass (ryegrass and fescue), 18% dandelion (naturally present), 12% chicory, 7% clover, 5% other species and 1% lucerne, on a DM basis, and did not differ between treatments. Pre-grazing pasture mass, rising platemeter, extended sheath height and the extended lamina length averaged 3102 kg DM/ha, 18.5 cm, 15.8 cm and 25.6 cm, respectively. The extended tiller height was lower on Low than on Medium and High HA (38.4 v. 43.0 cm). The average pre-grazing pasture OM digestibility (0.739 g/g), CP concentration (174 g/kg DM) and NDF concentration (538 g/kg DM) are indicative of high-quality pastures.
Grazing management and post-grazing pasture characteristics
Actual pasture allowances were close to target levels, due to proper control of the offered area, and averaged 1.7, 2.6 and 3.5 kg DM/day for Low, Medium and High, respectively (Table 3). Post-grazing rising platemeter height (5.8 v. 6.9 cm) and extended tiller height (13.6 v. 21.1 cm) were lower on Low than on Medium and High. Post-grazing extended lamina length and the proportion of trampled area increased with increasing PA, respectively, from 5.8 to 12.5 cm and from 15% to 49% between Low and High. The proportion of lamina-free tillers was greater on Low than on Medium and High (21% v. 11%). The quality of the apparently selected pasture was unaffected by PA and was numerically greater than that of the offered pasture by 0.011 g/g for OM digestibility and by 10 g/kg DM for CP concentration, and lower by 30 g/kg DM for NDF concentration.
Milk yield, milk composition and body weight
Milk yield averaged 3.02 kg/day and was 0.35 kg/day lower on Low than on Medium and High (Table 4). Milk fat concentration averaged 32.8 g/kg and was lower on Low than on High by 0.8 g/kg. Milk protein concentration, 3.5% FCM yield, milk fat yield and milk protein yield were lower on Low than on Medium and High by 0.5 g/kg, 0.36 kg/day, 14 g/day and 11 g/day, respectively. The BW was lower by 1.2 kg on Low than on Medium, and was lower by 0.8 kg on Medium than on High.
Faecal output, diet digestibility, intake and energy balance
Faecal output averaged 451 g OM/day and increased with increasing PA (Table 4). Diet OM digestibility was lower on Low than on Medium and High (0.804 v. 0.809). There was no concentrate refusal throughout the experiment, and total concentrate intake averaged 563 g DM/day (commercial concentrate plus Yb-concentrate). The pasture intake averaged 2028 g DM/day, and total intake (pasture + concentrates) averaged 2591 g DM/day, that is, 132 g/kg BW0.75 or 4.9% of BW. The pasture intake was 194 g DM/day greater on Medium than on Low (i.e. +216 g DM/kg DM of PA), and 91 g DM/day greater on High than on Medium (i.e. +101 g DM/kg DM of PA). Total intake variations between PA were similar (Table 4). Energy (UFL) and protein (PDI) supplies, respectively, averaged 101% and 155% of the requirements, and were unaffected by PA.
Blood metabolites
The blood urea concentration was greater on Low than on Medium and High (57.7 v. 53.9 mg/dl, Table 4). Blood glucose averaged 60 mg/dl and tended to increase with increasing PA (P<0.06). The blood NEFA concentration averaged 177 µmol/l and was unaffected by PA.
Grazing behaviour
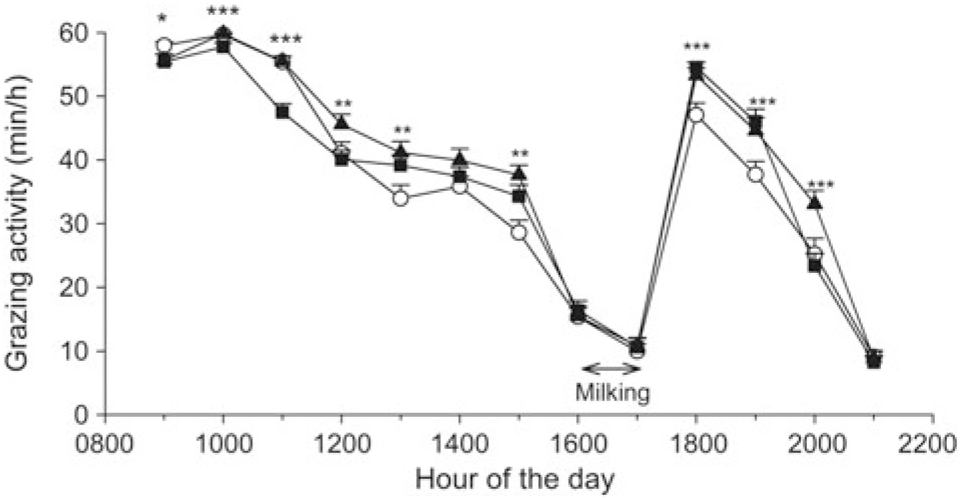
Access time to pasture averaged 658 min/day and was similar across all treatments. Grazing time averaged 476 min/day and was lowest on Low and highest on Medium (Table 4). On Medium, the proportion of time spent grazing was greater than on Low and High (0.77 v. 0.70). The number of grazing meals per day averaged 6.8 and was lowest on Medium and greatest on High. The mean grazing meal duration was greater on Medium than on Low and High (88 v. 69 min). The first grazing meal duration averaged 195 min and was lowest on High and highest on Medium. The pasture intake rate averaged 256 g DM/h and was greater by 28 g DM/h on High than on Low and Medium (i.e. +11%). The daily pattern of grazing activity was very close between treatments, with the most important meal during the morning, moderate grazing activity during the afternoon and another large meal after the PM milking (Figure 1). The overall lower grazing activity observed on Low occurred mainly in the afternoon and the evening. The overall higher grazing activity on Medium was observed throughout the day.
The daily pattern of grazing activity of strip-grazing dairy goats at three PAs (○=Low, ▴=Medium, ▪=High; effect of pasture allowance per hour: *P<0.05, **P<0.01, ***P<0.001, vertical bars: Standard Error).

Parasitic status
Faeces were grab-sampled at the beginning and at the end of the experiment for individual coproscopic analyses on fresh faecal samples. The results showed low levels of parasitic infestation (strongyles and coccidia) and no differences in parasitic status between treatments.
Discussion
The objective of this study was to quantify the intake and milk yield responses of Alpine dairy goats, as well as their behavioural adaptation, to daily PA under strip-grazing management, on high-quality multispecies temperate pastures in spring. Although milk yield response and behavioural adaptation to PA have already been investigated (Charpentier and Delagarde, Reference Charpentier and Delagarde2018), the present experiment provides the first intake response to PA in grazing dairy goats under strip-grazing systems.
Effect of pasture allowance on pasture intake
In the present study, total DM intake (4.9% of BW or 132 g DMI/kg BW0.75) was greater than total intake reported in other dairy goat grazing studies (3.0% BW or 81 g DMI/kg BW0.75 on average in Bonanno et al., Reference Bonanno, Di Grigoli, Stringi, Di Miceli, Giambalvo, Tornambè, Vargetto and Alicata2007b and Keli et al., Reference Keli, Ribeiro, Gipson, Puchala, Tesfai, Tsukahara, Sahlu and Goetsch2017) and by grazing suckling goat studies (between 3.9 and 4.3% BW or between 88 and 118 g DMI/kg BW0.75 in Merchant and Riach, Reference Merchant and Riach1994; Tovar-Luna et al., Reference Tovar-Luna, Puchala, Gipson, Detweiler, Dawson, Sahlu, Keli and Goetsch2011; Askar et al., Reference Askar, Gipson, Puchala, Tesfai, Detweiler, Asmare, Keli, Sahlu and Goetsch2013). The greater total intake measured in our study can be explained by the supply of 600 g of concentrate, by the greater milk yield compared to previous studies, which is known to increase the intake capacity of dairy goats, and by the high quality of the offered pasture, with palatable pasture species such as chicory and dandelion increasing pasture ingestibility (INRA, 2010).
The increase in PI was lower when PA increased from Medium to High than from Low to Medium, which is in accordance with the well-known curvilinear response of PI to PA observed in sheep (Penning et al., Reference Penning, Hooper and Treacher1986) and cows (Pérez-Prieto and Delagarde, Reference Pérez-Prieto and Delagarde2013). This intake response within the tested range of PA suggests that, for goats supplemented with 600 g/day of concentrates and grazing a high-mass pasture, the intake is mainly restricted by PA below approximately 2.6 kg DM/day, meaning that the High PA was likely unrestrictive. This threshold would have been different for other supplementation level or with lower pre-grazing pasture mass. It can be easily suggested that the threshold would decrease for increasing concentrate supplementation level, in relation to substitution rate and lower PI, thus reducing the required pasture allowance. The goats’ response to pasture allowance at lower pasture mass is not easy to predict because of the great potential effect of the height at which pasture is cut on the intake-allowance-mass relationships, as shown in grazing dairy cows (Pérez-Prieto and Delagarde, Reference Pérez-Prieto and Delagarde2012). More research would be required to determine if goats react similarly to cattle to changes in pre-grazing pasture mass under strip-grazing management.
The slopes of the PI response to PA observed in this study are close to the slopes reported in dairy cows, that is, approximately 100 g DM of PI/kg DM of PA between medium and high PA, and approximately 200 to 250 g DM of PI/kg DM of PA between low and medium PA (Delagarde et al., Reference Delagarde, Valk, Mayne, Rook, Gonzàlez-Rodríguez, Baratte, Faverdin and Peyraud2011; Pérez-Prieto and Delagarde, Reference Pérez-Prieto and Delagarde2013). More studies are required to compare goats, sheep and cows on their relative ability to adapt to restrictive PA. Under continuous grazing management, Bonanno et al. (Reference Bonanno, Di Grigoli, Alicata, Tornambè, Avondo, Pagano, Giambalvo, Stringi and Di Miceli2007a) also showed that daily intake is negatively related to grazing severity, that is, stocking rate. Due to the duration of the experimental periods (14 days), the increase in BW with increasing PA between Low and High could not be interpreted as greater body fat deposition, but rather as a short-term increase in digestive contents, known to vary rapidly with the intake level (Agabriel and Giraud, Reference Agabriel and Giraud1988). These authors observed a ratio of 6/1 between short-term variation of BW and daily intake, as observed in this experiment (2-kg increase in BW for 0.3-kg DM/day increase in PI between Low and High).
Effect of pasture allowance on grazing behaviour
The pasture intake variations between PA may be related to both PI rate and grazing time. In our experiment, daily grazing time averaged 476 min, which is within the range (between 348 and 534 min/day) of grazing time observed on adult goats with a daily access time to pasture of more than 12 h (Tovar-Luna et al., Reference Tovar-Luna, Puchala, Gipson, Detweiler, Dawson, Sahlu, Keli and Goetsch2011; Askar et al., Reference Askar, Gipson, Puchala, Tesfai, Detweiler, Asmare, Keli, Sahlu and Goetsch2013; da Silva et al., Reference da Silva, Dittrich, Monteiro, Fernandes, Pinto and Schmidt2014; Keli et al., Reference Keli, Ribeiro, Gipson, Puchala, Tesfai, Tsukahara, Sahlu and Goetsch2017; Charpentier and Delagarde, Reference Charpentier and Delagarde2018). The average PI rate observed (250 g DM/h) is among the highest values of the range reported for grazing adult goats (Romney et al., Reference Romney, Sendalo, Owen, Mtenga, Penning, Mayes and Hendy1996; Tovar-Luna et al., Reference Tovar-Luna, Puchala, Gipson, Detweiler, Dawson, Sahlu, Keli and Goetsch2011; Askar et al., Reference Askar, Gipson, Puchala, Tesfai, Detweiler, Asmare, Keli, Sahlu and Goetsch2013), which may be related mostly to the high quality and height of the sward, enabling easy severage of the pasture.
The non-linear variation of grazing time with increasing PA, which was highest on Medium and lowest on Low, has been already observed in dairy goats (Charpentier and Delagarde, Reference Charpentier and Delagarde2018), but also in sheep (Penning et al., Reference Penning, Hooper and Treacher1986), and in dairy cows (Pérez-Prieto and Delagarde, Reference Pérez-Prieto and Delagarde2013). At low PA, due to the small area available, goats grazed the deep strata, richer in sheath and dead material, reducing the ease of biting and the PI rate, along with the motivation to graze and the daily grazing time. At medium PA, goats were able to compensate for the reduced PI rate by increasing their grazing time compared to High, leading to a slight decrease in PI. The decreased motivation to graze and reduced grazing activity in Low were noticeable from 1300 h, likely in relation with the lesser availability of leaves (Figure 1). As in other ruminant species, the reduced grazing activity at low pasture availability seems specific to rotational or strip-grazing systems. Indeed, under continuous grazing management, goats increase their grazing time with increasing grazing severity (i.e. increasing stocking rate; Animut et al., Reference Animut, Goetsch, Aiken, Puchala, Detweiler, Krehbiel, Merkel, Sahlu, Dawson, Johnson and Gipson2005b), probably because fresh lamina are always available and animals maintain a high motivation to graze despite low pasture height and low PI rate. This difference in grazing behaviour adaptation to low pasture availability between grazing systems has been also observed in sheep (Penning et al., Reference Penning, Parsons, Orr and Treacher1991 and Reference Penning, Parsons, Orr and Hooper1994) and in dairy cows (Pérez-Prieto and Delagarde, Reference Pérez-Prieto and Delagarde2013).
Effect of pasture allowance on milk yield and composition
The milk yield variations with changes in PA are in accordance with the corresponding PI variations and with the results of the literature. Between high and medium PA, corresponding to an approximate 25% reduction in PA, milk yield was unaffected (numerical reduction less than 2%), which is similar to the milk responses already observed for such ranges in PA in dairy goats (Charpentier and Delagarde, Reference Charpentier and Delagarde2018) and in dairy cows (Pérez-Prieto and Delagarde, Reference Pérez-Prieto and Delagarde2013). Between high and low PA, corresponding to a 50% restriction of PA, the decrease in milk yield was approximately 12%, which is also within the range (10% to 20%) of milk yield responses reported by the same authors. The same tendency was observed under continuous stocking management with Girgentana goats, that is, no variation of milk yield between a low and medium stocking rate, and –24% milk produced between a medium and high stocking rate (Bonanno et al., Reference Bonanno, Di Grigoli, Alicata, Tornambè, Avondo, Pagano, Giambalvo, Stringi and Di Miceli2007a).
The slight increase in milk fat concentration with increasing PA is consistent with Charpentier and Delagarde (Reference Charpentier and Delagarde2018), but conflicts with other studies in dairy goats (Bonanno et al., Reference Bonanno, Di Grigoli, Alicata, Tornambè, Avondo, Pagano, Giambalvo, Stringi and Di Miceli2007a) or dairy cows (Pérez-Prieto and Delagarde, Reference Pérez-Prieto and Delagarde2013), where milk fat concentration generally decreases with increasing PA or decreasing stocking rate. The decrease in milk protein concentration at Low was unexpected, as milk protein concentration in dairy goats does not appear to be related to energy intake (Lefrileux et al., Reference Lefrileux, Morand-Fehr and Pommaret2008; Sauvant et al., Reference Sauvant, Giger-Reverdin, Meschy, Puillet and Schmidely2012), contrary to observations in dairy cows (INRA, 2010).
Conclusion
The pasture intake and milk yield of dairy goats under strip-grazing systems on high-quality multispecies temperate swards in spring were affected by PA in the range of 1.7 to 3.5 kg DM/day. The observed slopes of both intake and milk yield responses make it possible to conclude that a pasture allowance close to 2.6 kg DM/day for mid-lactating dairy goats supplemented with 600 g/day of concentrate and grazing on high-quality and high-mass pastures is sufficient to maximise individual performance. Under low pasture allowance, the low PI rate explained the reduction of both PI and milk yield, since goats were unable to increase their grazing time.
Acknowledgements
The authors would like to thank the Nouvelle-Aquitaine Region (France) and the PHASE department of INRA for financing the PhD fellowship for A. Charpentier. This study was partly funded by the fourth ‘Pour et Sur le Développement Régional Grand Ouest (PSDR GO)’ programme, Project ‘Fleche’.
The authors also wish to thank J. Lassalas, P. Lamberton, E. Siroux, F. Briot and G. Mandrile (PEGASE, INRA-Agrocampus Ouest, 35750 Le Rheu, France) for milking, feeding and caring for the goats, and for their help during the measurement periods, as well as T. Le Mouel, N. Huchet and S. Giboulot (PEGASE, INRA Agrocampus Ouest, 35590 Saint-Gilles, France) for their laboratory chemical analyses.
Declaration of interest
The authors declare to have no conflicts of interest.
Ethics statement
Procedures related to the care and management of animals for this trial were approved by an animal care committee from the French Ministry of Agriculture, in accordance with French regulations (decree-law 2001-464, 29 May 2001).
Software and data repository resources
None of the data were deposited in an official repository.