

Introduction
In 1944, the Austro-Hungarian political economist Karl Polanyi published a famous book, The great transformation. Polanyi argued that the rise of the modern state went hand in hand with the development of a modern market economy and that these two changes were inexorably linked. Highly critical of the liberal economy and self-regulating free markets, Polanyi viewed the Industrial Revolution as one of the milestones in human history and pictured the early modern world, in contrast to the modern, as harmonious, romantic, and stable.Footnote 1 The breakthrough to ‘modernity’ was assumed by him, and by many others, to have caused fundamental changes in virtually all dimensions of human life: commercialization, mass consumption, the family, civil society, and democracy, as well as leading to a free labour market, new demographic patterns, globalization, and so forth. In what Jan de Vries has called ‘the revolt of the early modernists’, historians since the 1970s have questioned this portrayal of the early modern period, rejecting the simplistic modernization paradigm and stressing the dynamic nature of the period before 1800.Footnote 2
As part of this revolt, historians of migration have severely criticized the idea of a ‘mobility transition’, developed by geographers such as Wilbur Zelinsky, who described pre-modern societies as stable and self-sufficient, hindering geographical mobility. Only with modernization in the nineteenth century, they claimed, were the chains loosened. People then started to move in unprecedented ways, dramatically increasing migration rates.Footnote 3 In the ‘pre-modern traditional society’, the overwhelming majority stayed put:
the life patterns of all but a few privileged or exceptional persons are, or were, preordained by circumstances of birth. Options of activities were rigidly constrained by gender and by inherited class, caste, occupation, religion, and location. Barring disaster, the orbit of physical movement was severely circumscribed, and the feasible range of information and ideas was narrow and stagnant, changing almost imperceptibly from generation to generation.Footnote 4
Only when people were left no choice, during wars, ecological disasters, or repressive regimes, were they prepared to move. This explains why refugees, such as Huguenots or Iberian Jews, have always attracted attention, in contrast to more mundane movements by itinerant traders, workers, and soldiers.
Not long after Zelinsky published his seminal article, however, social and economic historians began stressing that the early modern period was much less static than many had assumed. Charles Tilly made an important contribution, arguing that, especially in north-western Europe, a process of proletarianization had already started in the sixteenth century. As a result, capitalist societies emerged with a free labour market and geographical mobility.Footnote 5 The date has since been pushed back into the late Middle Ages for parts of north-western Europe.Footnote 6 This resonates with the status quaestionis in the field of migration history, which shows that, at least in western Europe, the early modern period was bustling with movement, both temporary and definitive.Footnote 7 A high level of early modern mobility resulted largely from ubiquitous local and regional moves from parish to parish, both temporary and permanent.Footnote 8 There was also the demand for large numbers of seasonal migrants over longer distances, and the development of an international labour market for soldiers and sailors.Footnote 9 Finally, there was the constant draw of cities, which needed many migrants. In other words, the unruly phenomenon of migration has now been placed centre stage.
To date, however, few scholars have tried to quantify this mobility and to compare migration rates for the early modern period with those of the nineteenth century. It therefore remains unclear to what extent the modern era, with its mass local and international migrations, witnessed a clear break with the preceding period. Zelinsky may have been proven wrong with respect to his assumption that early modern societies in Europe – and by extension in the rest of the world – were static, but his idea that migration patterns and rates increased spectacularly in the nineteenth century has not convincingly been refuted.
Few scholars have applied thorough quantitative tests to Zelinsky's ideas. One is Steven Hochstadt, in his study of migration in Germany between 1820 and 1989.Footnote 10 By using a wealth of data on micro-mobility, to and from German municipalities, he convincingly shows that mobility levels at the end of the nineteenth century were indeed very high but that the link with modernity is very problematic. Not only were mobility levels already quite high before industrialization took off in the mid nineteenth century but they also decreased considerably after the First World War. Another important systematic study is that by Pooley and Turnbull, who used 16,000 life histories to map internal mobility in Britain between 1750 and 1950. As with Hochstadt's study, their data show that the intensity of mobility was already high long before 1850, and they therefore argue that it cannot explain the modernization process.Footnote 11
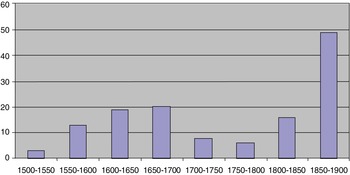
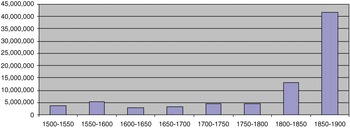
A more recent study by Jelle van Lottum, on migration in the North Sea region between 1550 and 1850, employs another approach. His particular focus is on two major poles of attraction, the Greater London area and the western Netherlands. He introduces the concept of ‘emigrant stock rates’, calculated by measuring the number of people abroad (the migrant stock) per 1,000 home population.Footnote 12 His reconstruction of international migrations in the North Sea region shows a relatively high level in the seventeenth century and a dramatic increase after 1850 (Figure 1).Footnote 13
Emigration stock rates of North Sea countries, 1500–1900.

For other parts of the world, quantitative long-term analyses are rare. Dirk Hoerder's magnum opus notes that migration has been important outside the Atlantic basin for centuries, but his information is more qualitative than quantitative.Footnote 14 Adding to Hoerder's Indian indentured labourers, McKeown has important figures for migrations from China between 1846 and 1940. Bosma provides supplementary information for European colonial soldiers in the nineteenth century, while Vink calculates the numbers of slaves transported in the Indian Ocean in the seventeenth century.Footnote 15
In order to put Zelinsky properly to the test, we first seek to reconstruct, as systematically as possible, migration ratios for western Europe before 1840. We also discuss migration in Europe as a whole in the longue durée (1500–1900), including European Russia and the Ottoman Balkans. Our ambition is not only to test Zelinsky's mobility transition hypothesis but also to propose a formal method, applicable to other parts of the world and serving as a tool for much-needed systematic global comparisons. In addressing social and economic developments in Europe since the Middle Ages, we focus on proletarianization, free and unfree labour, and the ‘first round’ of globalization.Footnote 16 We thereby hope to contribute to key debates in global history, such as that concerning the ‘Great Divergence’.Footnote 17
Defining migration
One problem with migration is that it covers both micro-moves (e.g. from one village to another) and macro-moves (e.g. intercontinental), and therefore can easily become a rather blunt analytical tool. For our reconstruction of migration rates in Europe, we have thus decided to limit ourselves to what Patrick Manning, in a new migration typology, labels ‘cross community migration’.Footnote 18 This is not so much a matter of distance but rather of the cultural impact of migration. Manning argues that migrants moving over a cultural, often linguistic, border tend to gain new insights, and that this type of migration is therefore likely to speed up the spread of innovation. This is less the case with Manning's ‘home community’ migration, where migrants remain within their language community. Our migration rates can thus be used to probe divergent economic and cultural developments between different parts of the world, especially relating to the ‘Great Divergence’ between Asia and Europe.
These considerations have led us to measure the following six forms of migration: migration from Europe to non-European destinations, including colonial migration (‘emigration’); migration from other continents to Europe (‘immigration’); settlement in ‘empty’ or sparsely populated spaces within Europe (‘colonization’); movements to cities of more than 10,000 inhabitants, predominantly from the countryside (‘migration to cities’); seasonal migration (‘migratory labour’); and migration of sailors and soldiers (‘labour migration’).
Certain flows have been excluded. Rural migrations of servants and artisans have not been measured separately but are provisionally subsumed under ‘migration to cities’. We also exclude return migration – particularly important for free, economically motivated migrants – because we lack consistent data. Migration from cities to the countryside fits better in the ‘cross-community’ than in the ‘home-community’ category but it was quantitatively negligible.
We realize that a uniform definition of cultural borders over a span of 400 years may seem somewhat ahistorical but we believe that the level of aggregation for our six forms of migration justifies this choice. Moreover, our method allows us to attribute different weight to these six forms, varying from period to period and depending on specific research questions. For example, applying this model to answer the question of the extent to which cultural borders were crossed in the twentieth century, the weight attached to movement to cities would be reduced considerably, at least for those moving within nation-states. However, if the question was the extent to which labour was efficiently allocated through migration, the problem of cultural borders would be scarcely relevant and the weight of migration to cities would not differ fundamentally between early modern and modern times.
As this article is primarily a test of the ‘mobility transition’, it is little concerned with the relative weight of various forms of cross-cultural migration; however, an advantage of our model is that it can be used to ask different questions, such as the impact of migration on receiving societies. We would thus like to state that we are not arguing that all cross-cultural migration is equal and has a similar impact, especially in Manning's developmental or innovative sense. For example, ‘colonization’ often had little influence on receiving societies, although migrants crossed cultural boundaries, because such migrants settled in remote rural areas and remained isolated from the surrounding environment. In contrast, small groups of merchants, scholars, or technicians may have had a large and lasting influence on receiving societies.
As for periodization, 1500 seems to be a sensible starting point. There had, of course, been movements out of Europe as early as the high middle ages, for example with crusading settlement in the Middle East or the peopling of Portugal's Atlantic islands. However, the ‘discoveries’ were the catalyst for the real take-off, with colonists leaving for white settler colonies, both overseas and in Siberia, and migrants moving to trade posts and strongholds in Africa and Asia. Moreover, emigration, often forced, from eastern Europe to the Middle East started around this time.Footnote 19
In contrast to ‘emigration’ and ‘immigration’, ‘colonization’ and ‘city-bound migration’ have attracted little attention from scholars. Compared with movement in and out of Europe, however, the numbers involved in intra-European migrations were considerable. This is well illustrated by the colonization of ‘empty spaces’, notably east of the Elbe, in Prussia, Poland, and the Russian, Habsburg, and Ottoman empires. The most common form of settlement occurred in cities, especially in parts of Europe where freedom of movement and urbanization flourished. This began in southern Europe and then moved via southern Germany to the Dutch Republic and England. Given the natural decrease of population in cities until the nineteenth century, this form of migration affected millions of people, particularly those moving to large cities such as Madrid, Paris, London, or Amsterdam.Footnote 20
There were also a small number of influential migrants who moved as part of their career, particularly clerics, university professors, and high-ranking state officials in early modern times. These highly skilled and specialized migrants were recruited in an international market and often changed their residence.Footnote 21
Quantifying migration, 1500–1900
To link up with data on the nineteenth century, the main aim of this article is to quantify migrants for the whole period 1500 to 1900. Two methods are available. The modern one is based on national censuses and the registration of international migration movements. Van Lottum has inventively applied a modification of this approach for his reconstruction of emigrant stock rates in the North Sea area.Footnote 22 However, this is not feasible for Europe as a whole because many political and social structures were less permanent than those around the North Sea. Pooley and Turnbull propose a second method, also known from historical life-cycle projects. Here, a sample of life experiences is analysed, to determine how much research subjects have migrated.Footnote 23 While this method might appear even less feasible for Europe as a whole between 1500 and 1900, we propose to borrow migration experiences in a human's lifespan as a concept linked to Patrick Manning's ‘cross-community’ category.
To understand whether a particular society is more or less mobile at a given moment, we have to determine the share of inhabitants with an important (cross-community) migration experience at that moment, or during a lifetime. As we do not have samples of life histories, we add up all long-distance migrants into and out of Europe (or parts of it) per fifty-year period, and we divide the result by the total population present in the middle of a period. In more formal terms:

Notes: This formula provides the probability Pi(p) of a person living in period p and geographical unit i migrating in a lifetime. Mi perm, Mi mult, and Mi seas respectively denote permanent, multi-annual, and seasonal cross-community (often long-distance) movements inside unit i. Mi imm is the number of immigrants to unit i from outside and Mi emi the number of emigrants from unit i to elsewhere. The notation ∑p indicates that these migration numbers are summed over period p. Ni(p) is the total population in geographical unit i in the middle of period p. To compensate for over-counting in the migration numbers, the expression needs to be corrected by the second factor, in which Ei(p) denotes the average life expectancy in period p and Lp is the length of the period. In this article, we ignore the second term, since we estimate Lp = 50 years ≈ Ei(p).
We have chosen a fifty-year period because it is the smallest possible breakdown for imprecise migration figures, which tend to cover much longer periods. Moreover, it represents the life expectancy for Europeans who survived early childhood. While being well aware of the crudeness of such a migration rate, we think it the best available.
Emigration
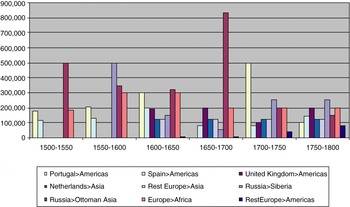
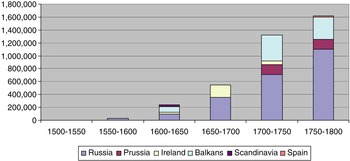
Although European emigration is mostly associated with those crossing the Atlantic in the nineteenth and early twentieth centuries, these were by no means the first migrants to move beyond Europe's borders. From the early sixteenth century, Tatar raiders took slaves from Russia, the Baltic, Poland, and Ukraine, mostly destined for the Asian part of the Ottoman Empire, while other ‘white slaves’ went south across the Mediterranean.Footnote 24 Russian serfs fled to Siberia, and free and indentured migrants went to the Americas, Asia, and Africa. Figure 2 shows the various types of emigration documented in the literature.
Emigration from Europe, 1500–1800.
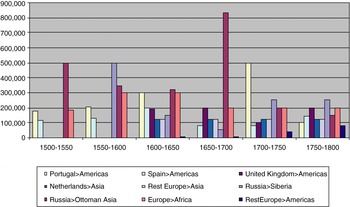
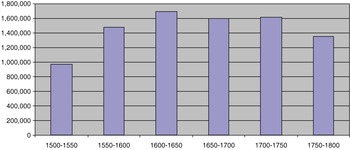
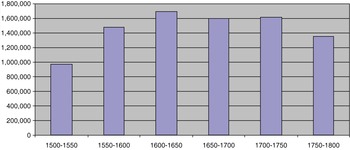
The best-known movement to other continents is transatlantic migration to the Americas, following the discovery of the New World. The largest ‘donor’ was the British Isles, followed by tiny Portugal, which saw huge numbers of people leave, especially in the first half of the seventeenth century. These numbers included both free and indentured migrants, the latter going to North America and the Caribbean. However, hundreds of thousands of sailors and soldiers also left Europe for Asia, in the service of the Dutch and English East India companies, and on Spanish, French, and Portuguese ships. Many of these men never returned, not least because of the high mortality rate in the tropics.Footnote 25 The total picture for the period 1500–1800 is shown in Figure 3.
Total emigration from Europe, 1500–1800
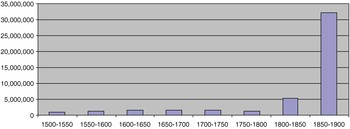
In the second half of the nineteenth century, emigration became a mass phenomenon, especially to the Americas.Footnote 26 This was greatly stimulated by the transport revolution, which lowered costs. In particular, from the 1830s the construction of railroads cheapened internal transport and trips to ports. Furthermore, the price of transatlantic tickets on sailing ships reduced considerably between 1832 and 1843, mirroring the increasing efficiency of liner traffic. With the shift to steamers, transportation costs declined again, and the time taken to cross the Atlantic to the USA decreased from six or seven weeks to just two weeks, and later ten days.Footnote 27 In the 1860s, low fares for steamships were in the same range as sailing ships, but both excluded food, which made the long journey by sail more expensive; new shipping lines competed so vigorously that ticket prices dipped again in the last two decades of the nineteenth century. Italian seasonal workers, already used to migrating to other parts of the peninsula or to France, could travel to Argentina for half a year and then return to their home villages.Footnote 28 As Figure 4 shows, this all led to a drastic increase in mobility. These are the figures that inspired Zelinsky and many others to present their influential interpretation of Europe's migration history.
Emigration from Europe, 1500–1900.

Immigration
Large-scale immigration from other continents was rare, in contrast to the twentieth century, but considerable numbers were involved in some periods, with four major movements identified to date. First, around 50,000 migrants from the Asiatic part of the Ottoman Empire colonized the Balkans at the beginning of the sixteenth century, mostly nomadic Turkish tribes but also Tatars, who settled in Bulgaria.Footnote 29 Istanbul also received thousands of migrants from Asia but these have been included in numbers of migrants to cities, considered later. Second, in the early seventeenth century, some 270,000 Kalmyks moved from western Mongolia to the borders of the Caspian Sea in European Russia.Footnote 30 Third, about half a million Muslims, predominantly from northern Africa, were taken as slaves to Italy in the sixteenth and seventeenth centuries, where they were often put to work on the galleys.Footnote 31 (The numbers of Muslim slaves taken to other parts of southern Europe are not yet known.) Finally, hundreds of thousands of West African slaves were brought by the Portuguese to Iberia and Italy between the 1440s and the 1640s. In some cities, they made a significant demographic impact: for example, in Lisbon in 1550, 10,000 people (some 10% of the population) were black slaves.Footnote 32 Overall estimates of immigration range from 100,000 to 1,000,000 but we have used a more conservative educated guess of 300,000, half of whom came in the sixteenth century.Footnote 33
Colonization
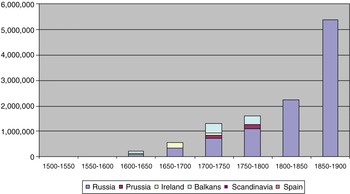
Migration to develop and cultivate sparsely populated territories started in the Middle Ages, when rulers invited newcomers to settle, often by offering favourable conditions. Well-known destinations were the East Elbian territories (ninth to thirteenth centuries) and the peat bogs along the Dutch North Sea coast (eleventh to thirteenth centuries). Many serfs were able to free themselves from feudal obligations and become independent agriculturalists, especially in the regions east of the Elbe. With the demographic catastrophe of the Black Death in the mid fourteenth century these forms of colonization stopped but they resumed in the sixteenth and seventeenth centuries (Figure 5).
Colonization migration compared, Europe, 1500–1800.
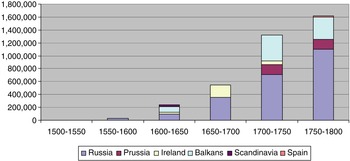
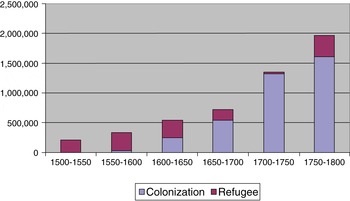
The early modern period produced almost four million migrants of this type. They were strictly regulated by states such as Russia, the Habsburg and Ottoman Empires, and Prussia, but also by other German rulers, who tried to repopulate their territories after the devastations of the Thirty Years War (1618–48). Among these settlers were religious minorities, who were granted freedom of religion, especially Jews and Protestant dissenters (Mennonites and Hutterites). The bulk of them, however, were Russian peasants, following Russian expansion in the direction of the Caucasus, which added the central black-earth and steppe regions near the Lower Volga and Don rivers to the empire. These movements of colonization left western Europe with virtually no empty spaces, except for land reclamation in the Netherlands in the modern period. This type of migration also occurred in densely populated regions: some 250,000 English and Scots were settled in Ireland in the seventeenth century.Footnote 34 As Figure 6 shows, this type of migration became very important from 1600 onwards and can be nicely contrasted with well-studied refugee migrations.
Colonization and refugee migrations, Europe, 1500–1800.

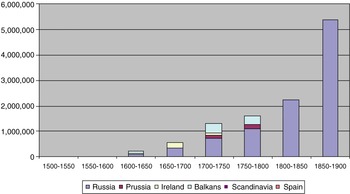
From the mid nineteenth century, there was a clear increase in colonization (see Figure 7), with numbers jumping from under 2.2 million to 5.4 million, almost entirely caused by the rural settlement of the Russian forest and steppe zones. Most migrants came from agricultural areas such as Ukraine, and were looking for land in less densely populated zones to carry on farming. Particularly in the arid steppes of the south-east, migrants had to adapt and change their agricultural practices, and many encountered and interacted with ethnic groups with different cultures and ways of life.Footnote 35
Colonization migration in Europe, 1500–1900.
Migration to cities
Whereas refugee migration was concentrated in the period 1550 to 1700, and colonization migration in the seventeenth and early eighteenth centuries, the movement from countryside to cities was continuous, influenced by the economic cycle and the shifting economic centre of Europe. In the fifteenth and sixteenth centuries, Italian and Spanish cities attracted many migrants. Later, the balance shifted to the Dutch Republic (the most urbanized region of the world at the time), Antwerp, London, and Hamburg.Footnote 36 In the seventeenth century, the northern Netherlands blocked access to the sea for Antwerp and other Flemish cities in the Spanish Netherlands, but the other cities, along with Lisbon, experienced a spectacular population growth, caused by massive immigrations from the Iberian, German, Scandinavian, and English hinterlands. Even in smaller towns at the end of the seventeenth century, more than half the inhabitants had been born elsewhere. As most refugees settled in towns and cities, they are subsumed under this category and not under the separate heading usually applied in migration history.
Migration to cities was a lynchpin of the urban economy and a key regulator of city populations, being much more significant than urban births and deaths.Footnote 37 Most scholars agree that cities with more than 10,000 inhabitants generally could not reproduce themselves until the nineteenth century. At the same time, many smaller towns depended on rural to urban migration to make up for population losses and stagnation, for example those in southern Germany after the Thirty Years War.Footnote 38 After 1800, urban mortality declined, but migration still added considerably to population growth, most probably accounting for around 50%.Footnote 39
High urban mortality, also known as ‘the urban graveyard effect’ or the demographic sink, is much debated. An influential idea is that high population density and poor hygienic conditions made early modern cities much less healthy than small cities or the countryside.Footnote 40 Sharlin hypothesized that migrants had much higher chances of dying from disease and therefore much lower marriage rates.Footnote 41 More recently, scholars have pointed to unbalanced sex ratios, major differences in environmental conditions, and great variations in levels of nuptiality and fertility.Footnote 42 For our argument, however, the causes matter much less than the necessity to overcome the population deficit through migration.
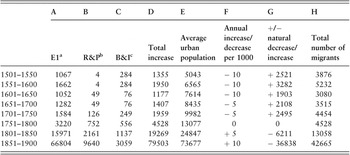
Virtually all urban growth in the early modern period should thus be considered as migration, and this even includes negative natural increase.Footnote 43 For the sixteen countries listed by de Vries, we have recalculated total net growth per fifty-year period for each country separately, but it is difficult to reconstruct the urban graveyard effect. So far, no one has systematically mapped the many estimates for Europe in the period 1500–1800. Historians often rely on information for one or two cities, which is then extrapolated to Europe as a whole.Footnote 44 This method is much too crude, and does not cover our entire period. We therefore gathered as many data as possible from the available historical demographical literature for the provisional reconstruction in Table 1.-wrap
Migration to cities over 10,000 in Europe, 1500–1900 (000s)

a E1 = Europe without Russia, Poland, Balkans, and Istanbul (note that de Vries, European urbanization, included Kaliningrad, Szczecin, Wroclaw, Gdansk, and Elblag in his numbers for Germany).
b R&P = European Russia and Poland (without the cities mentioned under E1)
c B&I = Balkans (including Hungary) and Istanbul.
Sources: de Vries, European urbanization, pp. 30, 50, 67; Bairoch, Cities, pp. 175, 216; Paul Bairoch, Jean Batou, and Pierre Chèvre, La population des villes Européennes: banque de données et analyse sommaire des résultats, 800–1850, Genève: Universite? de Genève, 1988; Cem Behar, Osmanlı İmperatorluğu'nun ve Türkiye'nin nüfusu, 1500–1927, Ankara: T. C. Başbakanlık Devlet İstatistik Enstitüsü, 1996; Bernard Hourcade, ‘The demography of cities and the expansion of urban space', in Peter Sluglett, ed., The urban social history of the Middle East, 1750–1950, Syracuse, NY: Syracuse University Press, 2008; Thomas Stanley Fedor, Patterns of urban growth in the Russian empire during the 19th century, Chicago, IL: University of Chicago, Department of Geography, 1975. Also Jean-Pierre Bardet, Rouen aux XVIIe et XVIIIe siècle: les mutations d'un espace social, Paris: SEDES, 1983, p. 27, and documents, pp. 17–19; Jean-Pierre Bardet, ‘Skizze einer städtischen Bevölkerungsbilanz: der Fall Rouen', in Neithard Bulst, Jochen Hoock, and Franz Irsigler, eds., Bevölkerung, Wirtschaft und Gesellschaft: Stadt-Land-Beziehungen in Deutschland und Frankreich 14. bis 19. Jahrhundert, Trier: Auenthal Verlag, 1983, p. 72; Marina Cattaruzza, ‘Population dynamic and economic change in Trieste and its hinterland, 1850–1914', in Richard Lawton and Robert Lee, eds., Population and society in Western European port-cities c.1650–1939, Liverpool: Liverpool University Press, 2002, pp. 176–211; Louis Chevalier, La formation de la population parisienne au XIXe siècle, Paris: Presses Universitaires de France, 1949, pp. 48–52; M. J. Daunton, ‘Towns and economic growth in eighteenth century England', in Abrams and Wrigley, Towns in societies, p. 256; C. Desama, ‘La croissance démographique à Verviers pendant la révolution industrielle (1759–1850)', Annales de Démographie Historique, 1982, p. 201; de Vries, European urbanization, pp. 235–7; A. Eisenbach, and B. Grochulska, ‘Population en Pologne (fin XVIIe, début XIXe siècle)', Annales de Démographie Historique, 1965, p. 118; E. Esmonin, ‘Statistiques du mouvement de la population en France de 1770 à 1789', Études et Chronique de Démographie Historique, 1964, pp. 27–130; Etienne François, ‘Mortalité urbaine en Allemagne au XVIIIe siècle', Annales de Démographie Historique, 1978, pp. 152–3; Marco H. D. van Leeuwen and James E. Oeppen, ‘Reconstructing the demographic regime of Amsterdam 1681–1920', Economic and Social History in the Netherlands, 1993, pp. 70–1; E. Levasseur, La population française: histoire de la population avant 1789 et dèmographie de la France, comparée à celle des autres nations au XIXe siècle, précédée d'une introduction sur la statistique, Paris: Rousseau, 1891, vol. 2, pp. 395–6, 408; R. Mols, Introduction à la démographie historique des villes d'Europe du XIVe au XVIIIe siècles, Louvain: Bibliothèque de l'Université de Louvain, 1956, vol. 3, pp. 207–11; M. Natale, ‘Les bilans démographiques des villes Italiennes de l'unité d'Italie à la première guerre mondiale', Annales de Démographie Historique, 1982, p. 221; Hubert Nusteling, ‘De bevolking: van raadsels naar oplossingen', in Willem Frijhoff et al., eds., Geschiedenis van Dordrecht van 1572 tot 1813, Hilversum: Verloren, 1998, pp. 91–3, 98–101; Sigismund Peller, ‘Zur Kenntnis der städtischen Mortalität im 18. Jahrhundert mit besonderer Berücksichtigung der Säuglings- und Tuberkulosesterblichkeit (Wien zur Zeit der ersten Volkszählung)', Zeitschrift für Hygiene und Infektionskrankheiten, 90, 1920, p. 230; Jean-Claude Perrot, Genèse d'une ville moderne: Caen au XVIIIe siècle, Paris: Mouton, 1975, p. 152; A. Schiaffino, ‘Un aspect mal connue de la démographie urbaine: l'émigration', Annales de Démographie Historique, 1982, pp. 231–41; J. H. Schnitzler, Statistique générale méthodique et complète de la France, comparée aux autres grandes puissances de l'Europe, Paris: H. Lebrun, 1846, vol. 1, pp. 389–402, 450–63; William H. Sewell, Structure and mobility: the men and women of Marseille, 1820–1870, Cambridge: Cambridge University Press, 1985, p. 149; A. Soboul, La France à la veille de la Révolution, Paris: Société d'Édition d'Enseignement Supérieur, 1974, p. 58; Wrigley, ‘A simple model', p. 217.
Using the data on city growth provided by Jan de Vries and Paul Bairoch and others, we first calculated the net growth of cities within a fifty-year period, for three parts of Europe (A–C), resulting in the total urban growth (D). We then calculated the average urban population in each period (E), to which we applied the average decrease or increase of population due to excess urban mortality (1500–1750) or natality (1800–1900) (F), resulting in the natural increase or decrease of the urban growth figures (G). The end result is to be found in column H (D +/− G). These calculations are the basis for Figure 8.
Migration to cities in Europe of more than 10,000 population, 1500–1900.

We realize that these numbers on migration to cities constitute an absolute minimum and that they exclude movements of people moving to centres with fewer than 10,000 inhabitants. This is not a problem, however, because the latter moves generally took place over short distances, overcoming minor cultural barriers, and therefore do not fit our cross-community definition. Moreover, small urban communities had a much stronger chance of natural growth and their net population figures therefore tell us little about migration movements.
We also realize that the net increase in aggregate urban population per half-century is only the tip of the iceberg, because the growth of one city might be annulled by the decrease of another.Footnote 45 Ideally we would like to have had numbers at the individual city level for all the periods under study but these are mostly lacking, at least for the area and time period we cover. Although we seriously underestimate city-bound migrations, and thus migration rates (especially for the early modern period), this does not influence the general trend. Finally, we were unable to trace the manifold temporary residents in Europe's cities and the many vagrants moving between the countryside and cities.Footnote 46 This too is compensated for, to some extent, by our attempt to come up with temporary migration figures independently.
Migratory labour of a seasonal nature
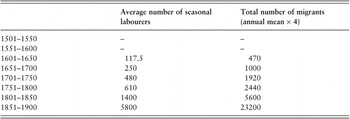
Seasonal labour was widespread throughout Europe, particularly in the western and southern parts. Large numbers of peasants left their small farms to work for higher wages in areas where labour was in great demand, especially during harvest times. Thanks to a systematic attempt to quantify this form of migration during the Napoleonic period, the numbers around 1811 are well known. One may project these figures back in time on the basis of general economic trends, as there are very few quantitative sources that provide direct evidence. For the nineteenth century, there are some good additional data. As the average period of seasonal work was supposedly about 12.5 years, we have multiplied the average number of seasonal migrants in a given fifty-year period by four. This leads to the data in Table 2, which suggests a very dramatic increase in the nineteenth century, particularly in Russia.
Estimated development of seasonal labour in Europe, 1600–1900 (000s)

Sources: Lucassen, Migrant labour, pp. 133–71 (1600–1800), pp. 172–206 (1800–1900); Peter Kolchin, Unfree labor: American slavery and Russian serfdom, Cambridge, MA: Harvard University Press, 1987, pp. 334–8; Jeffrey Burds, ‘The social control of peasant labor in Russia: the response of village communities to labor migration in the central industrial region, 1861–1905', in Esther Kingston-Mann and Timothy Mixter, eds., Peasant economy, culture, and politics of European Russia, 1800–192 1, Princeton, NJ: Princeton University Press, 1991, p. 57.
Labour migration
As a rule, labour migrants leaving for periods of several years were young, and many of them were unmarried. They were trying to build up savings to settle as independent producers, or to become economically attractive marriage partners. Seamen, soldiers, domestics, and ‘tramping artisans’ were the most important occupational sub-groups in this category, but we only have sufficient statistical data for seamen and soldiers. The lack of good figures for the numerically important domestics and artisans is less serious than it seems because they fell, for the most part, under our category of urbanization. This is not the full migration story, for some domestics returned to the countryside or to the small towns where they came from and therefore may not be totally covered by the urbanization figures. The same goes for the mainly urban artisans. Some of the migrants we may miss in this way are compensated for by our double-counting of seamen who settled permanently in cities.
Not all seamen were migrants. For our purposes, and according to our cross-community definition, we exclude coastal fishermen and men employed in inland navigation on rivers, canals, lakes, or sea arms intruding into the continent, who were rarely away from home for more than a week at a time.Footnote 47 We include crews of galleys, dwindling after 1660, under the rubric of sailors.Footnote 48 All seamen working on ocean-going merchant vessels and on naval ships are included, because of their destinations and, particularly, because the majority of sailors on European ships were not born where they embarked, as the Dutch case shows most clearly.Footnote 49 In the case of other countries, between a quarter and a half of their sailors may have originated from places other than their port of embarkation, especially in wartime.Footnote 50 It is possible to make estimates of the European maritime market, even if the data are a ‘statistical minefield’.Footnote 51 Men in the navy may seem under-represented, but most fleets for war were not kept on a permanent basis until the late nineteenth century. Their sailors had to be ‘borrowed’ from merchant ships, which might be prevented from sailing if the navy had insufficient men.
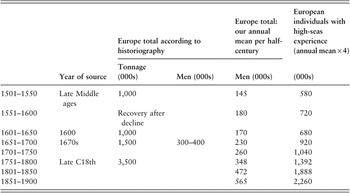
The well-known Dutch maritime historian Jaap R. Bruijn concluded that the average European seaman in the period 1570–1870 was under thirty years of age, and that it was not uncommon for boys of twelve to fifteen years to work at sea.Footnote 52 Our point of departure is the supposition that an average seaman's career lasted 12.5 years. For fifty-year migration figures (see Table 3), we multiply our figures of average maritime employment by four, to estimate the number of men with experience of the high sea, and the migrations involved in recruitment, voyages, and discharge inherent to this type of occupation.
Average annual and total maritime work force in Europe (excluding the Balkans), 1500–1900

Sources for the columns ‘Europe total according to historiography': Richard W. Unger, ‘The tonnage of Europe's merchant fleets 1300–1800', American Neptune, 52, 1992, pp. 247–261, partially revised in Jan Lucassen and Richard Unger, ‘Labour productivity in ocean shipping', International Journal of Maritime History, 12 2000, pp. 127–141, with the following additions: total number of sailors late seventeenth century (including fishermen and coastal mariners): Jean Meyer, ‘Forces navales et puissances économiques', in Paul Adam, ed., Seamen in society, Bucharest, 1980, vol. II, p. 79.
In Chapter 20 of Candide, published in 1759, Voltaire provides a clear-cut answer to the vexed question of soldiers as migrants: ‘a million assassins organized into regiments, rushing from one end of Europe to the other inflicting murder and pillage because they have to earn their living and they do not know an honest trade’.Footnote 53 Prior to the introduction of general military conscription, many, if not most, soldiers in Europe were long-distance migrants. This was certainly the case for mercenary and professional work, the prevailing recruitment system in late medieval and early modern times.Footnote 54 It was not true of most militiamen, however, and we do not include them in this study.Footnote 55 Moreover, not all mercenaries left their villages or home towns forever.Footnote 56 Redlich distinguishes in particular between the Swiss mercenaries, whom he calls ‘sedentary’ because a substantial number returned home after a war was over, and the ‘uprooted’, who made war their profession, the so-called lansquenets.Footnote 57
The ‘military revolution’ from the early sixteenth century onwards, characterized by a new use of fire power and fortifications, increased the size of armies substantially and changed their nature.Footnote 58 Childs distinguished between the domination of mercenaries before the mid seventeenth century and standing armies thereafter. Instead of an outlay confined to periods of war or disturbances, the standing army was ‘a military mouth which needed to be fed at all times’.Footnote 59 Consequently, many more professional soldiers in Europe left their homes. The ‘fiscal-military state’, a famous expression coined by John Brewer and borrowed by Charles Tilly, converted taxpayers’ money into mercenaries’ salaries, thereby contributing to the mobilization of wage labour and its spatial mobility. In this context, we can talk of a fiscal labour-migrants’ state.
Mercenaries, available for hire to the best paymaster, moved frequently from one army commander to another. Moreover, sites of war and battle shifted continually, and fortresses were often far from population centres. Half of the infantry of the Dutch Republic, which had one of the most international armies, were foreigners.Footnote 60 Ancien régime France also relied partially on foreigners, as did Spain, Britain, Sweden, and Prussia.Footnote 61 Employing foreign troops in wartime was considered highly advantageous: ‘the troops native to the country where the war is disband very rapidly and there is no surer strength than that of foreign soldiers’.Footnote 62 Professional soldiers dominated the European military scene until the end of the eighteenth century, despite experiments with conscription.Footnote 63
After the French Revolution, conscription became the rule in Europe. Only a few European countries stuck to a professional army, of which Britain was the most notable example. As a result, military mobility diminished considerably, at least in peace time, because conscripts had to report for training in the nearest barracks for limited periods.Footnote 64 However, this was not the case in Austria-Hungary around 1850, where most regiments seem to have camped in crown lands other than those from which they originated, or in Italy after 1870.Footnote 65 In the second half of the nineteenth century, the time that conscripts spent in arms away from home varied between a few months and one and a half years.Footnote 66 They can thus be regarded as short-distance internal migrants, although the recruitment system only gradually became truly universal through a reduction of the term of duty and the concomitant abolition of substitution possibilities.Footnote 67 Indeed, nineteenth-century conscription often lasted for long periods, converting those drafted into more or less permanent migrants.Footnote 68 Even when short terms of duty dominated, of three years and less, war often had an adverse effect, moving recruits to borders or battlefields, and at times abroad, as during the Napoleonic wars that raged during the first twenty years of the conscription system. Thus, our mobility rates include all soldiers, both paid and conscripted, as an integral component of migrating Europe, with the important exception of conscripts who were called up for three years or less, served in their own region, and were not mobilized for war.
The final step is to convert average military strength into individual men on the move. Sometimes this is easy because we have figures for the numbers of soldiers recruited: for example, for France and Russia from about 1700 onwards. In most cases, however, we need to take an extra step by estimating the average service time. A good indicator is the pace at which soldiers were replaced.Footnote 69 Between 1500 and 1850, armies lost 10–15% of their troops annually in peace time, and 15–40% in war time. Because of the frequency of wars in Europe before 1815, we may safely surmise an overall wastage rate of at least 20%. Consequently, we must multiply the average strength of a given army in all fifty-year periods before 1850 by ten, to reach the number of individual men under the colours. A major reason for these high figures is mortality from disease and war, although there was a substantial drop in military death rates in the second half of the nineteenth century.Footnote 70
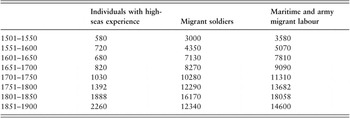
Well-founded estimates of the total strength of armies in Europe are rare. Geoffrey Parker has estimated that the armed forces maintained by each of the leading European states had perhaps reached 150,000 men by the 1630s.Footnote 71 This might amount to one million soldiers for the continent, many more than in the late Middle Ages.Footnote 72 By 1710, he gives an estimate of 1.3 million for the ‘total number of troops simultaneously on foot in Europe’.Footnote 73 While Parker suggests that there was no growth over the eighteenth century, Jürgen Luh provides a higher estimate for the continent on the eve of the French Revolution: two million men in military service, or 5% of the male population between the ages of twenty and sixty.Footnote 74 Our data allow for more detailed estimates, which are consistent with the rough figures of military historians (Table 4).
The development of labour migration in Europe (excluding the Balkans), 1500–1900 (000s)

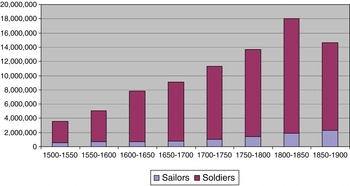
Migratory labourers are thus a category to be reckoned with in migration history. We counted more than eighty million sailors and soldiers over these four centuries, omitting the Ottoman Balkans. We have collected extensive data for the Ottoman empire but we cannot be sure how many men originated from European parts of the empire.Footnote 75 Data on domestics and tramping artisans would push this total to more than 100 million (Figure 9). Without doubt, these figures represent a minimum of migrant labour, especially before 1800, if only because we are unable to estimate the numbers of camp followers, consisting of servants, wives, children, prostitutes, victuallers, and others. Some experts put this ‘train’ at between 50% and 150% of the size of armies at war.Footnote 76
Migration of soldiers and sailors in Europe, 1500–1900.

Total migration, 1500–1900
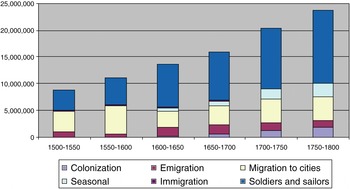
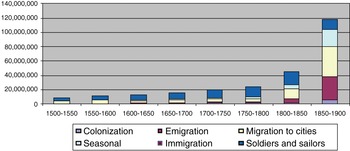
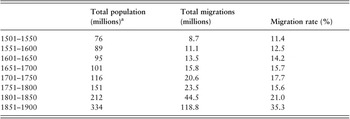
Although much remains unknown when it comes to geographical mobility in early modern Europe, the contours of a trend are visible in Figure 10. Absolute numbers grew dramatically in the nineteenth century, especially after 1850, as a result of widespread urbanization and the expansion of seasonal migration and emigration to the Americas, Siberia, and elsewhere (Figure 11).Footnote 77 The rise in internal European colonization appears quite insignificant when compared to the scale of migration to cities and emigration. When we then link these absolute numbers to the population of Europe, we arrive at the position shown in Table 5.
Total migration in Europe, 1500–1800.

Total migration in Europe, 1500–1900.

Total migration rates in Europe, 1500–1900

a Estimated total population in the middle of the half-century, defined as the average of the total population at the beginning and end of the period.
Sources: Based on de Vries, European urbanization, with additions from Bairoch et al., La population; Behar, Osmanli; Fedor, Patterns; Hourcade, The demography of cities; and Gilbert Rozman, Urban networks in Russia, 1750–1800, and premodern periodizatio n, Princeton, NJ: Princeton University Press, 1976. For 1900 (except Russia) we used Maddison: http://www.ggdc.net/maddison/.
Disaggregating Europe: the Dutch Republic and Russia compared
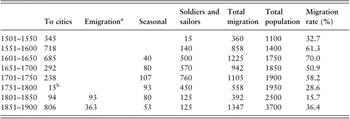
Aggregated estimates for Europe as a whole conceal important regional differences, so the data should be broken down to understand the development of migration rates. We chose two countries to represent two extremes of social and economic development: the Dutch Republic with early commercialization, urbanization, and a wage economy; and Russia, with few cities and the bulk of the population living as serfs in the countryside. When we apply the same criteria and urbanization data to the Dutch Republic as a whole, it becomes clear that mobility levels during the first half of the seventeenth century, when the Republic reached the zenith of its economic and political power, were twice as high as the European average in the age of mass migrations after 1850 (see Table 6).
Total migration (000s) and migration rates for the Netherlands, 1500–1900

a Subsumed under soldiers and sailors for the period 1500–1800. The numbers for the nineteenth century are composed of emigrants to the colonies (Martin Bossenbroek, Volk voor indië: de werving van Europese militairen voor de Nederlandse koloniale dienst 1814–1909, Amsterdam: Van Soeren, 1992, p. 278; Ulbe Bosma, ‘Sailing through Suez from the South: the emergence of an Indies–Dutch migration circuit, 1815–1940', International Migration Review, 41, 2007, pp. 511–36), to the Americas (C. A. Oomens, ‘Emigratie in de negentiende eeuw', in De loop der bevolking van Nederland in de negentiende eeuw, The Hague: CBS, 1989), and to Germany (Jan Lucassen, ‘Dutch long distance migration: a concise history 1600–1900', IISG Research Papers, Amsterdam: IISG, 1993).
b To compare Dutch figures with European ones, we have used the method by which the growth of one city can be annulled by the decrease of another.
General note: Immigrants from abroad are not listed separately because the great majority (including refugees) settled in cities and are subsumed in the urban numbers.
Sources: Bairoch, Cities, pp. 53–4; Bossenbroek, Volk voor Indië, p. 278; de Vries, European urbanization, pp. 30, 203; de Vries and van der Woude, Nederland 1500–1815, p. 71; Jan Lucassen, ‘The Netherlands, the Dutch, and long-distance migration in the late sixteenth to early nineteenth centuries', in Canny, Europeans on the move, p. 181; Jan Lucassen, ‘Immigranten in Holland 1600–1800: een kwantitatieve benadering', Amsterdam: CGM Working Papers, 2002; Ulbe Bosma, ‘Sailing through Suez; Dutch Census of 1899.
This island of extremely high mobility in the period 1550–1750 was part of a wider North Sea system that contrasted sharply with the rest of Europe.Footnote 78 High mobility rates in the Dutch Republic, the core of the North Sea system, show the emergence of an international labour market with high wages, which exerted a large demand for labour, both seasonal and permanent. Thus, we may consider the situation in the Dutch Republic as an early precursor of more general European mobility patterns that emerged more than a century later, characterized by a large percentage of proletarians, a free labour market, high levels of urbanization, and excellent transportation networks.Footnote 79 In other words, this was a situation that would extend over the industrialized parts of Europe in the second half of the nineteenth century, at a time when the Netherlands had sunk below the European average.
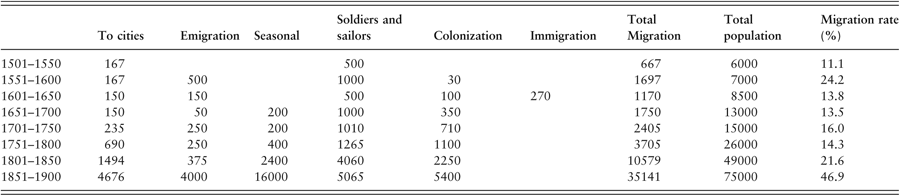
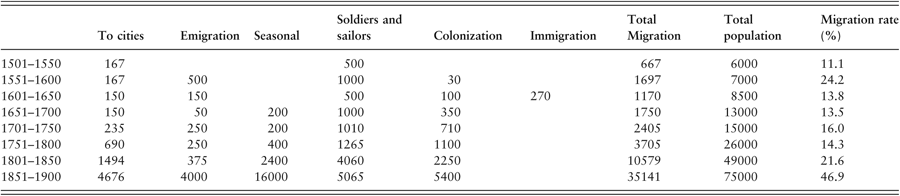
The extraordinary nature of the early modern Dutch situation is highlighted by comparison with Russia (see Table 7 and Figure 12). In the latter case, migration rates were somewhat below those in north-western Europe and only clearly surpassed the European average after 1850, when all forms of migration boomed. At the same time, the Russian case shows that eastern Europe, with its ‘feudal’ regime, was much less static than one might think. Migration rates may be in another league than the most dynamic part of Europe but they are not far below the European average. Moreover, the Russian case demonstrates that migration patterns were not only caused by proletarianization, wage labour, and commercialization but also by factors independent of economic developments. Russian state formation led to colonization and military migration, while the weaknesses of the Russian state allowed for Kalmyk immigration and slave raids. Only with the abolition of serfdom in 1861 did seasonal migration, long-distance emigration to the Unites States and Siberia, and city-bound migrations expand dramatically, surpassing the European average by more than 10%.Footnote 80
Migration rates (%) in Russia and the Netherlands, 1500–1900.

Total migration (000s) and migration rates for European Russia, 1500–1900
Sources: Bairoch, Cities, pp. 60–5; de Vries, European urbanization, pp. 30, 203; Richard Hellie, ‘Russland und Weissrussland', in Bade et al., Enzyklopädie, p. 315; R. Cameron, Concise economic history of the world, New York: Oxford University Press, 1993, p. 193; Willcox, International migrations; Hoerder, Cultures in contact, pp. 311–12; Hellie, ‘Migration', p. 317; Moon, ‘Peasant migration', pp. 863, 867; Moon, ‘Peasant migration, the abolition of serfdom', p. 347; Fedor, Patterns, pp. 183–214, 126.
Conclusion
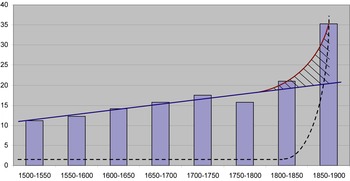
The outcome of our attempt to reconstruct migration rates for Europe in the period 1500–1900 sheds new light on the discussion surrounding Zelinsky's ‘mobility transition’. By assuming a causal relationship between the Industrial Revolution and mobility, Zelinsky believed that early modern Europe was a fairly static and sedentary society. Historians working on the early modern period, as well as those who study the nineteenth century, have convincingly dismissed his static picture of the period before 1800, pointing out that Europeans were highly mobile long before the modern era. However, because of their concentration on relatively short periods and small parts of Europe, their figures differ from ours.Footnote 81 Our reconstruction, partial and preliminary as it may be, is unequivocal about the fact that Europe was indeed much more mobile than modernization scholars have realized. At the same time, one might be tempted to deduce that Zelinsky deserves more merit than most migration historians (ourselves included) have granted him. As Figure 13 shows, there was indeed a sharp jump in the level of migration after 1850.
Migration rates, 1500–1900.
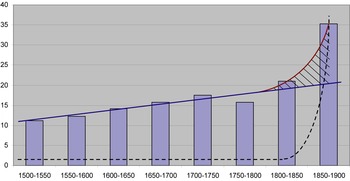
This increase in migration rates, however, was not so much caused by the ‘modernization process’, a paradigm dominant since the birth of the social sciences at the end of the nineteenth century. At most, the jump after 1850 should be considered primarily as an acceleration of cross-community migration. This was facilitated by cheaper and faster transport, which dramatically increased possibilities for people to find permanent and temporary jobs farther away from home, notably in an Atlantic space. We conclude that it was not the underlying structural causes of migration that changed but rather its scale. This scale effect is visualized in the shaded triangle in Figure 13.
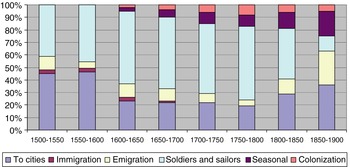
The fatal attraction of the mobility transition idea is quite understandable. The period 1850–1900 was indeed spectacular. In order to understand why migration in the second half of the nineteenth century is regarded as extraordinary and unprecedented, it is useful to differentiate between its various expressions. As Figure 14 shows, there was a major shift from migration dominated by the movement of soldiers and sailors, up to 1850, to migration dictated by movements to cities and to other continents, which caught the eye of both contemporaries and later scholars.
The share of migration types in the total migration rate (%), 1500–1900.

In particular, the share of migration to cities – at a high point in the sixteenth century – surged again from 1750, with only 23 European towns of over 100,000 inhabitants in 1800, compared to 135 a century later. Moreover, the share of mass emigration tripled in comparison with the preceding period, the bulk going to the Americas. It was these two manifestations of migration, in particular, that led to a peak in the second half of the nineteenth century that Zelinsky and others interpreted as the ‘mobility transition’, unaware of a significant iceberg below the surface.
Another way of understanding the impact of migration on European societies is to break down the data we have presented into smaller geographical entities. As the comparison between the Netherlands and Russia demonstrated, levels of migration differed greatly within Europe and seemed to follow the pattern of a ‘little divergence’, which set north-western Europe apart from the rest in terms of economic development. The high level of migration in the Netherlands before 1800 fits well with the broader economic picture of advanced urbanization, commercialization, proletarianization, and more smoothly functioning institutions.Footnote 82 Together with southern England, especially London, the Dutch Republic (notably its coastal strip) experienced a consistently high migration rate during the seventeenth and eighteenth centuries.
At the other end of the ‘little divergence’ spectrum, we chose Russia, with its low migration rates, low urbanization, serfdom until 1861, and very slow economic development. Surprisingly, our analysis shows that migration was not solely determined by economic performance. Until the nineteenth century, Russian migration rates were much lower than in the Netherlands but not much below the European average. Nor did unfree labour systems automatically curb migration. Many people were mobilized as soldiers or slaves, and large numbers of serfs migrated with special permits over long distances to work in the cities or in colonized parts of the expanding Russian empire.
Our data also underline the importance of state formation and the mobilizing role of armies. Even in the Dutch Republic, migration of soldiers was an important factor and weighed heavily in overall rates of migration (Table 6). More detailed comparative studies of migrations are necessary between regions characterized by ‘high coercion and low capital’ and those with ‘high capital and low coercion’, to use Tilly's analytical framework.Footnote 83 This would show the relationship between migration, state formation, war, and economic development. Our analysis shows that the fiscal–military state had significant consequences for mobilizing part of Europe's male population, which led us to speak of a fiscal labour-migrants’ state.
Although we realize that this article is only a preliminary step on the road to a full understanding and mapping of migration patterns in Europe, we think that it is also relevant for understanding other parts of the world.Footnote 84 In Patrick Manning's conception, cross-community migrations are an engine of human development.Footnote 85 Consequently, migration rates might explain different development patterns in various parts of the world. How evidence on migration ratios might add to important debates on such patterns in the field of global history can be illustrated by the ‘Great Divergence’ discussion that has had world history in its grip since Pomeranz's groundbreaking book was published in 2000. Pomeranz's book is a useful starting-point because he explicitly deals with migration, arguing that early modern Europe did not perform significantly better than China in terms of the mobility of labour. The Chinese state was much more successful than its European counterparts in facilitating mass migration to areas where the land-to-labour ratio was high, with over ten million Chinese settling as colonists over long distances in the seventeenth and eighteenth centuries.Footnote 86 In terms of this specific indicator, Pomeranz is right. Ten million colonists between 1600 and 1800 produces a migration rate of almost 1.8%, against only 1% for Europe (Figure 14).
We expect, however, that Chinese performance will be considerably lower than that of Europe for other indicators. Pomeranz, for example, admits that ‘proletarian migration’ was much more difficult in China and that very few women could migrate by themselves.Footnote 87 This is in tune with Bin Wong's conclusion that semi-proletarianized Chinese peasants often retained their ties to the land, limiting migration patterns and the spatial dimensions of labour markets.Footnote 88 These important observations connect to recent debates on the nature of migration in China and deserve more and rigorous attention.Footnote 89
Finally, we think that our formal method for measuring cross-community migration, developed on the basis of the European case, can function as a universal method for making global comparisons that go beyond the specific contrast between economic growth in Europe and China. We hope that this method will provoke new questions and more detailed research with respect to a wide range of economic, social, and cultural topics that are of interest to global historians.