


Introduction
Internal tephra layers have been used to date ice cores and to estimate past specific net balance rates in glaciers and ice caps (Reference Hammer, Clausen, Dansgaard, Gundestrup, Johnsen and ReehHammer and others, 1978; Reference SteinthórssonSteinthórsson, 1978; Reference KarlöfKarlöf and others, 2000; Thorsteinsson and others, 2003). A single core can give high-resolution data at a specific position, but mapping of tephra layers over large areas can provide information about the spatial variations of the glacier mass balance.
In the Vatnajökull and Mýrdalsjökull ice caps, Iceland, internal tephra layers of known age have been detected by radio-echo soundings. These layers were deposited on the ice-sheet surface during volcanic eruptions and subsequently buried in the accumulation area and deformed during the ice flow. These isochrones provide information on past strain rates, ice movements and spatial distribution of the specific net balance (Reference Nereson, Raymond, Jacobel and WaddingtonNereson and others, 2000; Reference Baldwin, Bamber, Payne and LayberryBaldwin and others, 2003).
We apply a steady-state flowline model outlined by Reference ReehReeh (1989) to derive the specific net balance pattern matching the spatial depth distribution of the internal time markers. Inputs to the model are the ice thickness and the horizontal convergence or divergence along the flowline.
Site Description and Field Data
Mýrdalsjökull and Vatnajökull are situated in the southern part of Iceland (Reference BjörnssonBjörnsson, 1980, Reference Björnsson1988, Reference Björnsson2002; Reference Björnsson, Pálsson and GuðmundssonBjörnsson and others, 2000). The region has a maritime climate with low summer temperatures and heavy precipitation (ranging from 2500 to >4200mma–1 (Reference Eythorsson, Sigtryggsson and TuxenEythórsson and Sigtryggsson, 1971)). The ice caps are dynamically highly active and they change rapidly with climate variations (Reference BjörnssonBjörnsson, 1980; Jóhannesson and Reference SigurðssonSigurðsson, 1998; Reference SigurðssonSigurðsson, 1998). The ice caps are situated in a region of high volcanic activity and the ice is rich with volcanic fallouts that have been used to date the ice (Reference SteinthórssonSteinthórsson, 1978; Reference Larsen, Gudmundsson and BjörnssonLarsen and others, 1996, Reference Larsen, Gudmundsson and Björnsson1998).
The two ice caps have been mapped by radio-echo sounding, and digital elevation models have been produced of both the glacier surface and the bedrock (Reference BjörnssonBjörnsson, 1988; Reference Björnsson, Pálsson and GuðmundssonBjörnsson and others, 2000). Internal reflections caused by tephra layers have been mapped. The internal reflections that have been traced to specific volcanic eruptions have been used as internal time markers along selected flowlines. The time marker on Mýrdalsjökull is the tephra layer of the 1918 Katla (Iceland) eruption.
On Vatnajökull, specific net balance measured at stakes in the 1990s has been used as input to the model (Reference Björnsson, Pálsson, Guðmundsson and HaraldssonBjörnsson and others, 1998), together with accurate dating of the uppermost tephra layers (first 120 m) of a 400 m deep core drilled at Bárdarbunga in 1972 (Reference SteinthórssonSteinthórsson, 1978). Our model suggests a revised age–depth distribution in the lower part of the core.
Method
The theoretical model used is based on work by Reference ReehReeh (1989) and Reference BrandtBrandt (2001). The notation used in this paper is as far as possible that of Reference ReehReeh (1989). The model is a steady-state flowline model, taking into account the effect of varying ice thickness and horizontal divergence or convergence along the flow. Given the flowline geometry and the isochrones, we seek, by trial-and-error iteration, the surface net balance pattern that can best reproduce the age–depth distribution. In its current state, the application of the model is limited to the upper part of the ice column where the horizontal ice velocity can be assumed constant with depth.
Conservation of Mass, Particle Path, Layer Thickness, Age–Depth Profiles and Isochrones
For a curvilinear coordinate system, Reference ReehReeh (1989) writes the solution of the differential continuity equation as:

where q is the flux per unit width, R the radius of curvature of the topographic contour lines intersecting with the flowline, b the net balance rate, x the distance along the flowline and Can arbitrary constant determined by boundary conditions that in our case equals zero.
The specific net balance rates along the flowlines have been described as a third-degree polynomial to make calculations feasible and reasonably flexible:

The constants a 0 ,…,a 3 are adjusted to describe the specific net balance pattern along the flowline.
Assuming constant divergence or convergence along the flowline, rewriting the radius of curvature as R(x) = x/m, where m = 0, thus corresponds to plane flow and m = 1 radial flow from a circular dome; and inserting the net balance rate (Equation (2)), the ice flux along the flowline can be expressed as

In a steady-state model a particle path describes a flowline. A particle deposited at the surface position x1 in the accumulation zone is at time t = t2
at the position x2 and at height h above the bed. Following Reference ReehReeh (1989), we use non-dimensional vertical and height coordinates defined as
 and
 respectively, where B(x) and H(x) are the height of the lower surface and the ice thickness, respectively, and z and h are the vertical height and the height above the glacier sole, respectively. Based on mass conservation for a flow tube in a curvilinear coordinate system, particle paths within the accumulation zone can be expressed (Reference ReehReeh, 1989):
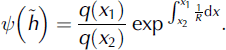
Solving Equation (4) with respect to
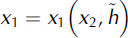 the original horizontal deposition position can be found of a particle now at height h and position X2. The original surface position is thus dictated by the ice flux q and the degree of convergence and divergence R, as well as by a shape function:
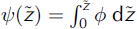 , which is coupled to the horizontal velocity-depth profile φ where
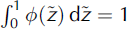 .
The observed time markers in our study are within the upper two-thirds of the ice thickness, where a constant vertical strain rate is a reasonable assumption. We therefore use a modified column flow (Reference Dansgaard and JohnsenDansgaard and Johnsen, 1969) that assumes constant horizontal velocity with depth down to a certain height above the bed and from there on linearly decreasing toward the bed. The shape functions can then be expressed for the upper part of the ice thickness (Reference ReehReeh, 1989):

where f is the ratio of the surface strain rate to the depth-average strain rate, and thus determines the shape of the flow functions. Inserting the shape functions (Equation (5)) and the ice flux (Equation (3)) at positions x 1 and x 2 in Equation (4), we obtain

This equation is solved numerically with the input parameters x2, α 0, …,α3, m, fand z, and gives the original surface position x 1 of a particle now at x2 and the vertical position z.
The original surface position x1 of a layer (calculated by Equation (6)), is used as input for estimating the deformation of the original layer (taken as the specific surface net balance). The layer thickness λ(x2, h2) is for the part of the ice column where the assumption of constant horizontal velocity with depth is valid (Reference ReehReeh, 1989),

Calculating the layer thickness λ over depth at position x 2 from the surface and down to the transition zone gives the annual-layer thickness-depth profile. As the age at a certain depth equals the number of overlying annual layers, the age-depth profile can be derived by integration over the annual-layer thickness profile.
The depth of isochrones is derived for a given net mass-balance pattern along the flowline by computing the age-depth profile in steps down-glacier along the flowline. The horizontal step size should not be larger than the typical ice thickness. The isochrones are then visualized by drawing lines between the point calculations by use of linear interpolation. The optimal net balance pattern that best fits the internal time markers is then found by trial-and-error iteration with different mass-balance forcing.
Test of Model Assumptions
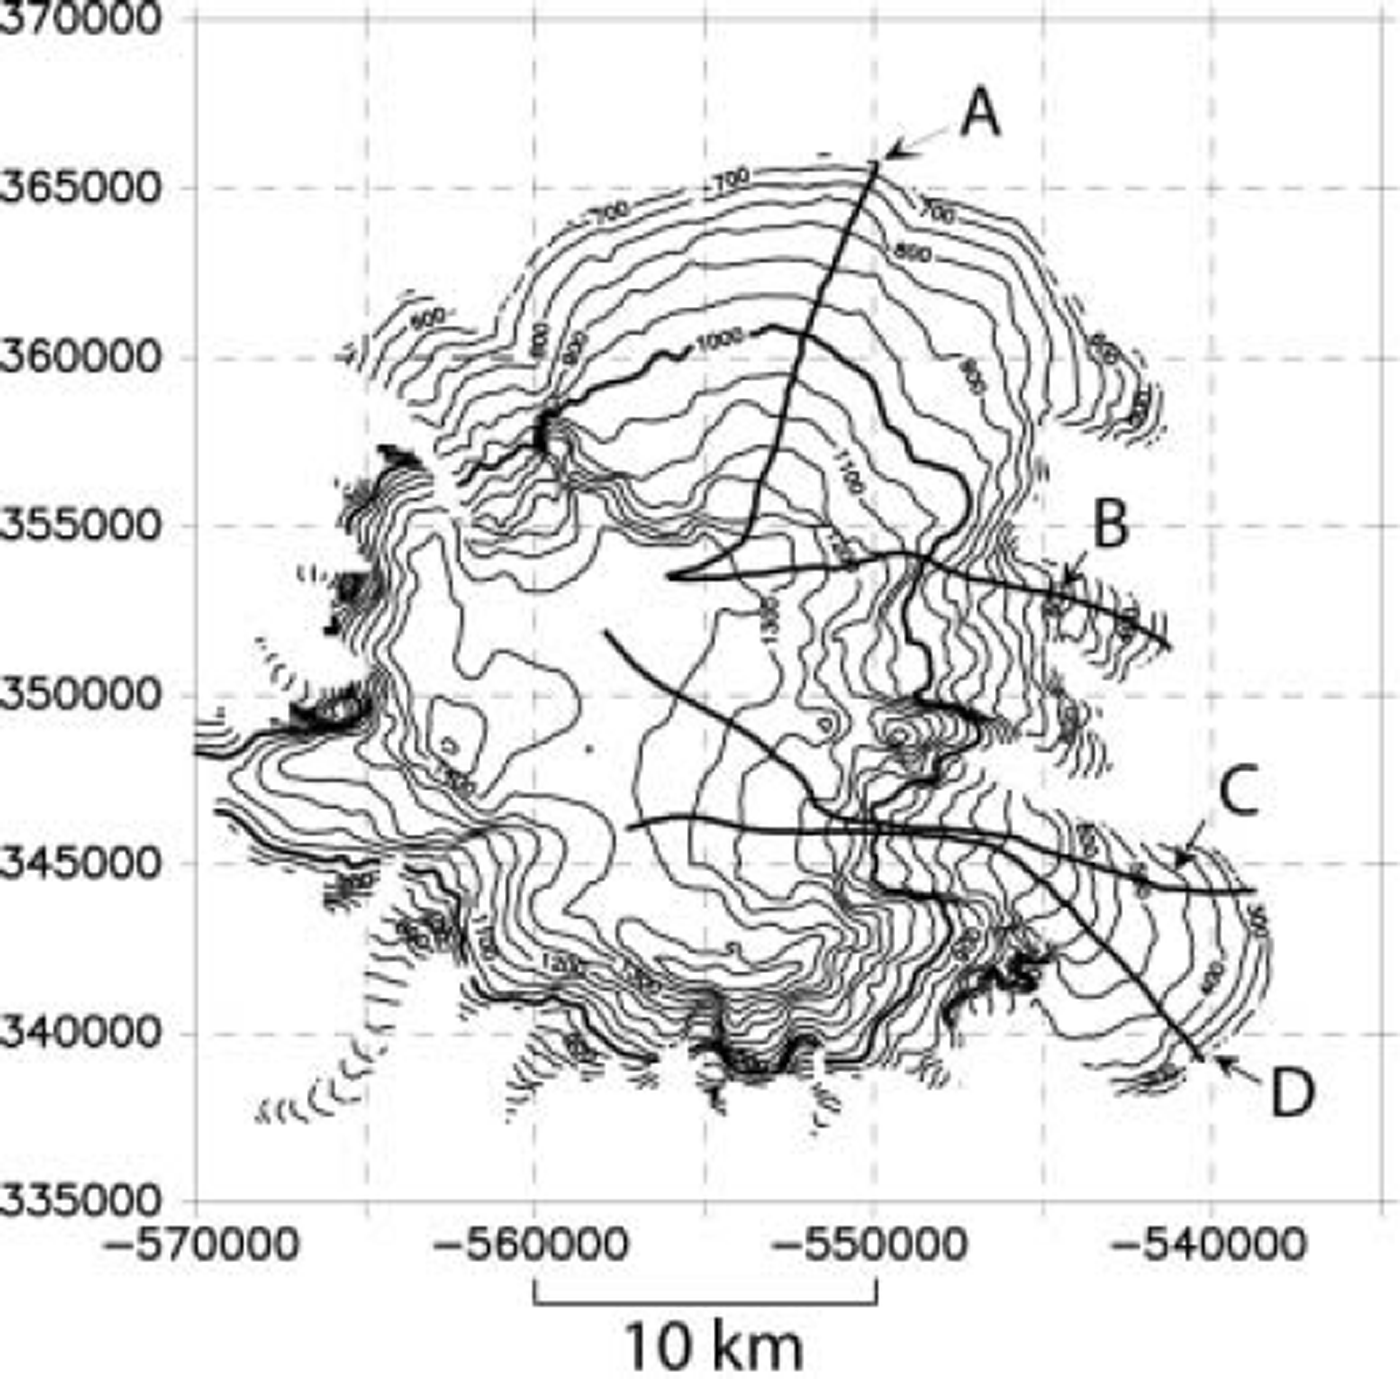
The assumption of steady state is crucial for this model, and therefore we consider the model sensitivity to variations that could violate this assumption. We have tested the reaction of flowline geometry and the response time, with a non-steady-state flowline model for flowline Con Mýrdalsjökull (Fig. 1).
Map showing Mýrdalsjökull and the location of the flowlines.
The response has been estimated for climatic step perturbations of different sizes by solving the continuity equation with a finite-difference numerical scheme (Reference PatersonPaterson, 1994; D. MacAyeal, http://homepages.vu-b.ac.be/∼phuybrec/pdf/MacAyeal.lessons.pdf):
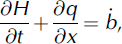
where t is time and the ice flux has been taken as q = Hu mean. The horizontal (over depth) mean velocity, u mean, has been expressed (Paterson, Reference Paterson1994):

In the equation, A isa constant and n the exponent in Glen’s flow law, ρ is the density of ice, g the gravitation, s the surface elevation and x the distance along the flowline. The scheme was run with a specific balance to develop a flowline reasonably close to the present state. The flowline was then disturbed with various stepwise mass-balance perturbations, giving an estimate of geometrical changes that may be expected within certain time frames. The response time was taken as the time to reach (1 − 1/e) ≈ 2/3 of the volume change from the original state to the new steady-state volume. The selected mass-balance perturbations were similar to those estimated during the last century on Vatnajökull ice cap (Reference SchelanderSchelander, 2000). The response time was calculated as 75 ±10years which is in good agreement with the timescale t r = Hmax/b Reference Jόhannesson, Raymond and WaddingtonJόhannesson and others, 1989; Reference PatersonPaterson, 1994). The response time is almost independent of the perturbations (up to 0.6 m a-1 step change), which suggest that the mass-balance feedback due to a change in elevation is not important for the study area.
The model predicts an elevation change of ±15 m within the area of the glacier where the flow model has been applied (Fig. 2). With the present-day net balance (3.5–4.5 m a-1), this elevation change would not significantly change the annual-layer thickness profile. However, the elevation change and velocity pattern are increasing when approaching the equilibrium line, and the model predictions become more questionable.
Cross-section of flowline C, Mýrdalsjökull. The observed bedrock and surface topography is marked with dashed lines, and the internal time marker by dots. The surface elevation change during build-up and after step perturbation is shown by solid lines.
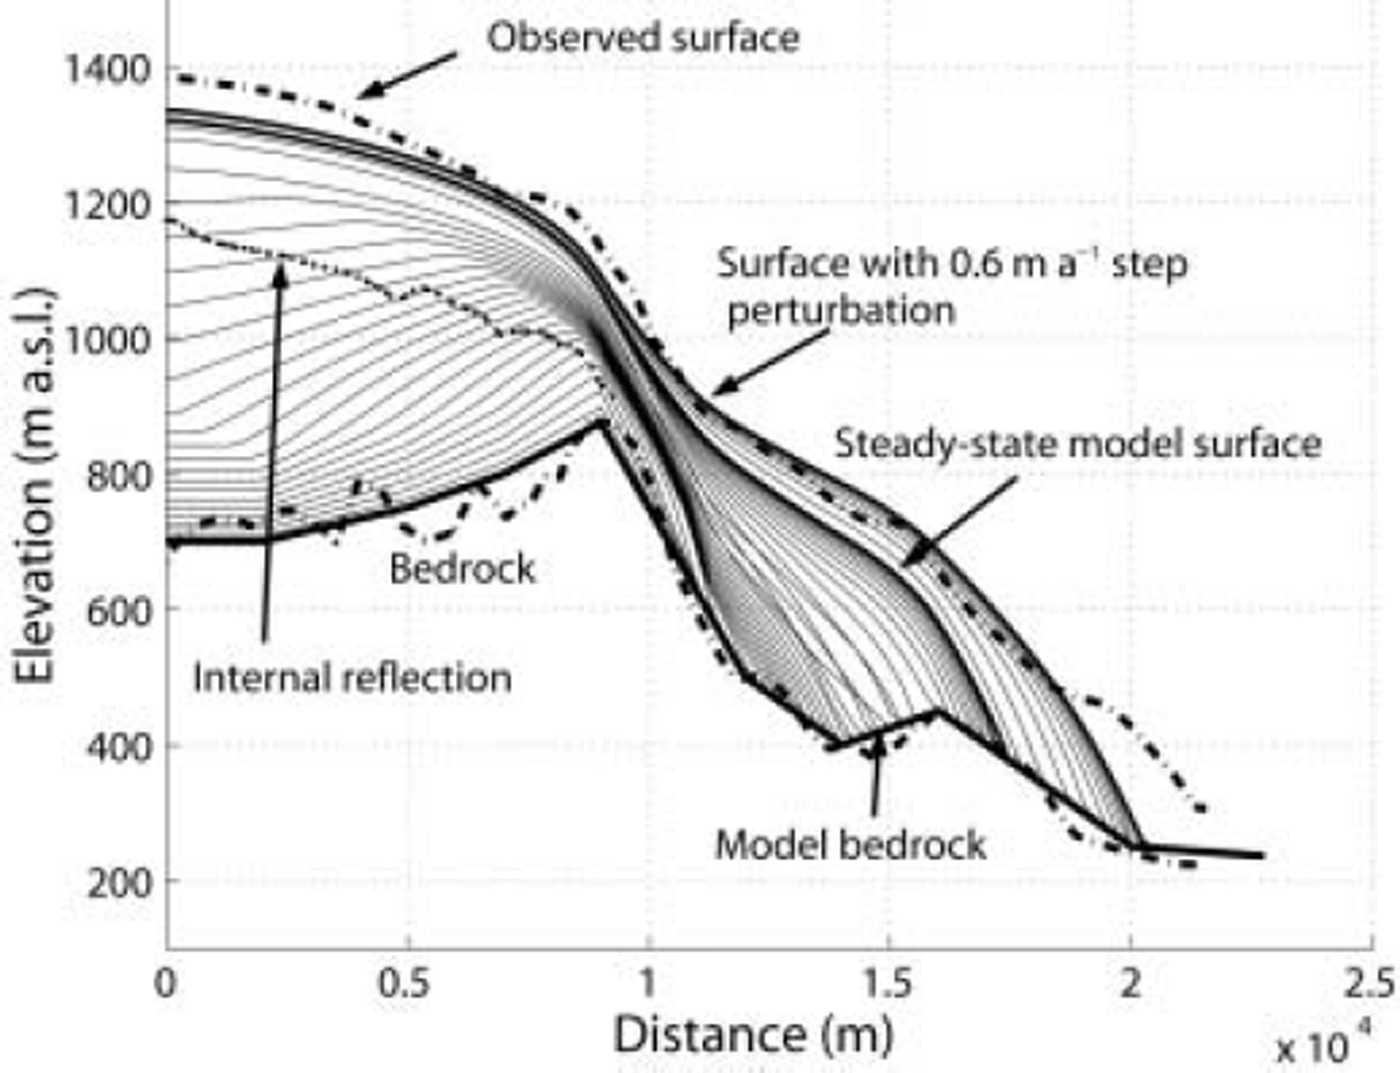
The model gives some striking differences between the surface topography derived from the continuity equation and the observed surface topography. This is probably a result of the one-dimensionality of the model which does not take into account horizontal convergence and divergence. For the first 8 km, an area with high convergence, the model solution shows a much lower surface than observed. In contrast, the modeled snout predicts a higher surface than observed due to the divergent flow. The difference in ice thickness at the ice divide for a theoretical axisymmetric dome and a non-divergent flow-line with the same geometry and ice characteristics was calculated as 0.79 by Reference Van der VeenVan der Veen (1999). That solution is based on several assumptions not fulfilled at Mýrdalsjökull, but gives an approximation of the magnitude that might be attributed to the divergence or convergence. Hence, we believe the geometric changes, as calculated with the finite-difference scheme with different mass-balance forcing, are reasonable, and thus, that the elevation changes in the study area will be small within the range of perturbations in the mass balance.
In most of the profiles the internal time marker appears slightly higher in the ice column within a distance of one horizontal ice thickness down-glacier from the ice divide. That feature is caused by increased longitudinal stresses at the very dome or ice divide (Reference RaymondRaymond, 1983; Reference ReehReeh, 1988; Reference Reeh and PatersonReeh and Paterson, 1988; Reference Nereson, Raymond, Jacobel and WaddingtonNereson and others, 2000). The stress field leads to increased vertical velocity in the uppermost layers, but rapidly decreasing with depth, causing the older isochrones to stay closer to the surface. The development of this strain pattern indicates that the ice divide has not migrated significantly since the layers were deposited.
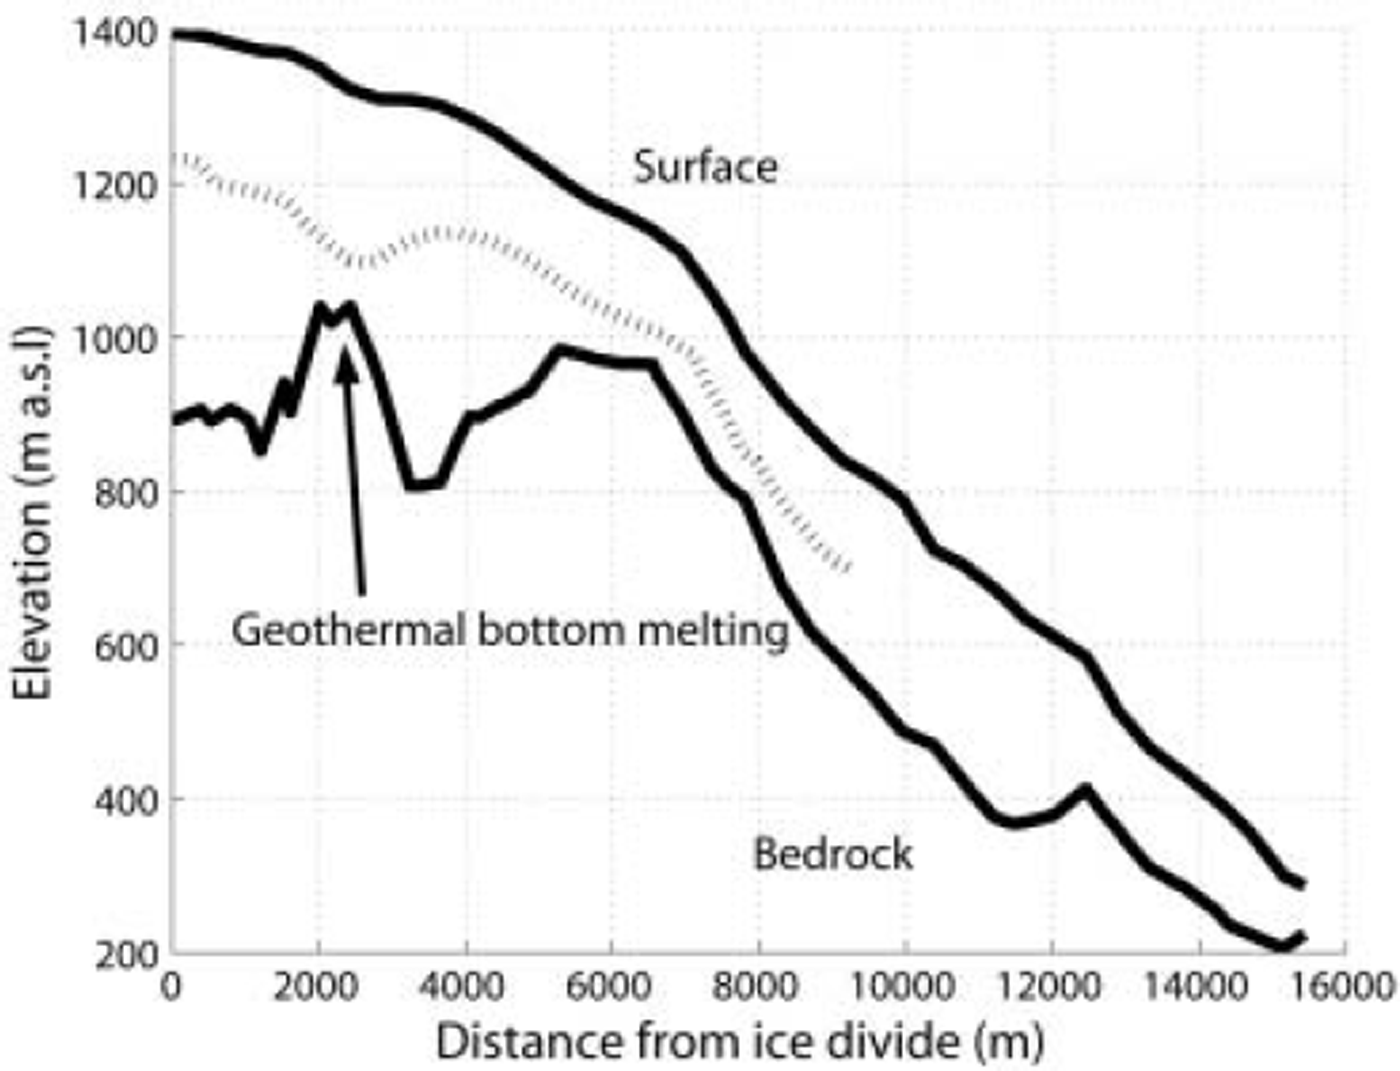
Basal melting due to geothermal activity at the caldera rim of Mýrdalsjökull sometimes creates depressions in the glacier surface and significantly changes the ice-flow pattern (Reference BjörnssonBjörnsson, 2002). Figure 3 shows a cross-section of flowline B where the internal time marker shows a depression 2 km from the ice divide. Due to bottom melting, the vertical strain rate will be smaller but there will be increased vertical velocity and the layers will appear lower in the ice column within a certain time-span, which might lead to model overestimation of the surface net balance. We have avoided areas where the internal time marker, when topographically mapped over the glacier, shows major local depressions that were not believed to be caused by or connected to bedrock geometry. Areas where surface depressions have been detected (Reference Björnsson, Pálsson and GuðmundssonBjörnsson and others, 2000) have also been rejected.
Cross-section along flowline B. The depression seen in the internal time marker (hatched line) is created by bottom melting at the caldera rim.
The deposition of tephra on the glacier surface affects albedo, but if thick it can insulate the glacier and reduce melting. In the accumulation area the tephra layers will be buried and only affect surface melting over a few years. For the typical mass balances and geometry on Mýrdalsjökull, the Katla 1918 tephra may have changed the depth of the isochrone layer by 7 ± 4 m if remaining 5years on the surface before being buried.
Areas with Large Ice-Thickness Gradients
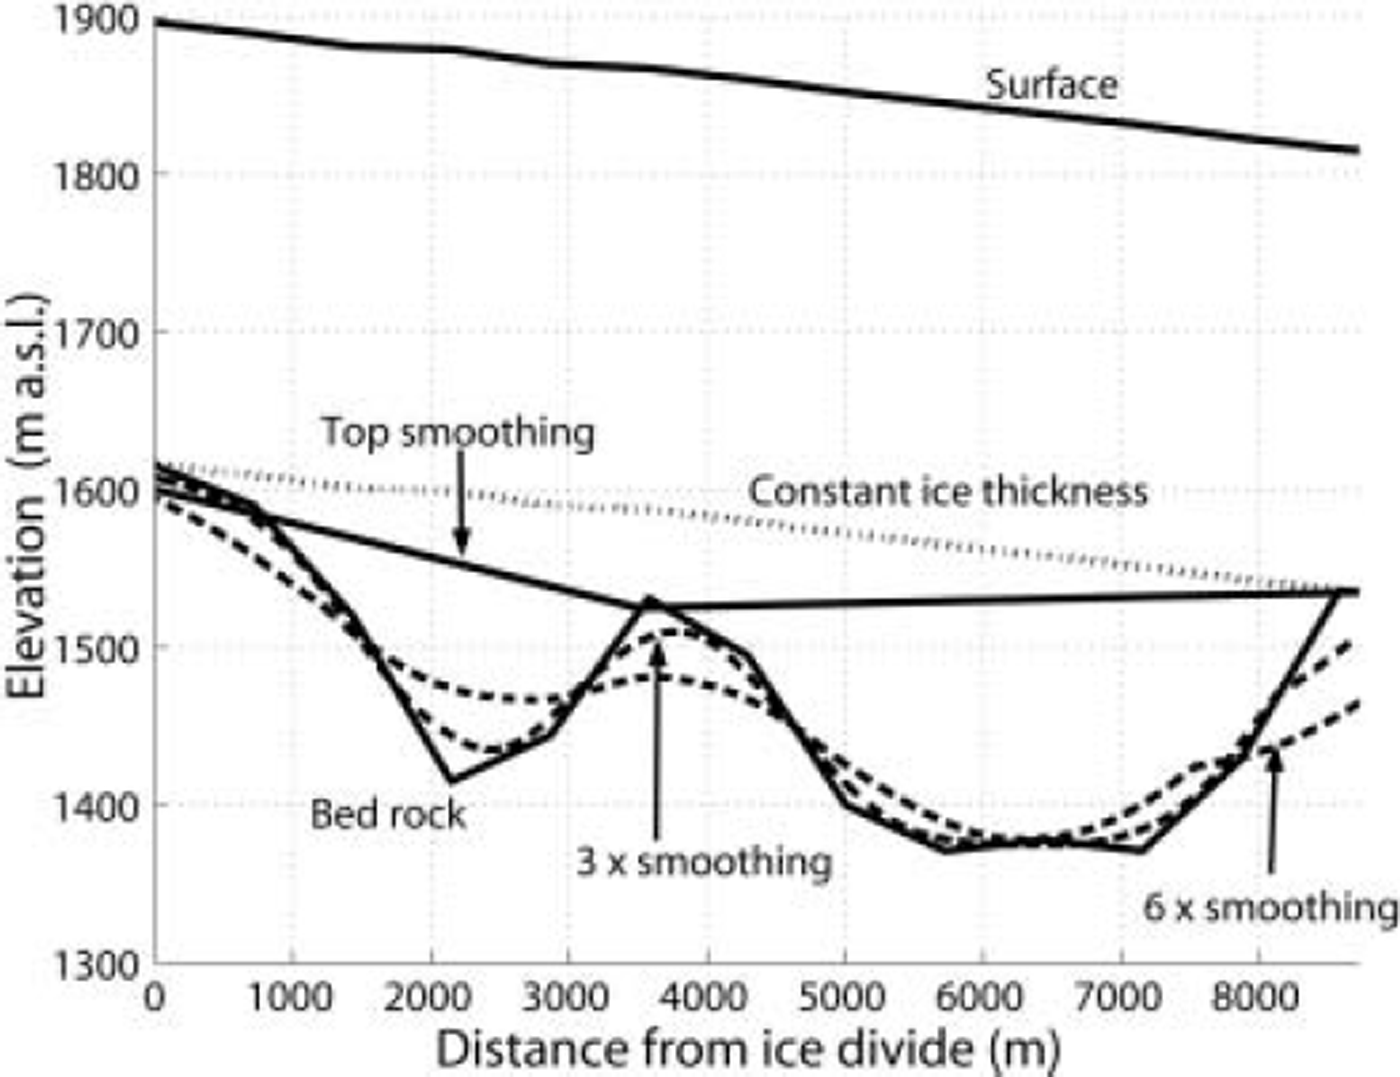
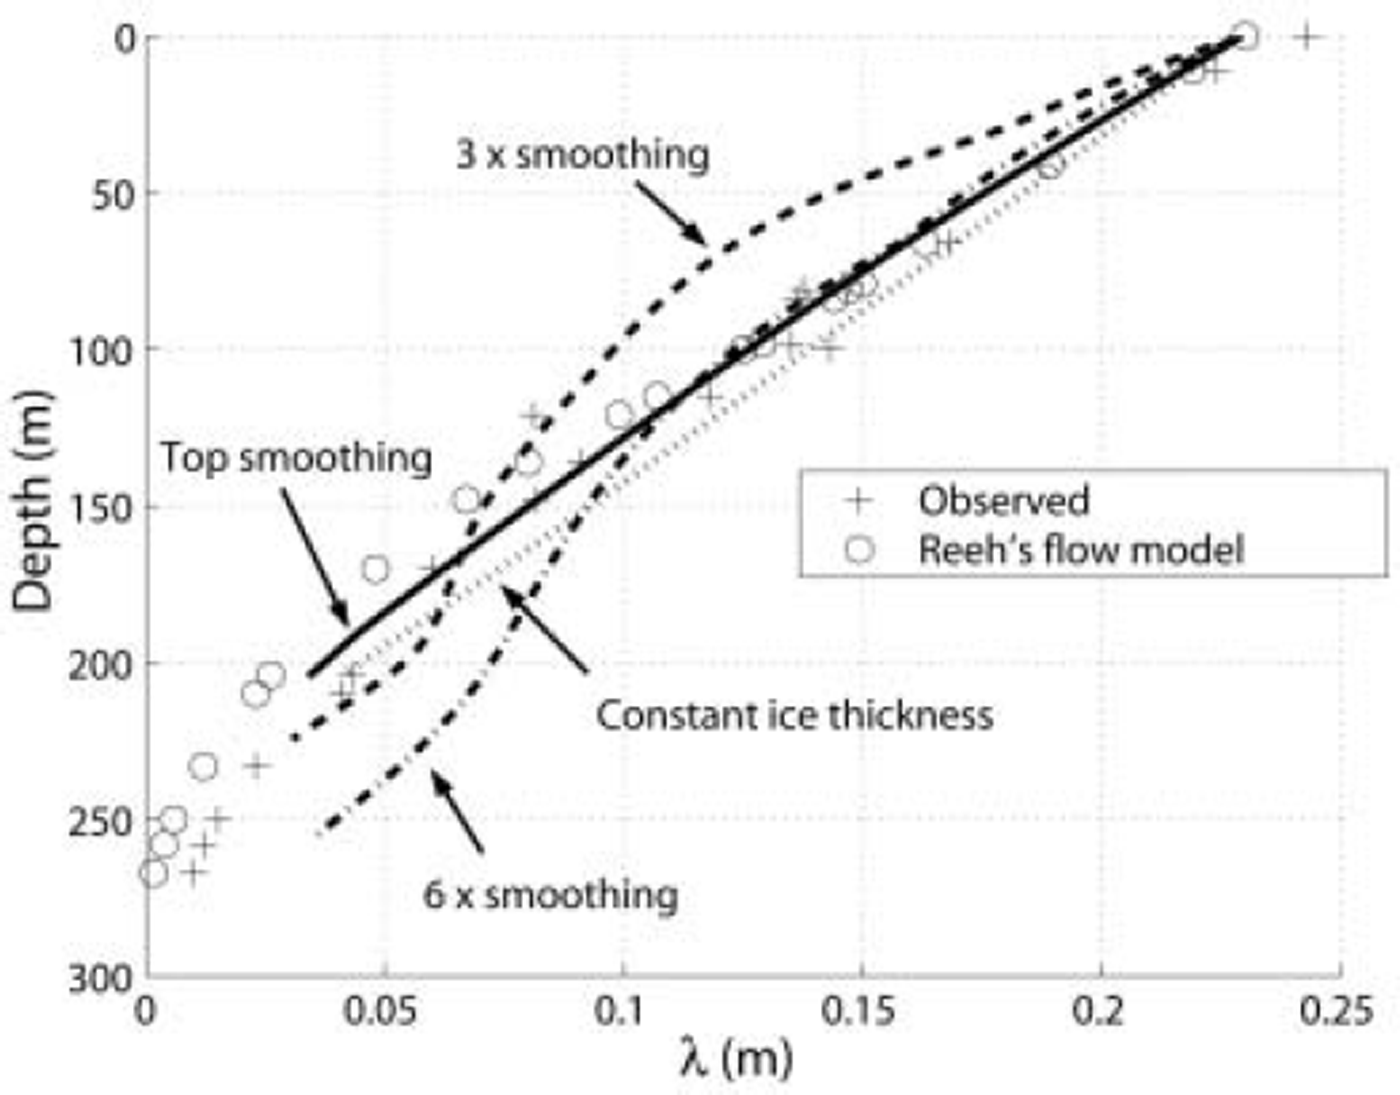
The model assumption of a constant shape function φ along the flowline is questionable for flowlines with large ice-thickness gradients. Areas with highly varying ice thickness should be avoided. All flowlines investigated in this study show bedrock undulations of the same magnitude as half the ice thickness. The model was tested and compared with ice-core data and another flowline model (Reference ReehReeh, 1988; Reference Reeh and PatersonReeh and Paterson, 1988). The bedrock has to be smoothed in order to give reasonable results. The smoothing indirectly adjusts the shape function φ to better fit the real flow pattern in the upper part of the ice column. The most efficient smoothing method was to simply fill in very deep sections where the ice may be assumed relatively stagnant. Figure 4 is reproduced from Reference Reeh and PatersonReeh and Paterson (1988) and shows the flowline together with our different test bedrocks. Figure 5 shows the annual-layer thickness observed in their ice core, their derived results and our results. The test shows that the assumption of a constant shape function φ is only valid in the upper part of the ice column when the bedrock has been properly smoothed. However, the comparison with the data from Devon Island, Canada, shows that filling out over-deepenings that are large compared to the ice thickness seems justified.
Cross-section of flowline on Devon Island, Canada, reproduced after Reference Reeh and PatersonReeh and Paterson (1988). The different bedrocks used as input to the model in this study are added. For discussion of the top smoothing see the text. The number denotes the degree of smoothing relative to the mean ice thickness.
Annual-layer thickness (A) profile reproduced from Reference Reeh and PatersonReeh and Paterson (1988) and the annual-layer thickness profiles derived in this paper with different bedrock smoothing.
Results and Error Analysis
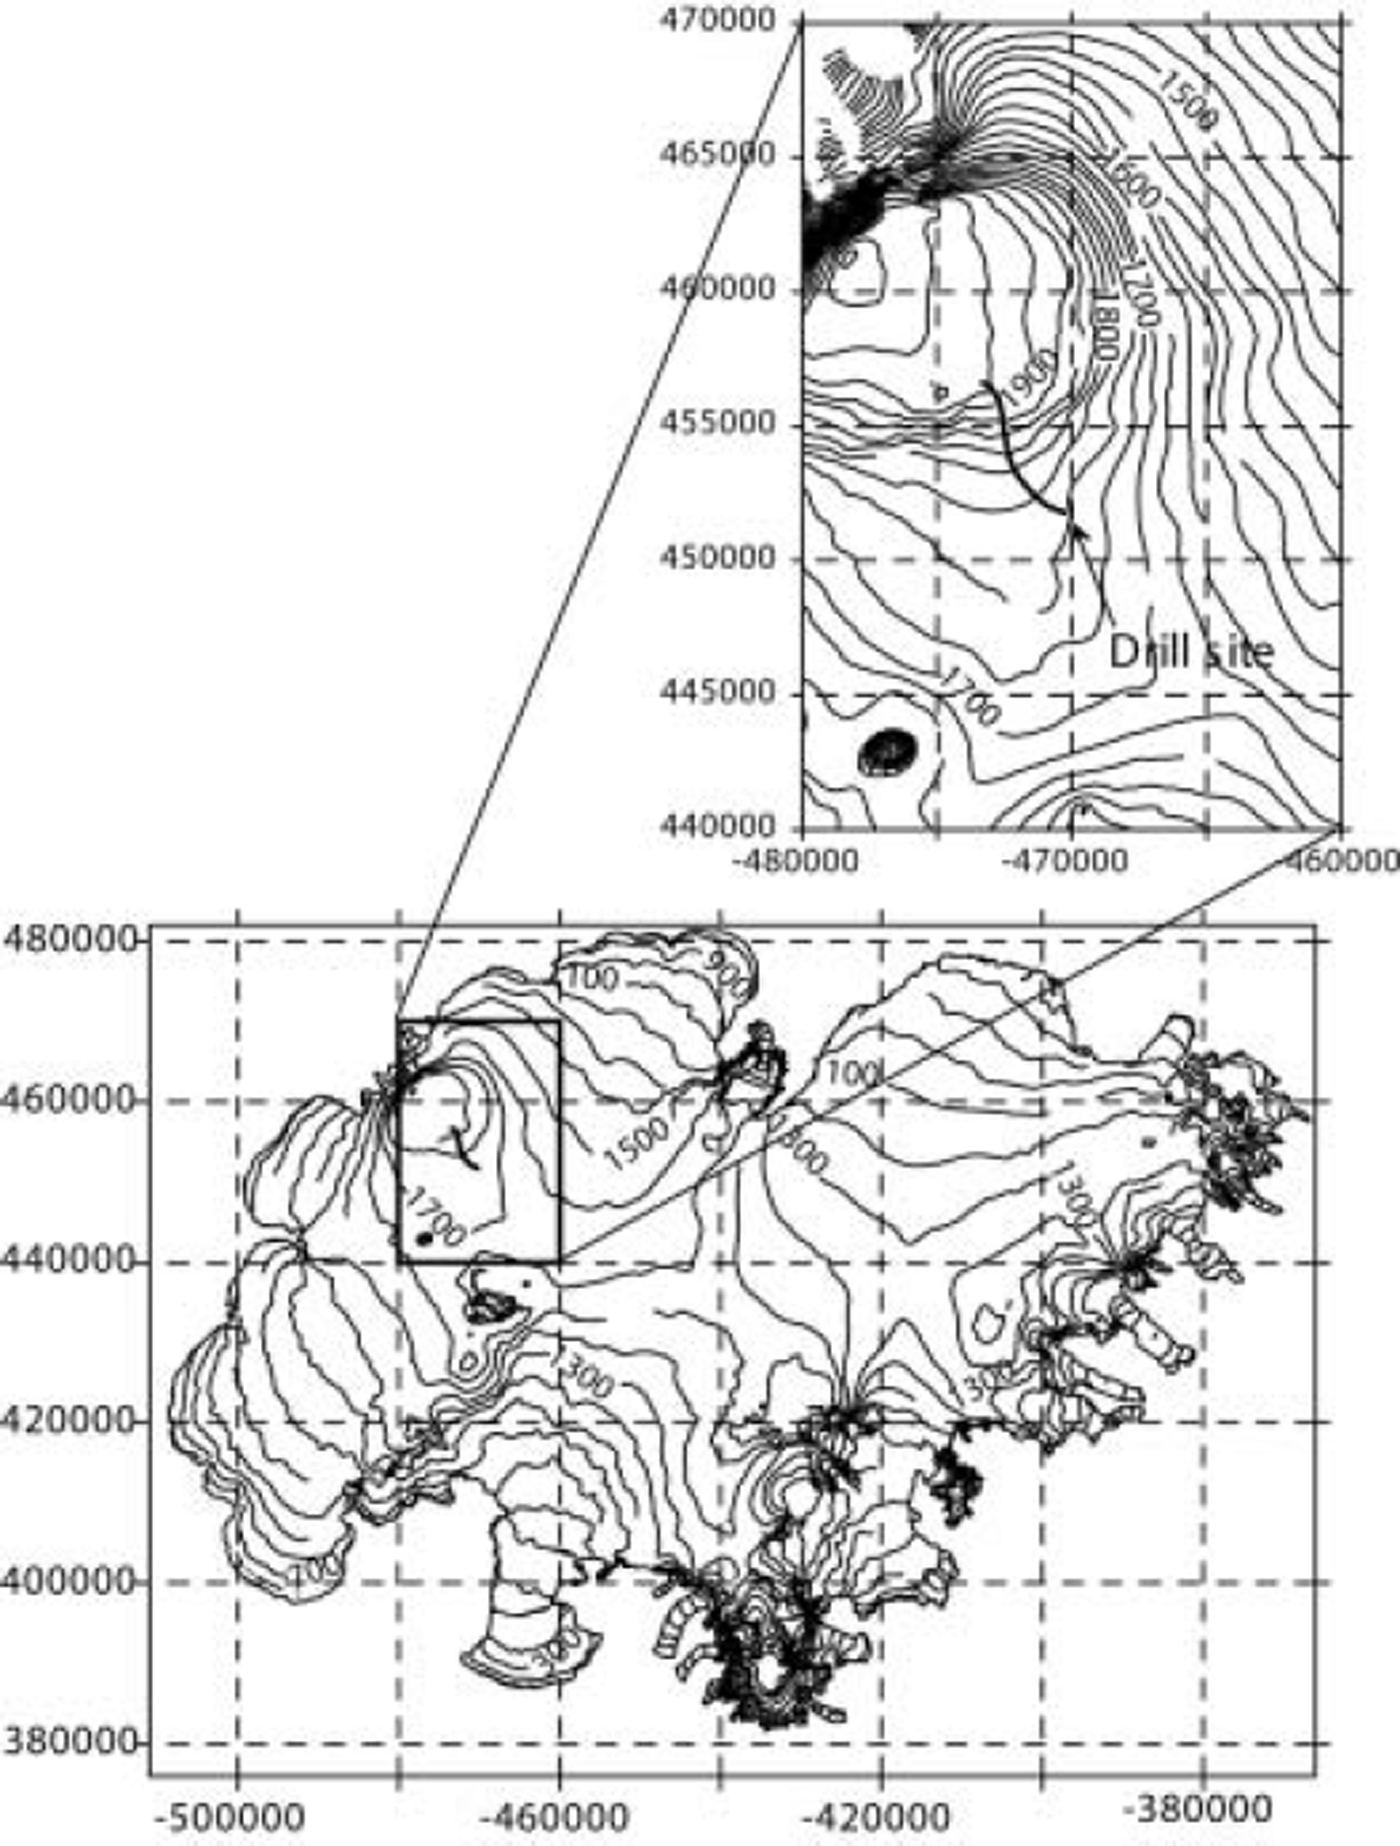
We have computed the balance for three flowlines on Mýrdalsjökull (Fig. 1) and one on Vatnajökull (Fig. 6). The sensitivity of various parameters was predicted by changing one parameter at a time. This shows that smoothing out bedrock irregularities where the ice is thick compared to the overall ice thickness (and hence the assumption of a constant shape function along the flowline) is critical in the model.
Map showing Vatnajökull and flowline leading down to the 1972 drill site. Scale in meters.
Mýrdalsjökull
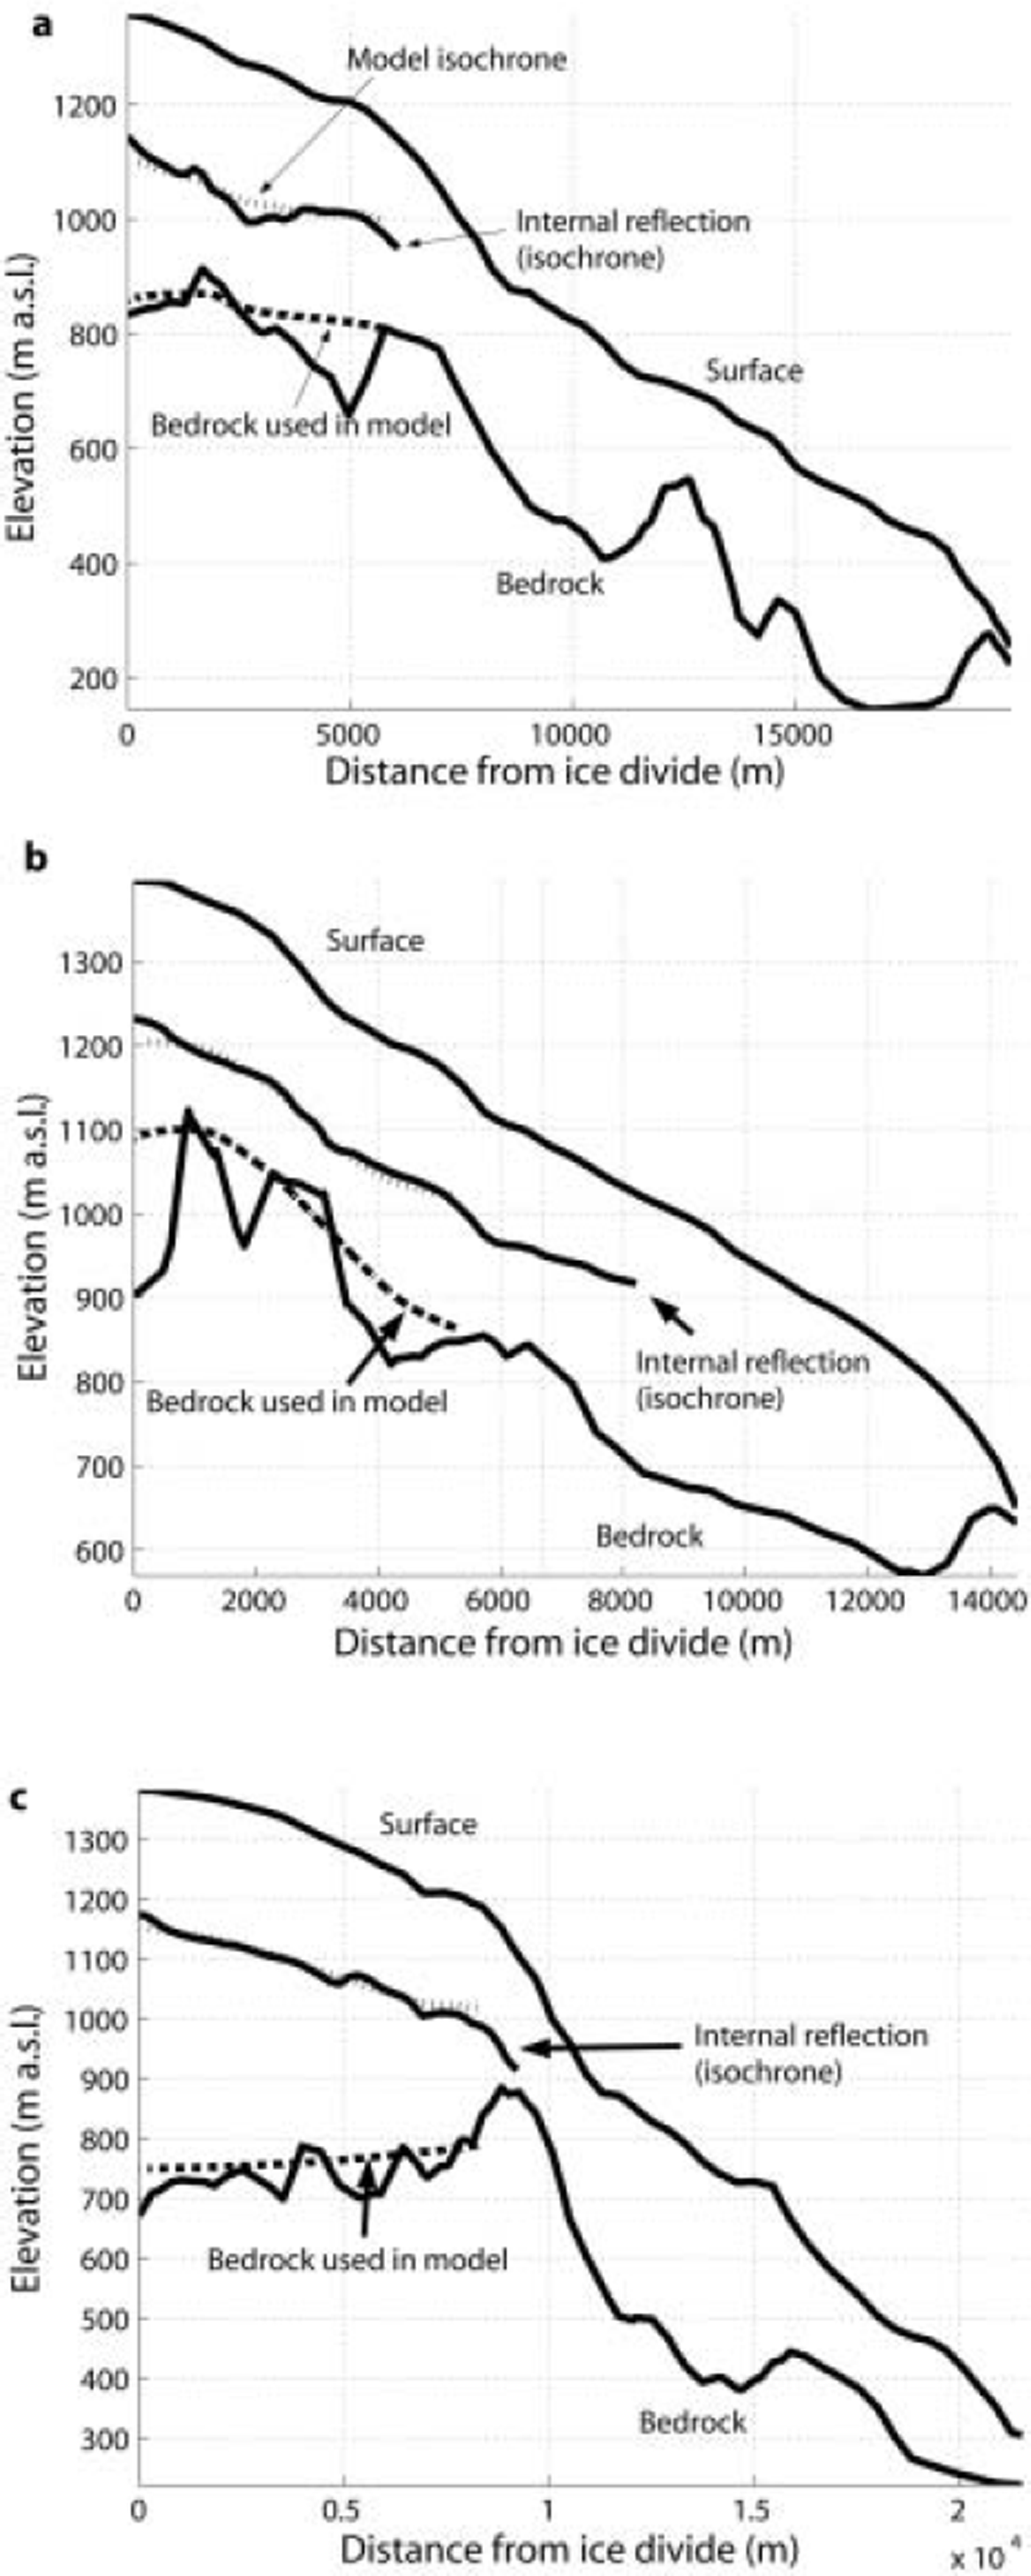
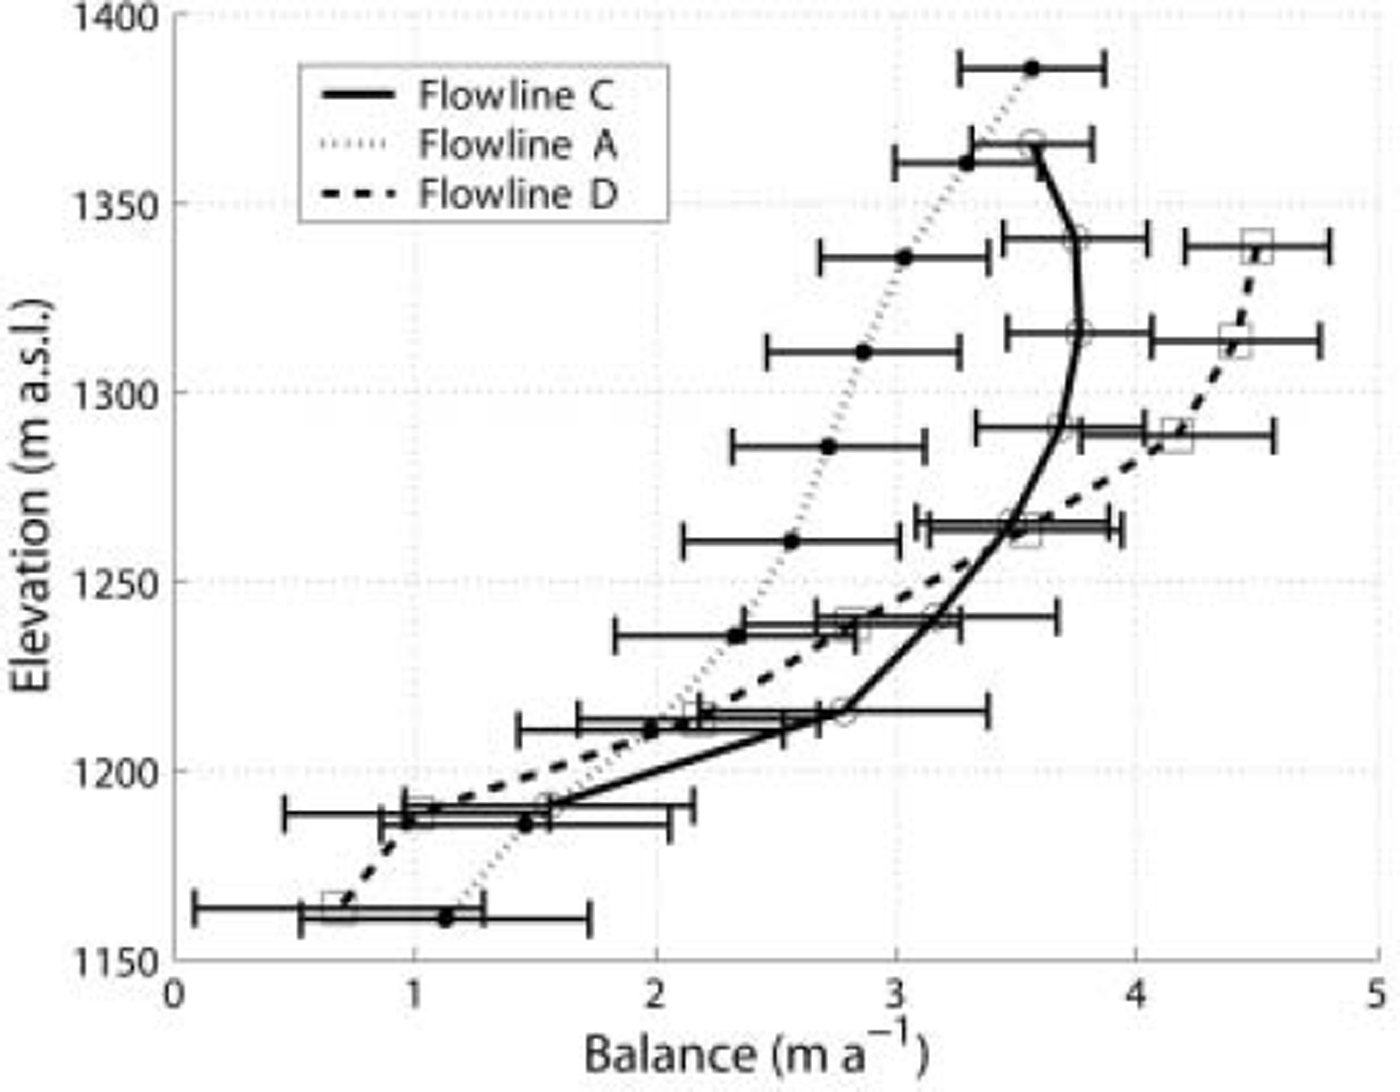
The specific net balance pattern required to reconstruct the depth of the tephra layer is different for the various flowlines. Figure 7 shows the flowlines together with the detected internal reflection and the modeled isochrone. The southernmost flowline (D) requires the highest net balance to reproduce an isochrone similar to the internal tephra layer. To reconstruct the internal tephra layer of the northernmost flowline (A) requires the lowest net balance values and the smallest mass-balance gradient with elevation. Flowline C (between flowlines D and A) shows balance values in between those of the two other flowlines. The computed balances and the expected accuracy are shown in Figure 8. The balance at the top of flowline D agrees well with an estimate of 4m a–1 reported by Reference SigfúsdóttirSigfúsdóttir (1964) for the nearby dome (1500 ma.s.l) and is further discussed by Reference Sigurðsson and JónssonSigurðsson and Jónsson (1995). Reference Mackintosh, Dugmore and HubbardMackintosh and others (2002) modeled the response of Sólheimajökull (outlet glacier to the south, starting at the dome) and used a reference balance profile representative for the period 1961-90 with a balance of ∼4ma at 1500 ma.s.l and 10 m of ice melt at 100 m a.s.l.
Cross-sections of flowlines D (a), A (b) and C (c). The surface, bedrock and internal reflection are shown by solid lines, while the model bedrock and model isochrone are shown by stippled lines.
The balance (water equivalent) as a function of elevation for flowlines A, C and D on Mýrdalsjökull. For discussion of error bars see the text.
Error analysis
The estimates of mass balances are subject to various errors. Shifting the smoothed bedrock up and down within the profiles on Mýrdalsjökull could lead to a change in net balance of ±0.5 m a-1 in the lower part of the profiles and ±0.3 ma- 1 closer to the ice divide.
Errors in surface, bedrock and internal reflection depths can be caused by digitations, radar precision and positioning problems. The relative accuracy of the depths is considered to be ±10m. This is in the same order of magnitude as the depth difference that could be attributed to uncertainty as to when the tephra layer actually was covered (7 ± 4 m).
Different net balance patterns were tested along the flowlines to test their sensitivity to the depth of the isochrones. Close to the ice divide, a perturbation of ±0.3 m a-1 can produce a 10 m vertical displacement of isochrones, while a forcing of ±0.6 m a-1 would be required close to the equilibrium line.
For the calculations, the depth of the firn layer and the density profile down to the tephra layer must be known. The choice of density-depth profile may produce inaccuracy. All calculations are done in ice equivalent and are afterwards recalculated to water equivalent, using a snow density of 400kgm–3 and an ice density of 900kgm–3. The depth down to a reflector must therefore be recalculated to ice equivalent depth before the model can be applied. The depth and the density profiles change spatially, but we believe the depth correction should be within ±5 m, which is slightly smaller than the accuracy in the depth positioning by the radar.
Vatnajökull
On Vatnajökull we investigate a flowline leading down to a 400 m deep drill core of 1972. The ice core recovered was dated by tephra stratigraphy (Reference SteinthórssonSteinthόrsson, 1978) by analyzing the chemical characteristics of the detected tephra layers, together with historical records of eruptions and fitting the data to a logarithmic timescale (Reference NyeNye, 1963). The ice thickness was assumed to be ∼500m during the dating but was later measured by radio echo as being 710 m (Reference BjörnssonBjörnsson, 1988).
We suggest a revised age-depth scale based on running the model with present balance measurements from stakes (Reference Björnsson, Pálsson, Guðmundsson and HaraldssonBjörnsson and others, 1998), known upstream bedrock topography including the effect of divergence and matching the age-depth scale within the upper 120 m (where the deformation of layers has been comparably small and the age is known from 1918 tephra of Katla in Mýrdalsjökull). The model agrees reasonably well with the original dating of the uppermost 200 m of the core, but at lower depths their divergence increases (Reference SteinthórssonSteinthόrsson, 1978). The revised timescale shows good agreement with the distance between dust layers, interpreted as annual layers in the lower part of the core (unpublished data of the Science Institute, University of Iceland). A lower vertical strain rate and thus thicker annual layers cause the age difference. The predicted timescale at the bottom of the core is about 90 years younger than suggested by the previous model. Figure 9 shows the age-depth scale (solid black line) compared with the dating of Reference SteinthórssonSteinthorsson (1978).
Suggested age-depth profile for the core drilled in 1972 at Bardarbunga and the original depth scale of Steinthorsson (1976). Stippled lines show the age-depth change caused by a ±0.25 m a-1 mean mass-balance forcing.
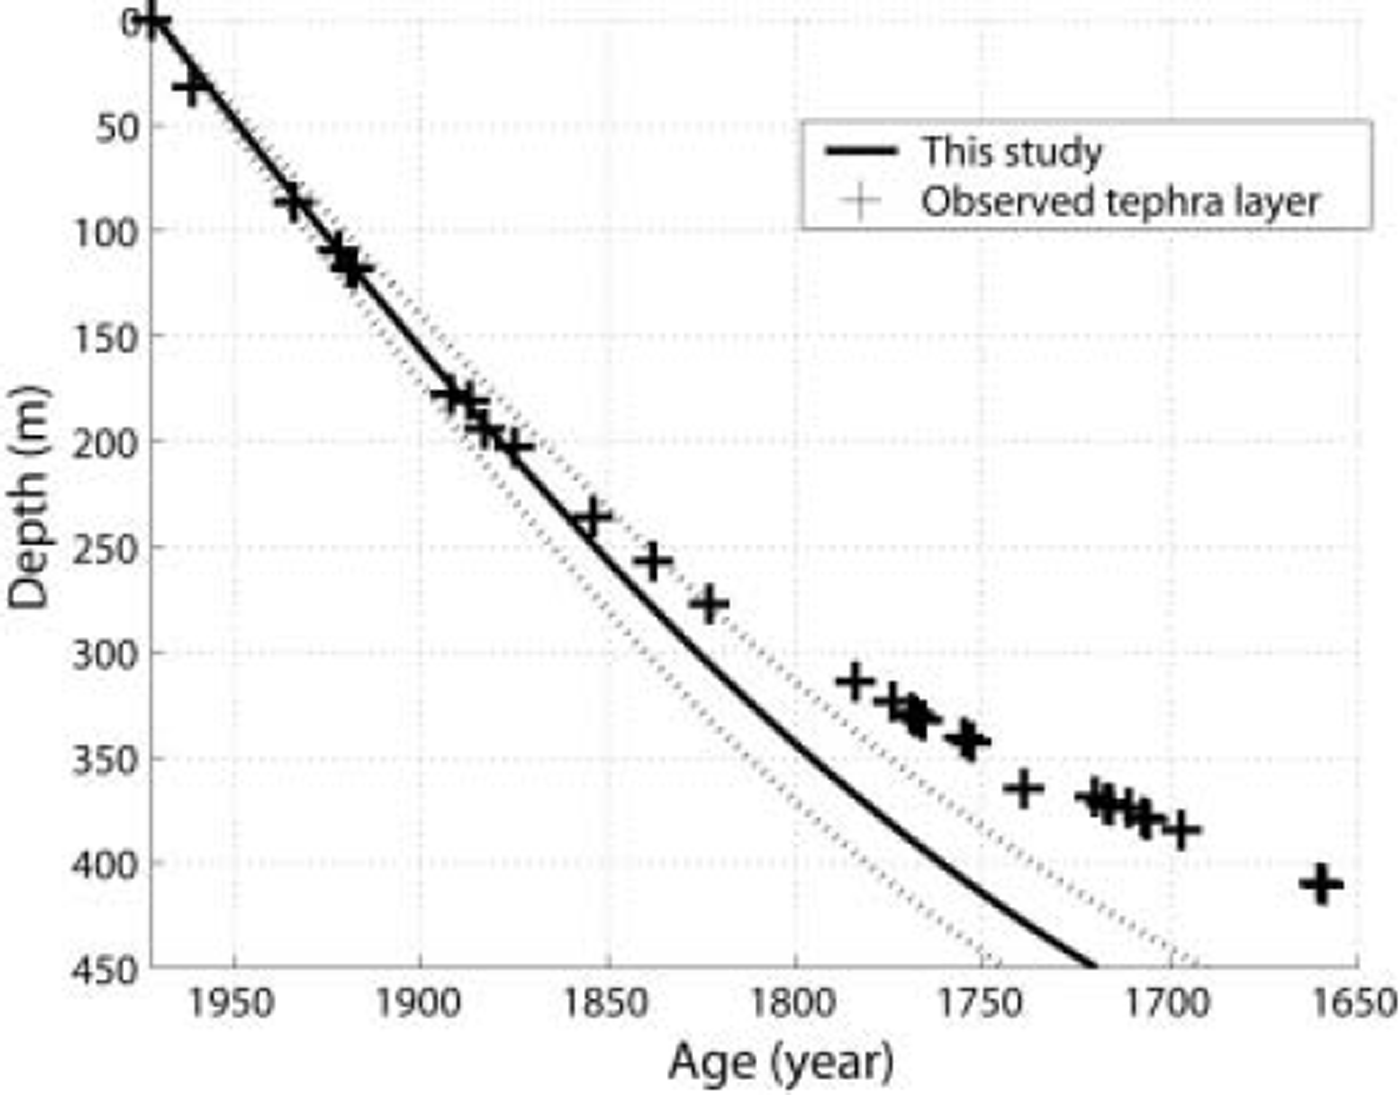
The various uncertainties, similar to those discussed above for Mýrdalsjökull, may cause dating errors of ±10years. The stippled lines in Figure 9 indicate the sensitivity to mass-balance forcing variations of 0.25 m a-1 (±12%). The firn depth-density correction is assumed to be the same as on Mýrdalsjökull and may describe the difference of the first age mark (tephra layer) but will be insignificant in the lower part. Based on the Mýrdalsjökull experiment, we believe the geometrical changes (mainly elevation changes) caused by a mass-balance perturbation are rather small compared to changes that might have taken place by changed geothermal activity in the vicinity of the Baradarbunga ice dome. However, by changing the geometrical characteristics of the flowline (changing the ice thickness in different ways, and the degree of divergence) the sensitivity of the age-depth scale was tested. A change in divergence from m = 0.3 to m = 0 gives 10 years younger ice at 400 m depth. Lifting the smoothed bedrock 50 m predicts 5 years older ice at 400 m depth. These tests do not describe how the age-depth scale would be altered under a shift in geothermal activity, but might justify the flowline not being sensitive to its current geometry. We therefore conclude that the mass-balance forcing is the most sensitive parameter in this flowline.
Discussion
The model is a useful tool for determining mean specific net balance in the accumulation zone of large ice caps where the bedrock undulations are small compared to the ice thickness. The model fails close to the bedrock and in areas with rough bedrock topography (undulations of the order of half a mean ice thickness) and should not be applied close to ice divides and in areas with high longitudinal stresses, because of violation of the assumption of constant shape function φ (the horizontal velocity profile over depth). The model is highly sensitive to strong ice-thickness variations so that smoothing of bedrock undulations is required. The model should not be applied in areas with high bottom melting. Close to the equilibrium line, a change in mass balance will produce a large change in elevation and velocities, and thus the steady-state assumption is violated.
Conclusions
Internal tephra layers of known age provide useful information on glacier specific net balance rates. Studies of three flowlines on Mýrdalsjökull indicate a higher specific net balance in the southern part of the ice cap, (4.5 m a-1 w.e. vs 3.5 m a-1 in the north at 1350 m a.s.l.).
The response time for perturbations in a climatic mass-balance forcing is 75 ± 10years for a selected flowline on Mýrdalsjökull. The response time is not sensitive to step perturbations smaller than 0.6 m a-1.
A revised model for the age-depth relationship of the 400 m deep 1972 ice core recovered from the Bardarbunga dome suggests that the lower part (below 250 m) is younger than previously reported. The lowermost part of the core (411 m) is estimated to have been deposited in ∼ AD 1 7 5 3 instead of AD 1659, a difference of 94 years.
Acknowledgements
This work was supported by the University of Iceland Research Fund. N. Reeh has been highly involved in the work and we thank him for his patience and time. We also thank H. Oerlemans and an anonymous reviewer for substantially improving the paper.



