


Introduction
The Baltic Sea is a zone of seasonal sea ice where ice forms in winter and melts in late spring. The ice pack is a significant and highly sensitive component of the climate in the Baltic Sea region (Reference Omstedt and NybergOmstedt and Nyberg, 1996; Reference Haapala and LeppärantaHaapala and Leppäranta, 1997; Reference Vihma and HaapalaVihma and Haapala, 2009). The seasonality of the sea ice greatly influences both the physics and the ecology of the underlying waters. However, the ice-cover influence on the underlying water masses has been studied much less than the ice conditions themselves (Reference Alenius, Myrberg and NekrasovAlenius and others, 1998). In an era when climatic change scenarios are prominent and interannual variability of ice conditions is high (Tinz, 1996; Reference Chen and LiChen and Li, 2004), it is important to assess the role of sea ice in the regional climate. Increased understanding of the role of sea ice in the water and heat cycles has been reported as one of the major future challenges in the Baltic Sea (Reference Omstedt, Elken, Lehmann and PiechuraOmstedt and others, 2004).
The Gulf of Finland (GoF) is the easternmost basin of the Baltic Sea. Its hydrography is typical of estuaries, characterized by large horizontal and vertical variations. Since there is no sill between the GoF and the Baltic proper, there are no topographically isolated water masses (Reference Alenius, Myrberg and NekrasovAlenius and others, 1998). The western boundary is defined as the line Pöösapea–Osmussaar–Hanko town, all located in the mouth of the GoF (Reference Leppäranta and MyrbergLeppäranta and Myrberg, 2009). Due to the largely continental climate, the probability of ice occurrence in the GoF is >90% (SMHI and FIMR, 1982). Ice formation on the Finnish coast is additionally promoted by the bathymetry, the shallow, gentle sloping of the seabed, and the irregularly shaped coastline with numerous islands and skerries (Reference Feistel, Nausch and WasmundFeistel and others, 2008).
Along the Finnish coast, an oceanographic observation network of coastal stations and lightships started to operate in 1899 (Reference GranqvistGranqvist, 1938; Astok and others, 1990; Reference Haapala and AleniusHaapala and Alenius, 1994). Around the same time Finland joined in hydrographic research of the Baltic Sea (Reference HoménHomén, 1907), one of the most studied marine areas worldwide. The water residence time of the entire Baltic region is 30-50 years, so climatic considerations should preferably be based on observation series exceeding this internal timescale (Reference Feistel, Nausch and WasmundFeistel and others, 2008).
This study is a continuation of our research on the heat budget and coastal-central basin interaction in the GoF (Reference Merkouriadi and LeppärantaMerkouriadi and Leppäranta, 2013,Reference Merkouriadi and Leppäranta2014a,b; Reference Merkouriadi and LeppärantaMerkouriadi and others, 2013) and aims to examine sea-ice influence on the annual cycles of the physical properties of coastal waters. The hydrographic observations are from Tvärminne Storfjärden, located on the southwest Finnish coast, at the mouth of the GoF (Fig. 1). The data cover the period 1926-2011, with a gap of 2 years during World War II. This was the first longterm analysis of annual cycles in the Archipelago Sea and gives a very good picture of the seasonal distribution of the physical properties. Here the main question was the role of sea ice in the stratification of the water body. Years with extreme ice conditions, either ice-free or with ice duration >120 days, aided comparisons. One of the most interesting results of this study was the seasonal freshwater budget and how it is controlled by sea ice during the winter.
Map of the Baltic Sea and the observation sites on the western Gulf of Finland (source: Ocean Data View).

In our previous work, long-term hydrographic and sea-ice trends were analyzed for interannual variability (Reference Merkouriadi and LeppärantaMerkouriadi and Leppäranta, 2014a). The results showed a significant decrease in ice season length by 30 days since 1915. Ice thickness has decreased by ∼0.08m in the past 40 years. Surface water temperature increased by 1°C, and surface salinity has increased by 0.5 psu since 1926. Having analyzed the long-term trends, we now turn toward seasonal questions.
2. Materials and Methods
2.1. Data sources and quality
The research area, Tvärminne Storfjärden, is located on the southwest Finnish coast, on the east side of Hanko Peninsula. Hydrographic data were collected three times per month, starting in mid-1926. Water temperature and salinity were measured at six different depths (0 m, 5 m, 10 m, 15 m, 20 m and 30 m). Measurements at 15 m depth started only in 1956. Data collection was interrupted from March 1940 to May 1942, when the region was occupied by the Soviet Union. Temperature was always measured by reversing thermometers. Water samples from each depth were collected into sample bottles and analyzed for salinity in the laboratory of the Finnish Institute of Marine Research (FIMR; fused into the Finnish Meteorological Institute (FMI) in 2009). After the 1950s, the methodology to determine water salinity changed from chemical titration to electrical conductivity measured with laboratory salinometers, increasing the accuracy to ±0.01‰ (Reference EmeryEmery and Thomson, 2001). Data used for our study were provided by FMI (Table 1).
2.2. Methods
After basic quality control and statistical analysis of the hydrographic data, we analyzed and plotted the seasonal variability over the past 85 years. In addition, the annual cycles of thermocline and the halocline depths were estimated from the steepest gradient of the mean temperature and salinity, respectively. We also estimated the seasonal variability of the heat content of the water body, taking the sea-ice formation and break-up into account. For monthly changes in heat content of the liquid water component (Q w), we used

where p w is the sea-water density, c w is the specific heat of the sea water, Tw is the vertically averaged water temperature, t is time and H is the water depth. To account for the ice, we then calculated the latent heat lost or gained during the ice formation or ice melt (Qi):

where pi = 917kgm −– 3 is the ice density, L is the latent heat of freezing and h is the ice thickness. Changes in heat content due to ice temperature variations were small and are ignored here. Since no ice thickness data were available in Tvärminne, we approximated the ice thickness from a degree-day model (Reference ZubovZubov, 1945):

where a = 2n i /p i L « 14.7 x 10⁻¹⁴m2 (°Cs)–2 (rei is the thermal conductivity of ice), FDD is the freezing-degree-days (s), FDD0 is a small correction term for the surface heat balance, and d«0.1 m is the insulation efficiency of the atmospheric surface layer. This derives from a simple analytical approach to the ice growth problem based on the following assumptions: (1) thermal inertia is ignored, (2) solar radiation is ignored, (3) oceanic heat flux is ignored, and (4) air temperature is known (Leppäranta and Myrberg, 2009). However, assumption (3) can be biased and snow accumulation is omitted from the model. An empirical modification was developed by fitting the parameter a to a nearby ice station in Hanko, where ice data were available from 1971 to 2011. The empirically estimated coefficient a* normally varies between a/2 and a. In this case, a*>7.1 x 10⁻¹⁴m2 (°Cs)–2 was quite low, most likely due to the snow accumulation on the top of the ice sheet. To calculate FDD, we used air temperature data from Tvärminne and Hanko.
Data used in the FIMR/FMI analysis

Finally, the freshwater budget was estimated based on the salt content (Q s) of the water column:

where S is the vertically averaged salinity of the water column. Thus, Q w +Q i and Q s are the true changes in the heat and salt content, respectively, and further investigations are needed to identify the cause of changes in heat and salt content.
3. Results
3.1. Annual cycles
Figures 2–4 show the seasonal variability of the water temperature, salinity and density, respectively, based on the long-term monthly averages at each depth. The greatest variations of the hydrographic properties occurred closer to the surface since they were driven primarily by the atmosphere. The long-term averaged monthly surface water temperatures varied between 0.2°C and 16.7°C. The freezing point at the site was –0.3°C. The minimum temperature was observed in February, and the maximum in August. Near the bottom (30m depth), the temperature variation was smaller, from 0.6°C to 8.8°C. The minimum occurred in March and the maximum in September, with a lag of 1 month compared to the surface due to vertical diffusion of heat. Thermal stratification began after the ice break-up in spring. The largest temperature gradients occurred in August, while the stratification vanished after October, just before ice formation.
Annual cycle of water temperature at different depths, Tvärminne Storfjärden, 1927–2011.

Annual cycle of water salinity at different depths, Tvärminne Storfjärden, 1927–2011.

Annual cycle of water density (σT ) at different depths, Tvärminne Storfjärden, 1927-2011.

The long-term averaged surface salinity varied between 3.6 and 6.2 psu. Minimum values were observed in March and maximum in October, mainly due to vertical convection and advection. A remarkable drop in surface salinity, from 6.1 psu to 3.6 psu, occurred after December. This was most likely due to a freshwater layer originating from Pojo Bay, further inland, and that was held below the ice sheet during winter. One reason for this was reduced mixing due to the landfast ice barrier. In addition, circulation under the ice was probably weak so that there was limited exchange between the coastal waters and the central GoF. After surface salinity reached the March minimum, it started to increase at a constant rate of ∼1 psu month –1, reaching almost 5.5 psu in May. From May to October the rate of increase was lower (∼0.15 psu month-1) and thereafter the salinity started to decrease towards the winter, along with the development of the winter stratification.
The water density (σT) values were between 2.8 and 5.3. As with the water temperature and salinity, the greatest variations occurred at the surface. There were two distinct surface density minima, in March and August. The surface minima act as seasonal barriers to convection. This could have implications for both the hydrography and ecology of the water body. In addition, it affects the ice season length, with ice formation occurring sooner due to the higher freezing point of the fresh water and with a delay in ice break-up due to the limited oceanic heat flux. In the winter, when the temperature of the water column was uniform with depth, density had a very similar distribution to salinity. In the summer, the density distribution changed as it was influenced by the strong thermal stratification. There was neutral stability in the water column throughout the year.
Figure 5 plots the seasonal variability of the water body temperature and salinity, minimum air temperature, precipitation and monthly maximum ice thickness. Due to the larger heat capacity of water than of air, and the winter phase changes, the average standard deviation (4.6°C) was ∼5°C less in water than in air (9.2°C). Seasonal distribution patterns were similar in air and water. However, water temperature values lagged by 1 month compared to the atmosphere throughout the year. As already noted, changes in water salinity occurred mainly at the surface. The depth-averaged salinity minimum in the water body occurred in April during ice melt, driven mainly by the surface layer. Seasonal variation of precipitation was also analyzed for 1927-2011. There was an increase in precipitation towards summer, coinciding with an increase in surface salinity. Thus, the increase in surface salinity was mainly associated with the wind forcing and advection from the outer GoF, where salinity is between 5.5 psu at the surface and 8 psu at the bottom (Reference BockBock, 1971). Favorable winds push saline water from the central to the coastal GoF. Here easterly winds pushed surface waters towards the Finnish coast, while westerly winds drove upwelling that may also have brought saline water to the study site. Sea-ice thickness reached a maximum in March, ∼0.33 m on average, and the ice was melted completely in April.
Seasonal variation of the vertically averaged water temperature (dashed line), minimum air temperature (red line), surface salinity, precipitation and maximum ice thickness in Tvärminne.

Monthly statistical information on water temperature and salinity in Storfjärden is listed in Table 2 and Table 3. The minimum, maximum, mean and standard deviation values are taken from the monthly average profiles. The maximum standard deviation of the temperature values was observed in August and the minimum in February and March, when the water was ice-covered.
The long-term averaged gradients of temperature, salinity and density were examined (Fig. 6). The salinity gradient was positive from the surface toward the bottom, while the temperature gradient was negative, indicating net heat and freshwater fluxes, respectively, to the atmosphere and from the land. The temperature gradient was ∼–0.1°Cm–1. Taking the turbulent diffusion coefficient as D>10–4m2s–1 (e.g. Reference TennekesTennekes and Lumley, 1972), the mean heat loss became ∼40Wm– 2, which must have been compensated by advection:

Long-term annual average gradient of temperature, salinity and density vs depth, Tvärminne Storfjärden, 1927–2012.

The halocline was at a shallow depth, held by a freshwater flux from Pojo Bay to the north and brackish water inflow from the central GoF. The annual cycles of the thermocline and the halocline were estimated by the steepest gradients between different depths. From January to August, the halocline was prominent mainly in the first 5 m. The underlying water masses did not interact directly with the wind-induced and convective mixing. Especially during the ice season, wind did not affect the surface water. The salinity gradient below the halocline was almost constant with depth. The thermocline was located mainly between 5 and 10m, but did not peak strongly in the mean distribution. After September, the surface water cooled, the water body became mixed and thermal stratification vanished.
In addition, we estimated the annual behavior of the water body heat content in Storfjärden, including the ice formation and break-up (Fig. 7). The total heat flux (black line) indicated heat loss in the autumn-winter months (September-February) mainly to the atmosphere, resulting in ice formation. In the spring-summer months (March-August) the water body gained heat and balanced the winter losses. The grey dotted line represents the heat fluxes due to ice formation and break-up. Heat loss from the water body to the atmosphere contributes to ice formation, while heat gain to the water body drives ice melting. There was a clear peak in heat input during ice melting in April (∼40 Wm– 2 ) . The atmospheric heat flux melted the ice in April and contributed to the heat content of the water column. The peak was significant because ice break-up is a much faster process than ice formation. The mean annual ice heat balance (grey dotted line) is always zero; however, the contribution of ice break-up to the heat budget was important because it occurred in a short period.
Monthly averaged heat fluxes from changes in water temperature and sea-ice formation and break-up in Tvärminne Storfjärden, 1927–2012. Positive values indicate heat fluxes from atmosphere to water.

Monthly statistics of the averaged water column temperature (°C) in Tvärminne Storfjärden

Monthly averaged freshwater budget in Tvärminne Storfjärden, 1927–2012. Red line represents maximum length of ice coverage. Positive fluxes correspond to salinity decrease, i.e. freshwater input. Negative fluxes correspond to salinity increase, i.e. saline water input.

In addition, we examined the seasonal trend of the surface salinity during its annual minimum (March). Over the 85 year record, March salinity increased significantly (by almost 2 psu), 1.2 psu higher than the long-term trend in the surface salinity (Reference Merkouriadi and LeppärantaMerkouriadi and Leppäranta, 2014a). The seasonal trend was also examined in October, when salinity was maximum at the surface. There was no trend indication for the surface salinity in October.
Spectral analysis of the surface salinity in Tvärminne Storfjärden.

The annual course of the freshwater budget was calculated based on the monthly salinity changes of the water body (Fig. 8). Positive values were observed mainly during the ice season and were probably associated with the limited mixing and water exchange with the central GoF. After the ice season, the freshwater budget turned negative. Since the GoF is a dilution basin by definition, the negative freshwater budget was linked with increased advection of more saline water from the Baltic proper.
Monthly statistics of the averaged water column salinity (psu) in Tvärminne Storfjärden

Finally, we estimated the power spectrum of the surface salinity in Tvärminne Storfjärden (Fig. 9). There was a strong peak in the 12 month cycle and a lower one in the 6month cycle, which was the second harmonic correction into the annual cycle. Very low frequencies show large levels due to the trend.
3.2. Seasonal long-term trends
In our previous work (Reference Merkouriadi and LeppärantaMerkouriadi and Leppäranta, 2014a) we examined the impact of sea ice on the annual cycle of the sea surface temperature (SST), by calculating the correlation of the SST and the number of real ice days. Real ice days are defined as the number of days of actual ice occurrence. Based on the significance of the correlation, the thermal memory of the system was estimated at 2-2.5 months. To examine the long-term trend of the amplitude of the annual climatological cycle, the average surface temperature in August and the maximum ice thickness in February are plotted together in Figure 10. There was an increasing trend in the August surface temperature of ∼1.5°C in 85 years, and the February maximum ice thickness decreased by almost 0.05 m. The linear regression was based on the least-squares estimation of the parameters. In a non-freezing water basin, when minimum and maximum temperature changes are of the same amount, the annual amplitude of the heat content is the same. In the case of sea-ice formation, phase changes need to be taken into account. An ice thickness decrease of 0.05 m means a heat content increase of 15 MJ m–2corresponding to a water temperature that is 1.3°C higher in a 3 m layer. Thus, the annual amplitude had not essentially changed during the observations.
Interannual variability of the March surface salinity (top), August surface water temperature (middle) and February maximum ice thickness (bottom) in Tvärminne Störfjarden, 1927–2011.

3.3. Sea-ice influence
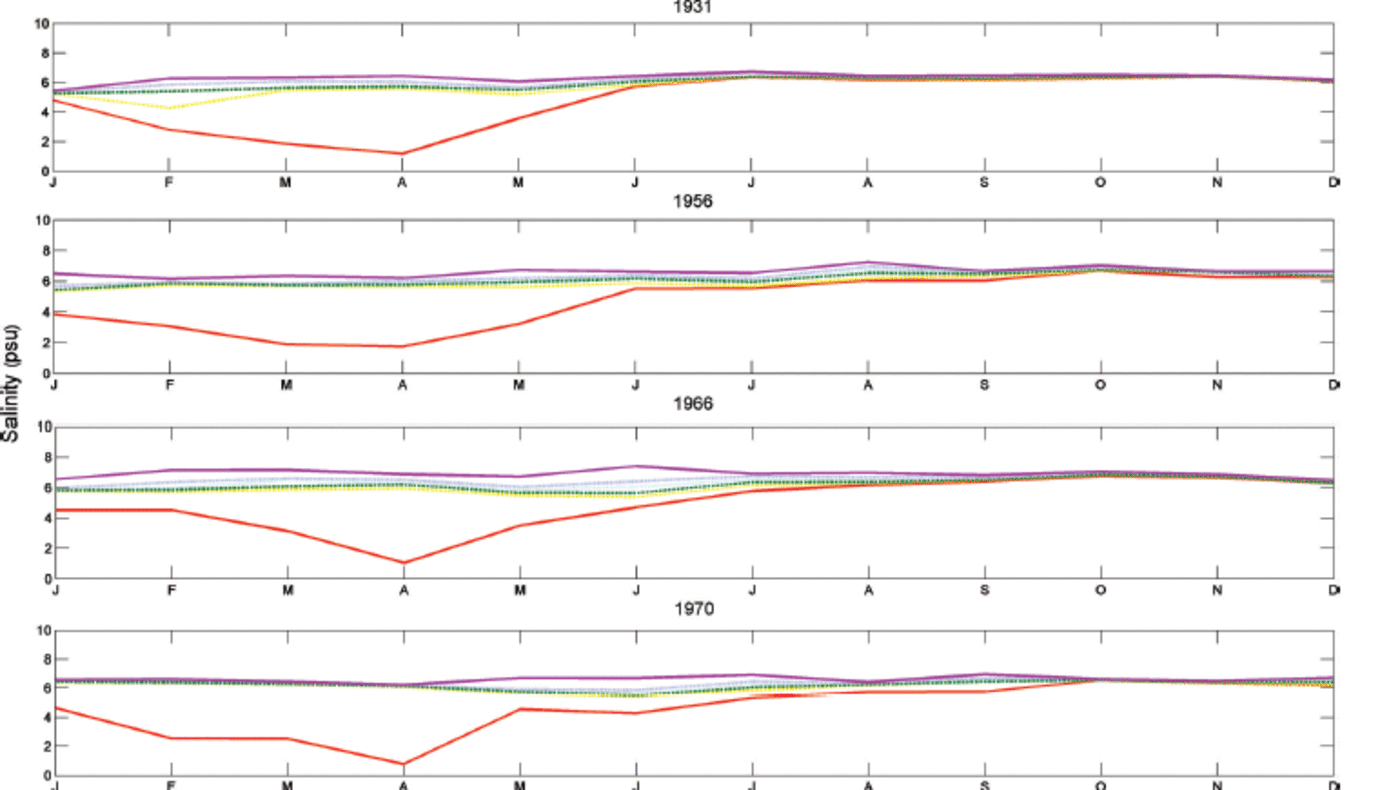
From the salinity distribution (Fig. 3) we noticed that greater variations occurred at the surface, especially in winter. In order to examine the role of ice formation, we grouped the years when the number of real ice days was >120 (1931, 1956, 1966 and 1970) and years without any ice (1975, 1992 and 1995), and compared the salinity distributions (Fig. 11 and 12). Real ice days refer to the number of days of actual ice occurrence. A large drop in surface salinity during winter (Fig. 3) was apparent in ice years, but almost vanished in ice-free years. This was probably associated with the weak mixing of the water body under the ice. During years with persistent ice cover, cold and fresh water entered Tvärminne from Pojo Bay in the north but did not become mixed, resulting in a very low-salinity layer just below the ice sheet.
Seasonal salinity distribution in years with extreme ice coverage (>120 days).
Seasonal salinity distribution in ice-free years.

The same comparison was also made for the temperature and the density distributions. During winter in ice-free years, the water-body temperature was between 0.5°C at the surface and 0.8°C at the bottom. In ice-covered years, the water temperature was negative and reached minimum values of -0.3°C at the surface and -0.15°C at the bottom. Ice formation of 0.3 m in the area corresponds to cooling of the water body by ∼0.6°C. The landfast ice cover prevents turbulent transfer of heat from the water. In open-water conditions turbulent heat losses can reach 50-100 Wm– 2, but, in the case of an ice cover, heat must be transferred by molecular conduction, resulting in heat fluxes of 10–15 W m–2. From the density distributions, we noticed stability in the water column in both ice-covered and ice-free years. In ice-covered years, minimum density values were observed in April, whereas in ice-free years they were observed in June.
4. Discussion
The tendency towards milder winters in the Baltic Sea has often been associated with the North Atlantic Oscillation (NAO) and Arctic Oscillation (AO) winter indices (Tinz, 1996; Reference Alenius, Launiainen and LauniainenAlenius and others, 2003; Reference Jevrejeva and GrinstedJevrejeva and others, 2003). Time-series analysis has confirmed the decrease in the maximum annual extent of sea ice and the length of the ice season (Reference Vihma and HaapalaVihma and Haapala, 2009; Reference Merkouriadi and LeppärantaMerkouriadi and Leppäranta, 2014a). Extensive research has been done on the ice formation and break-up driving forces of both the atmospheric and oceanic boundaries (Reference Haapala and AleniusHaapala and Alenius, 1994; Reference Haapala and LeppärantaHaapala and Leppäranta, 1996; Reference Jaagus and KullJaagus and Kull, 2011; Reference Merkouriadi and LeppärantaMerkouriadi and others, 2013). However, it is important to investigate sea-ice impact on the physics of the water column. The Finnish coast of the GoF is an ideal test bed for this study since the probability of annual sea-ice occurrence is >90% and it is also extremely sensitive to small changes in atmospheric winter temperatures (Reference Haapala and LeppärantaHaapala and Leppäranta, 1996; Reference Omstedt and ChenOmstedt and Chen, 2001; Reference StigebrandtStigebrandt and Gustafsson, 2003; Reference Meier, Broman and mMeier and others, 2004).
Last century’s oceanographic records in Tvärminne, combined with meteorological data from the Archipelago Sea, served to examine the annual cycles of water temperature, salinity, density, freshwater budget, heat content and sea ice. Our aim was to study the seasonal behavior of the hydrography and its relation to the seasonality of landfast ice. In total, the seasonal values of both temperature and salinity were representative of the GoF and the Archipelago Sea (Reference Haapala and AleniusHaapala and Alenius, 1994; Reference Soomere, Kyrberg, Leppäranta and NekrasovSoomere and others, 2008). However, there was a distinctive behavior of the surface salinity during winter. A large drop in salinity occurred between December and March. This has been observed before (Reference Haapala and AleniusHaapala and Alenius, 1994; Reference Granskog, Kaartokallio and KuosaGranskog and others, 2005a), but there had been no further investigation of the causes. In this work we confirmed the consistency of this behavior and suggest possible causes.
The vertical temperature gradient in the ocean showed that from January to August the thermocline was located between 5 and 10m. In early spring and late summer, when wave activity is relatively weak (Reference SoomereSoomere, 2005; Reference Broman, Hammarklint, Rannat, Soomere and ValdmannBroman and others, 2006), the surface water interacted weakly with the deeper layers, in a process that strengthened stratification. After September, autumn cooling took place, the water body became mixed and thermal stratification vanished. This means that salinity stratification was too weak to limit mixing by cooling. The vertical distribution of salinity showed that the halocline was mainly located in the surface layer between 0 and 5m. The only exception was June, when the greatest salinity gradient was at 20–30 m. This was probably associated with deep water advection as suggested by the distribution of salinity (Fig. 3).
By comparing ice-covered to ice-free years we noticed that the large drop in surface salinity was prominent only under sea ice, while it was almost undetected in ice-free years. This was an interesting observation since we would expect the opposite pattern, i.e. an increase in surface salinity during ice formation due to brine rejection, followed by a decrease during the melting season. We suggest the following hypothesis to explain this behavior. Cold and fresh runoff from the land entered Storfjärden via Pojo Bay, and formed a thin surface layer below the ice sheet due to limited mixing. There was also limited circulation under the ice, and consequently weak exchange between the coast and the central GoF. This resulted in under-ice plumes, a term referring to water masses that develop in winter just below the ice sheet, due to the high buoyancy of fresh water and the limited wind mixing (Reference Granskog, Kaartokallio and KuosaGranskog and others, 2005a). It has been observed that higher air temperatures are associated with more runoff in the GoF (Reference Hansson, Eriksson, Omstedt and ChenHansson and others, 2011) and the maximum river runoff takes place in May (Reference MikulskiMikulski, 1970). Runoff is strongly linked to temperature, wind and circulation in the northern regions and the GoF, and could be investigated by measuring stable-isotopic compositions of Baltic Sea water samples (Reference Voss, Larsen, Leivuori and ValliusVoss and others, 2000) to find independent confirmation of the present results. In addition, current data from different seasons would help to support our hypothesis. Up to the present, there has been very limited research on the coastal hydrography of estuarine systems of the seasonal sea-ice zone (Reference Alasaarela and MyllymaaAlasaarela and Myllymaa, 1978; Reference IngramIngram, 1981; Reference Ingram and LaroucheIngram and Larouche, 1987).
The annual cycle of density showed neutral stability within the water column. Upwelling events have been reported in the area (Reference Haapala and AleniusHaapala, 1994) but occurred further offshore. The surface layer in Storfjärden was strongly affected by freshwater inflow from Pojo Bay which acted as a convection barrier. Thus, the recovery of surface salinity after March could not be attributed to convection. It was a result of advection from the GoF, in combination with wind mixing of the water body. Previous studies have shown irregular saline water intrusions, changes in winter runoff and fluctuating meteorological forcing (Reference Elken, Kaasik and PostElken, 2006; Reference Elken, Mälkki, Alenius and StipaElken and others, 2006). The freshwater budget was estimated here in order to examine the seasonal variability based on long-term averages. Land runoff together with weak mixing resulted in a positive freshwater budget during the ice season. The budget turned negative after April, a process probably associated with increased advection of more saline waters from the Baltic proper.
Even though the Baltic Sea has been studied extensively, there has been very limited research on the coastal hydrography of the estuarine systems (Reference Granskog, Ehn and HaapalaGranskog and others, 2005b). One of the most important findings was under-ice plume development, which was also observed in the estuaries of the river Kymijoki, on the northeast coast of
the GoF (Reference MerkouriadiMerkouriadi and Leppäranta, 2014b). In the future, we plan to examine additional estuarine systems in the Baltic Sea for comparison.
5. Conclusions
A total of 85 years of hydrographic data (1927-2011) were averaged in order to examine annual cycles of water temperature, salinity and density in Tvärminne. All properties showed higher variations at the surface layer. Water temperature reached maximum values in August, ∼17°C on average. The bottom temperature maximum occurred in September, with a 1 month lag, reaching ∼9°C. From October to April, stratification was overcome, resulting in a mixed water body with temperatures between 0.5°C and 4°C. The minimum water salinity occurred at the surface in March and was 3.6 psu on average. The maximum was observed at the bottom in October (6.6 psu). The annual cycle of water density (σT) varied between 2.8 and 5.3. Minimum density values were observed at the surface in March, and maximum at the bottom in July.
The seasonal variability of the thermocline and the halocline was examined. The thermocline was mainly located between 5 and 10m and was much stronger in the summer, when water was thermally stratified. Thermal stratification was disrupted after September, and the water body became well mixed. The halocline was mainly between 0 and 5 m, largely maintained by freshwater inflow from Pojo Bay. The halocline was stronger under ice when the water body was not mixed by the wind.
From September to February the water body lost heat mainly to the atmosphere, and ice was formed. From March to August, heat was gained to balance the seasonal heat cycle. The greatest heat loss was observed in November and December (∼–150Wm – 2 ) and the largest heat gain in June (∼180Wm – 2). During ice melt, absorbed latent heat made an important seasonal contribution (∼40 Wm– 2 ) to the heat content of the water body. The freshwater budget was positive from November to March and turned negative from April to October.
The interannual variability of the August surface temperature and the February maximum ice thickness showed an almost equal increase in heat content. This indicated that the long-term amplitude of the annual cycle of the heat content has not changed. Over the 85 years of the record, an increasing trend of ∼1.5°C was observed in summer surface temperatures, and the February maximum ice thickness decreased by almost 0.05 m. In the same period, surface salinity in March showed an increasing trend of ∼2 psu. Spectral analysis of the surface salinity showed annual periodicity and a lower energy peak at 6 months, which was the second harmonic correction to the annual cycle.
Sea ice had a clear impact in the seasonal distribution of salinity. Being a barrier between the atmosphere and the sea surface, it hindered the transfer of the wind-induced momentum to the water body. In this case, it resulted in a very low-salinity layer just below the ice sheet, which formed and persisted throughout the winter.
Acknowledgements
We thank the personnel of the Finnish Meteorological Institute (J. Haapala, A. Seinä and V. Siiskonen) for providing the oceanographic and ice data for this study. We also acknowledge the improvements made to our work by two anonymous reviewers. The support of I. Merkouriadi by Vilho, Yrjö ja Kalle Väisälä Foundation of the Finnish Academy of Science and Letters is gratefully acknowledged.



