It has been observed that despite high dislocation densities compared with lattice-matched semiconductors, InGaN/GaN-based systems can exhibit internal quantum efficiencies for light emission in excess of 60%.[Reference Satake and Masumoto1–Reference Netzel, Bremers, Hoffmann, Fuhrmann, Rossow and Hangleiter3] Strained multiple quantum wells (MQWs) on sapphire substrates have large intrinsic piezoelectric fields (PEFs) along the growth direction resulting in inverted hexagonal pit (IHP) or “V-shaped” pits.[Reference Hangleiter, Hitzel, Netzel, Fuhrmann, Rossow, Ade and Hinze2, Reference Netzel, Bremers, Hoffmann, Fuhrmann, Rossow and Hangleiter3] These pits are normally formed during the incorporation of In at relatively lower temperatures (~800 °C) compared with GaN growth temperatures due to small surface perturbations. The narrowing of the quantum wells (QWs) as they fall into the pits increases the band gap and results in a potential barrier that effectively shields carriers from the non-radiative recombination center at the center of the IHP.[Reference Satake and Masumoto1] As the thickness of the QWs are reduced within the folded IHP nanostructure, the built-in strain field, localization and interface effects are also modified compared with the wells grown on normal c-plane facets. The carrier transport is strongly affected by the change in the potential distribution within the InGaN layers around the V-shaped pits.[Reference Hangleiter, Hitzel, Netzel, Fuhrmann, Rossow, Ade and Hinze2] The potential ridges prevents the carrier from diffusing outside them, whereas the potential peaks cause carriers to travel a roundabout route around them.[Reference Netzel, Bremers, Hoffmann, Fuhrmann, Rossow and Hangleiter3] The carriers anisotropically diffuse for several hundred nanometers along a specific direction, which results in localized domains with strong photoluminescence (PL) or modified absorption characteristics.[Reference Kaneta, Hashimoto, Nishimura and Kawakami4] Our recent study of the PL process in V-pit InGaN/GaN MQWs suggest that the carrier recombination process in c-plane QWs is significantly longer (~5 ns) compared with that (~1.5 ns) in V-shaped pit QWs due to the larger PEFs in wider wells.[Reference Llopis, Lin, Pereira and Neogi5] The study of IHPs in InGaN/GaN QWs is gaining significance in designing efficient light emitters. We have shown that the V-shaped pits can be infiltrated with metal nanoparticles to design novel and efficient plasmonic or metal-optically enhanced light emitters.[Reference Girão, Martins, Pereira, Trindade, Zhachuk, Kazan and Watson6] However, the presence of a metallic system within a two-dimensional electron gas will modify the optical properties of the QW. So it is critical to study the optical properties of the InGaN/GaN QWs with high density of IHPs. The basic understanding of the carrier dynamics in InGaN/GaN QWs with IHPs will enable the fabrication of high-efficiency solid-state lighting systems by coupling the metal nanoparticles via the carrier confinement and screening in the V-pits using plasmonic and non-plasmonic enhancement in the entire UV-visible wavelength regime.
The PEF in InGaN/GaN QWs with high V-pit densities is significantly modified due to this anisotropic carrier distribution.[Reference Kaneta, Hashimoto, Nishimura and Kawakami4, Reference Llopis, Lin, Pereira and Neogi5] The presence of this huge PEF shifts the exciton to the red through the quantum-confinement Stark effect (QCSE). Early theoretical works[Reference Smith and Mailhiot7] followed by experiments in strained InGaAs/GaAs QWs[Reference Huang, Cartwright, Harken, McCallum, Smirl, Sánchez-Rojas, Sacedón, Calleja and Muñoz8] show a large nonlinear response for piezoelectric materials because of the screening of these piezoelectric fields by the photoexcited carriers that remained in the QWs (in-well screening). Ultrafast differential spectroscopy offers a means to study the nonlinear response[Reference Özgür and Everitt9–Reference McCallum, Huang, Dawson, Boggess, Hasenberg and Kost12] due to the anisotropic diffusion of photoexcited carriers affecting the carrier relaxation and dephasing in InGaN/GaN QWs with high V-pit density. In strained piezoelectric semiconductor QWs, the room-temperature nonlinear response at timescales longer than the carrier escape time (~10 ps) has been shown to be dominated by long-range (out-of-well) screening of the PEF, whereas short-range (in-well) screening contributes to the nonlinear response on times short compared with the carrier escape time. The electrons and holes are separated in opposite sides of the QWs because of this PEF. The optical nonlinearity arises from the blue shift of the exciton as the PEF is screened by the photo-generated carriers in the QWs. More recent differential transmission (DT) measurements in InGaN/GaN QWs has shown that there is a combined effect of field screening and bleaching in order to take the account for the blue shifting of the differential absorption spectra.[Reference Chen, Cheung, Sweeney, Kirkey, Furis and Cartwright13]
In this paper, the optical nonlinearities due to screening induced by the V-pits in InGaN/GaN QWs have been studied. The differential transmission spectra are used to identify the screening mechanism. Two fundamentally different types of absorption nonlinearities play an important role immediately after the photo excitation in semiconductors: excitonic bleaching and excitonic blue shifting. For higher fluence, the excitonic peak is bleached sufficiently and thus the corresponding change in differential absorption is dominated by a large negative peak. This large negative peak is centered at the excitonic peak. This indicates that most of the carriers are still in the wells. This bleaching is accompanied by instantaneous blue shift of the exciton because of the in-well screening. Over the next 800 ps, the bleaching significantly recovers as the carriers escape the wells.[Reference Chen, Cheung, Sweeney, Kirkey, Furis and Cartwright13] It results in a change of the absorption coefficient that consists of positive and negative peaks.
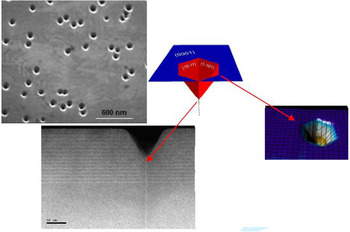
An undoped InGaN/GaN MQWs with a relatively high V-pit density employed in this work was synthesized using MOCVD (Fig. 1). These pits are normally formed during the incorporation of In at relatively lower temperatures (~800 °C) compared with GaN growth temperatures due to small surface perturbations. The pit density has been intentionally maintained higher to investigate the effect of anisotropic carrier transport due to the modification of the built-in electric field. The MQWs consists of a 14 period, 10 nm per period with 2.5 nm-wide InGaN QWs and 7.5 nm-wide GaN barriers. The MQW structure is capped with a 15 nm GaN layer and is grown on a ~1 μm GaN layer. The details of the sample preparation have been described in Ref. [Reference Pereira, Martin, Trindade, Watson, Zhu and Humphreys14] The estimated built-in electric field (parallel to the c-axis) due to the piezoelectric polarization is −0.6 MV/cm in the QW and is 0.2 MV/cm in the barrier as calculated using a method developed by Fiorentini et al.[Reference Fiorentini, Bernardini, Della Sala, Di Carlo and Lugli15]
Schematic of IHP structure showing the planar view with scanning electron microscopy (SEM) image (upper left), cross-sectional view using transmission electron microscopy image of InGaN/GaN multiple QWs (lower left), and tilted planar view using atomic force microscopy image of the sample (lower right). The SEM image shows the density of the localized defects due to IHPs.

The CW PL spectra were collected on a JY Triax 550 spectrometer with a liquid nitrogen cooled CCD. Near-field PL was produced using a JASCO near-field optical microspectrometer with a spectral resolution of 0.01 nm. A UV probe with 180 nm aperture was used for the measurement with a spatial resolution of 90 nm. A HeCd laser at 325 nm was used, with the excitation intensity limited to about ~5 μW due to the throughput of the fiber tip. A Ti:sapphire laser-based regenerative amplifier (RGA) with an output at 800 nm and 35 fs pulses with the repetition rate of 1 kHz was used for the differential transmission measurement. The output of the RGA was split into two parts: 90% of the beam used as the pump beam was passed through one of the tunable optical parametric amplifiers (OPA) and 10% of the beam was used as a probe beam. The probe beam at 800 nm was attenuated by neutral density filters and then focused using a CaF2 crystal to generate a broadband continuum probe. The probe extended from the 700 to 360 nm.[Reference Alfano16] The probe intensity was maintained to be low to avoid any probe induced carrier transition into the conduction band. The differential absorption (Δα) spectrum was then extracted from differential transmission ΔT/T: Δα = −1/d [ln(1+ΔT/T)], where d is the total thickness of active layers of InGaN MQWs and it is 140 nm in our case.
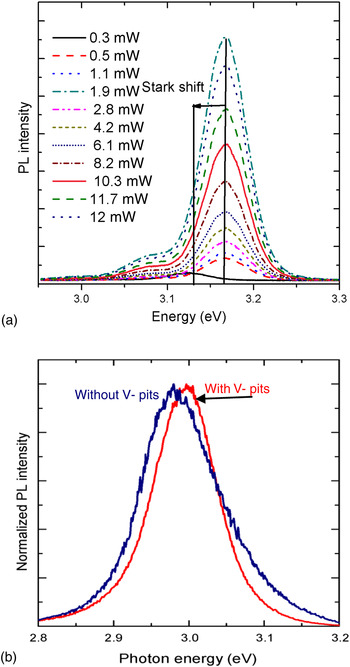
The change in optically excited carrier density modifies the effect of the PEF which is usually manifested by a blue shift in the PL emission energy. Excitation power-dependent CW PL spectra of InGaN/GaN QWs are thereby shown in Fig. 2(a). The emission energy shifts from 3.13 eV at 0.3 mW to 3.168 eV at 12 mW due to the screening of the QCSE. Figure 2(b) shows the near-field PL spectra of regions with and without V-pits. A blue shift is observed for the region with V-pits,[Reference Llopis, Lin, Pereira and Neogi5] which also corresponds to the modification of electric field in the V-pits compared with electric field away from it.
(a) The excitation power dependence CW PL and (b) n ear-field PL spectra with and without V-pits.
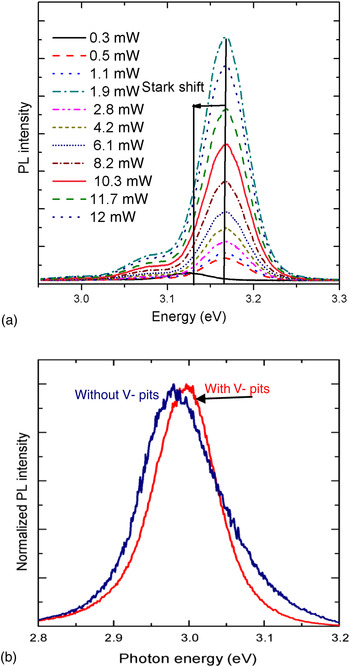
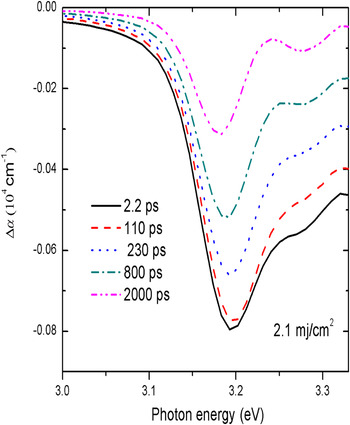
Figure 3 shows differential absorption spectra at different delay times under the pump fluence of 2.1 mJ/cm2 for pump energy 3.82 eV, which corresponds to the photo-generated carrier density 17×1013 cm−2. The sample is pumped above the barrier band-gap, however as the change in carrier dynamics in the InGaN QWs is dominant, the absorption spectra (above 3.4 eV) for the GaN barrier levels are not presented in the current work. The carrier density induced by the pump laser is sufficient to screen the in-well field as depicted by a single negative peak which is due to the excitonic bleaching.[Reference Chen and Cartwright17]
Differential absorption spectra at different delay times under high pump fluence 2.1 mJ/cm2.

The energy of the peak signal is red-shifted for a longer delay time. This red shift is an indication of carrier relaxation to the lower energy states. As time elapses beyond 1 ns, the induced oscillator strength is strong enough for the second peak to appear along with the first peak. These two peaks are respectively the excitonic bleaching and excitonic blueshifting as we discussed earlier. The appearance of the excitonic peak suggests the lack of sufficient carriers available to screen the in-well field, as the carriers are lost due to the radiative and non-radiative recombination process. There is no notable change in the differential transmission spectra for delay time scales below 2.1 ps. Compared with InGaN/GaN QWs with relatively low IHPs obtained by maintaining a higher growth temperature or with lower In composition the dynamic QCSE effect in QWs with IHPs is observed to be significantly more pronounced.[Reference Chen, Cheung, Sweeney, Kirkey, Furis and Cartwright13, Reference Pereira, Martin, Trindade, Watson, Zhu and Humphreys14]
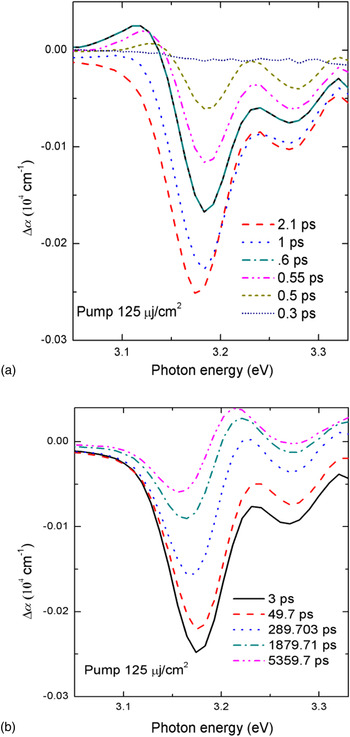
At low excitation density due to weaker pump fluence (~125 μJ/cm2), both the peaks are clearly observed as shown in Figs. 4(a) and 4(b). The red shift is again observed with time delay due to relaxation of the carriers to the lower energy states. In Fig. 4(a), the screening of the internal electric signal within the initial 400–700 fs of the photoexcitation of carrier results in a positive Δα, with the excitation energy at 3.82 eV. The reduction in the initial carrier density due to LO phonon scattering at timescales exceeding 1 ps results in a negative Δα. As the carrier density in the probing region becomes maximum, the absorption is saturated and the DT signal remains almost constant in the short time duration. At low fluence, the two excitonic peaks are distinct. This signal is similar to the excitonic signal observed in GaN.[Reference Choi, Lam, Gainer, Shee, Krasinski, Song and Chang18] Figure 4(b) shows the differential absorption spectra for longer time duration at a constant fluence of 125 μJ/cm2. The amplitude of spectra decreases as the photoexcited carrier density in the probing region decreases for the longer time. However, the amplitude of differential spectra remains constant for less than 49 ps following which the carriers subsequently relaxees via intraband transitions. For a time longer than 1 ns, the carriers relax due to interband radiative and nonradiative recombination. The red shift is also observed as a function of time. The amplitude of the absorption spectra decreases with time as the carriers sweep out the probing region.
Differential absorption spectra at different time delays under fixed pump fluence 125 μJ/cm2. (a) Shorter time delay and (b) longer time delay.

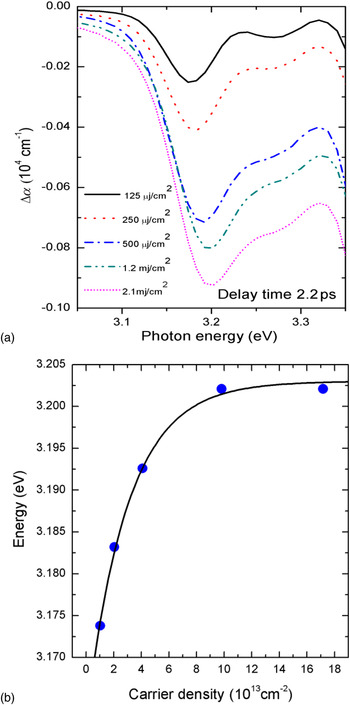
The optically pumped carrier density dependence due to the change in fluence at a constant delay of 2.2 ps is shown by observing the differential absorption spectra in Fig. 5(a). The two excitonic peaks are more distinct for the lower fluence than for the higher fluence, which means at low carrier density, the in-well field is unscreened. Figure 5(b) is absorption peak energy as a function of carrier density for time delay 2.2 ps. The absorption peak is blue shifted as we increase the carrier density. It is because of the screening of the in-well field due to the large number of carriers induced by localization of the carriers in the V-pit of the QWs. The screening effect is saturated for carrier densities at approximately 8 × 1013 cm−2. The carrier density (x) of the carriers decreases exponentially as in the capacitor discharge model.[Reference Turchinovich, Uhd Jepsen, Monozon, Koch, Lahmann, Rossow and Hangleiter19]

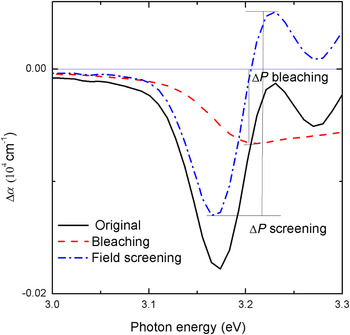
where E g is the absorption energy with the PEF (3.1738 eV), E 0 absorption energy neglecting the QCSE (3.203 eV), τ is proportional to the rate of carrier depletion and C is the fitting parameter. E g is plotted in Fig. 5(b). The original differential absorption spectrum has two components as explained above: (i) bleaching and (ii) screening. The effects of bleaching and screening have been separated in the original spectra for time delay 230 ps as shown in Fig. 6. The bleaching component can be obtained by numerically shifting the blue shifted and bleach spectrum after excitation back to the center wavelength of the unexcited exciton and subtracting it from the unexcited spectrum. The bleaching component was chosen from the differential absorption bleaching spectra at time 230 ps curve for fluence 2.1 mJ/cm2 and the amplitude of this signal was scaled proportionally to the pump fluence. The in-well field screening component is then obtained by subtracting the shifted and unshifted differential absorption spectrum. The peak absorption changes corresponding to the screening, ΔP screening, and bleaching ΔP bleaching, as shown in Fig. 5. This allows us to estimate the strength of the Stark shift induced by field screening and strength of the absorption bleaching in the InGaN QW respectively. This Stark shift induced by the screening and the strength of absorption bleaching is significantly different from previously reported InGaN/GaN QWs that were grown at higher temperatures with less V-pit densities.[Reference Fiorentini, Bernardini, Della Sala, Di Carlo and Lugli15] High density of V pits and narrowing of the wells lead to a decrease in the stark shift, thus the maximum energy in the current system is observed faster compared with samples with less V pits. Furthermore, Fig. 5 shows that the Stark shift is considerably decreased (0.03 eV) in the current experiments compared with a sample with less with V pits (0.1 eV).[Reference Chen, Cheung, Sweeney, Kirkey, Furis and Cartwright13]
(a) Pump fluence dependence differential spectra at a delay time of 2.2 ps and (b) carrier density-dependent differential absorption spectra peak energy at a time delay of 2.2 ps.

The differential absorption spectrum (solid line) at a time delay of 320 ps under the pump fluence of 125 μJ/cm2 is separated into in-well screening (dash dotted line) and bleaching (dotted line) components.

In this paper, we have analyzed the optical nonlinearities induced by the effect of photo-generated carriers into the in-well field of undoped InGaN/GaN MQWs. The strength of the in-well screening is mainly dependent on the carrier density. For low carrier density, the electron–hole pair drifts to the opposite side of the well under the influence of in-well field. Hence, the intrinsic in-well field is reduced and strained QW bands become flat bands which lead to excitonic blue shifting in the differential spectra. At sufficiently higher carrier densities, the in-well field is completely screened.
Acknowledgments
The authors would like to acknowledge the Argonne National Laboratory, Center for Nanoscale Materials, Chicago, IL, Grant No. 25567.