List of symbols
- f(x)
A multi-dimension function that computationally represents the design problem, where each dimension denotes a design variable “x” is an n-dimensional array (x 1, x 2, x 3,…, xn).
- M
The size of a matrix (in this case 2D) that represents asolution space.
- D
The distance between the random point (x 1,x 2) and the nearest best solutions on a solution space.
- O(z′)
An agent's energy to explore solution space, where z′ is the normalized length of the session.
- σ
The shape parameter that affects the overall shape of the curve that governs an agent's energy to explore solution space.
- c
The energy value when the session starts
- S(d′)
The magnitude of the learning vector from a positive event, where d′ is the normalized value of the similarity between the recalled and current agent's solution. .
- α
Position of the peak when learning from the positive experience
- E
Agent domain-expertise level
- τ
The height of the peak when learning from the positive experience
- Δt
The difference between the sessions when the recalled event occurred and the current session
- n
The current session number of an agent
- Sn
The session when the recalled success occurred
- N'
The given number of sessions in a project
 $\vec{v}_s$
The learning from positive experience vector
- $\vec{v}_k$
The initial knowledge state vector of an agent
- $\vec{v}_n$
The resultant learning vector from the
$\vec{v}_s$ and the $\vec{v}_k$- I
The Influence value
- SE
The self-efficacy of an agent
- ΔSE
The difference in the self-efficacies of the two agents
- T
Trust between the two agents
- w 1, w 2, w 3, w 4, and w 5
The weights that were decided after the empirical studies
- R
The reputation of an agent
- N a
The number of solutions of an agent that wereaccepted by the controller agent
- N p
The total number of the solutions proposed by an agent
- f
The familiarity between the two agents
- $\vec{v}_{ I}$
The total amount of learning by an agent from its peers
- $\vec{v}_{{n}^{\prime}}$
The amount of learning an agent does while generating solutions
- EI
Exploration index
- solnslowr
The unique number of solutions explored on a reduced resolution of the solution space
- Arealowr
The reduced resolution solution space area
- EQI
Exploration quality index
- t
Threshold taken to determine EQI
- solnsr
The number of solutions generated that are greater than t on a reduced resolution solutionspace
- totSolnr
The total number of solutions that are present in the solution space that are greater than t


Introduction
Many companies and organizations rely on collaborative work for better project outcomes, and there is a need for workers to have adequate knowledge and skills related to design team collaboration that will give them a competitive edge. Several factors at the individual, project, or organizational level act as barriers in design team collaboration (Kleinsmann and Valkenburg, Reference Kleinsmann and Valkenburg2008). More and more emphasis is being given to study the design process at an individual level, and how social and cognitive factors could contribute to the final design output. One such social factor, social influence, gives rise to influencers who affect the cognition of other individuals during a collaborative activity. Thus, the study explores the impact of these influencers on design outcomes.
Often in teams where there are no appointed leaders, the “charismatic” individuals can make others follow them in their decisions, opinions, and judgements. Social influence is responsible for the imitation nature in humans or, in other words, humans learn from social experiences; in this paper, this is referred to as social learning. Though there are a variety of different types of social learning, the paper focuses only on imitation type (Whiten et al., Reference Whiten, McGuigan, Marshall-Pescini and Hopper2009). According to social learning theory, people learn from their social environment through interactions (Bandura, Reference Bandura1977a), while in social cognitive theory, they learn passively from the social environment by observing others (Bandura, Reference Bandura1986). Since both, the above-mentioned phenomena are considered for the study, social learning is used interchangeably with social influence (as an individual imitates and learns most from those who influence them most).
Collaborative design teams can be viewed as social networks, but the role of influencers in small teams is still underexplored. While it is important to study the interactions in such collaborative teams (Paulus, Reference Paulus2000) and it requires a tremendous amount of time and effort (Becattini et al., Reference Becattini, Cascini, O'Hare and Morosi2019). Therefore, the current work investigates the effect of influencers on design outcomes through agent-based modeling. Specifically, the current work deals with an agent-based approach for simulating idea generation in collaborative design teams (flat teams where participants contribute as equals without an overt hierarchical structure). Besides investigating the effect of influencers on individual thinking during idea generation, it also provides a novel approach to simulate learning in multi-agent systems. The effect of influencers in design teams has not been studied in past, thus the work could provide initial steps toward team management strategies to project managers, leaders, scrum masters, and others in similar roles.
The structure of the paper consists of the introduction section comprising the related work, identified research questions, and related hypotheses followed by the contribution of the current work. The section is followed by the model description along with the past theories and work on which the model is grounded are mentioned. The empirical study section briefly describes the real-world experiments and the results obtained from them, used for further tuning the model. The results from the model simulation show and discuss how influencers affect design outcome in terms of quality and exploration of ideas. The paper ends with a conclusion that provides a summary of the paper along with the limitations and future goals.
Background
Interaction between individuals in a collaborative activity gives rise to social influence (Myers, Reference Myers, Brandstatter, Davis and Stocker-Kreichgauer1982). Social influence is the process where individuals change their behavior, attitudes, and opinions in the presence of social interaction. It is already known that social influence affects group brainstorming (Paulus and Dzindolet, Reference Paulus and Dzindolet1993) and the magnitude of social influence is not evenly distributed across members of a team (Brown and Pehrson, Reference Brown, Pehrson, Brown and Pehrson2019). In social network research, “influencers” is defined as “key individuals who have many people following them, they promote companies’ product and are motivated to adopt new information or product” (More and Lingam, Reference More and Lingam2019). Similarly, in the context of the paper, influencers are individuals who have more capacity to influence their teammates than others (Aries et al., Reference Aries, Gold and Weigel1983).
Cognitive processes occurring during brainstorming are known to be affected by social influence (Paulus and Dzindolet, Reference Paulus and Dzindolet1993). Nowak et al. (Reference Nowak, Szamrej and Latané1990) simulated a population of individuals having different opinions. These simulated individuals affect each other (based on social impact theory) and at the end of the simulation, a stable configuration of opinion was obtained. Another dynamic model of social factors in brainstorming was presented by Brown and Paulus (Reference Brown and Paulus1996), where the model was based on idea generation, idea memory and idea output, taking into account the effects that group member exerts on each other's idea generation. Moreover, it was found that individuals tend to mimic the performance of their co-workers due to social comparison (Paulus and Dzindolet, Reference Paulus and Dzindolet2008). Though it is clear that social influence affects creativity, the effect of the unequal distribution of social influence observed in practice is still unclear.
The dynamic nature of the influence arising from the interaction among individuals in a collaborative activity can be challenging to study using traditional human subject research. Agent-based modeling has been used in many other domains to infer and predict the behavior of complex systems as in the domains of social sciences, biology, air traffic, and many more (Abar et al., Reference Abar, Theodoropoulos, Lemarinier and O'Hare2017). Therefore, one of the broader contributions of this agent-based model would be to assist future researchers by providing a faster approach to study the design collaboration process. The use of agent-based modeling in the design team domain is a relatively new computational approach to model the dynamic phenomenon. It is used to model human behavior and interactions quickly and conveniently, where each agent models a human being, and they exhibit characteristics such as memory, learning, and adaptation (Bonabeau, Reference Bonabeau2002). The agents in the model behave according to the pre-defined rules to fulfill the purpose of the model. Simulating artificial humans in a collaborative idea generation session involves many parameters (Salas et al., Reference Salas, Rouse and Boff2005). Considering all the parameters may be costly (in terms of computational time and resources) and complicates the model, therefore researchers in the past including the current work (Singh et al., Reference Singh, Cascini, Casakin and Singh2019) have considered the ones that contribute directly to their goals. While some authors focused their computational models on the conceptual design phase (Green, Reference Green1997; Cvetković and Parmee, Reference Cvetković and Parmee2002; Ehrich and Haymaker, Reference Ehrich and Haymaker2012), others created models to study distributed team coordination (Carley, Reference Carley1996; Carley and Gasser, Reference Carley, Gasser and Weiss1999; Lee and Lee, Reference Lee and Lee2002) and multidisciplinary teams (Maher et al., Reference Maher, Rosenman and Merrick2007; Hulse et al., Reference Hulse, Tumer, Hoyle and Tumer2019). Researchers have studied and simulated specific aspects of design activity, such as problem-solving (McComb et al., Reference McComb, Cagan and Kotovsky2015, Reference McComb, Cagan and Kotovsky2017) and team-related attributes (Gero and Kannengiesser, Reference Gero and Kannengiesser2004; Singh et al., Reference Singh, Dong and Gero2011; Perišić et al., Reference Perišić, Štorga and Gero2018). Although many studies have considered individual attributes, such as the choice of partners or cognitive style (Hinds et al., Reference Hinds, Carley, Krackhardt and Wholey2000; Lapp et al., Reference Lapp, Jablokow and McComb2019) and social attributes like mental models have been modeled in the past (Singh, Reference Singh2009), the effect of social influence on idea generation outcomes has not been explored.
Unlike the current trend toward studying the influencers in social media, the aspect of influence that occurs during design team collaboration has not been given much attention. Though the effect of social influence on brainstorming has been studied, its uneven distributed nature in the teams where some individuals tend to be more influenced or influential than others is still not explored. The study in this paper would investigate how the magnitude and distribution of influence affect idea generation outcomes. Specifically, the workseek to answer this research question:
What is the effect of influencer(s) on idea generation outcomes (exploration and quality)?
The idea generation outcomes include the quality (i.e., utility or usefulness) of the solutions (Shah et al., Reference Shah, Smith and Vargas-Hernandez2003) and exploration (i.e., the number of unique alternative solutions agents generate before communicating to others in the team) of the design space (Ball et al., Reference Ball, Lambell, Reed, Reid, Lloyd and Christiaans2001; Dorst and Cross, Reference Dorst and Cross2001). The explored values are also evaluated based on the diversity in them, referred to as variety, and explored solution quality called the exploration quality index (these metrics are explained more in the section “Model results and discussion”).
However, before addressing the research question, it is first crucial to determine what makes an influencer. Although researchers have studied the characteristics of social media influencers, little is known about the characteristics of influencers in design teams. The work examined the past studies on group behavior, leadership studies, and team dynamics, to hypothesize some underlying influencer characteristics. Baker (Reference Baker2015) claimed that individuals’ personality, skills, and communication could result in such a phenomenon. Since communication is often influenced by one's confidence state, self-efficacy was one of the individual attributes that were considered. This assumption was made based on the common observation where the more confident individuals are the ones governing the team (Bandura Reference Bandura1977b). It is known that self-efficacy is one of the important factors that are responsible for transformational leadership improving team performance (Pillai and Williams, Reference Pillai and Williams2004), it is unclear how it might affect the degree of influence in teams. The other intrapersonal attribute that was chosen was trust, which arises from how well the two individuals have known each other previously that could also contribute to influencing power (Granovetter, Reference Granovetter1973). Therefore, for this investigation, it was believed that self-efficacy (an individual's belief in his or her capacity to achieve goals) and trust could contribute to the influencer effect. Considering these two factors (self-efficacy and trust), an assumption was made to identify the influencers to address the above research question.
Assumption: Self-efficacy and trust are characteristics that determine how individuals’ perceived degree of influence by others in the team.
To summarize, the main contribution of the work lies in the attempt to build a computational framework that could simulate social influence in collaborative design activities. Besides, providing insights into the popular approach of collaborative group design, the work would also assist researchers and practitioners with a faster method to study collaborative processes. Moreover, the uneven distribution of social influence that gives rise to influencers in the design team has been studied neither empirically nor computationally before. The characteristics and qualities, which give rise to the influencer effect in design teams, are investigated here. Additionally, the work provides a novel approach in stimulating learning in design teams (by considering appropriate model features such as design task, learning from past experience and influencer) is described in the next section. Lastly, the work also presents fresh a way to measure artificial creativity (especially in terms of exploration as explained in the “Model results” section).
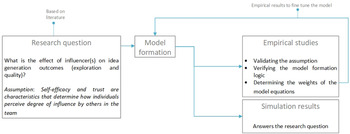
The flow of the research is provided in Figure 1. The empirical studies were done after the initial model development was completed based on literature and assumptions. The computational model approximates the real-world system due to which it needs verification and validation. The empirical study section provides an overview of how some of the logics used in the model were verified as well as the assumption was validated. From the results of the empirical studies, the general idea of the results clarifying the assumptions and variable relationships were implemented in the model and not the exact coefficients (since the experiments were done in different settings, implementing exact results would not be appropriate).
Research workflow.

Model description
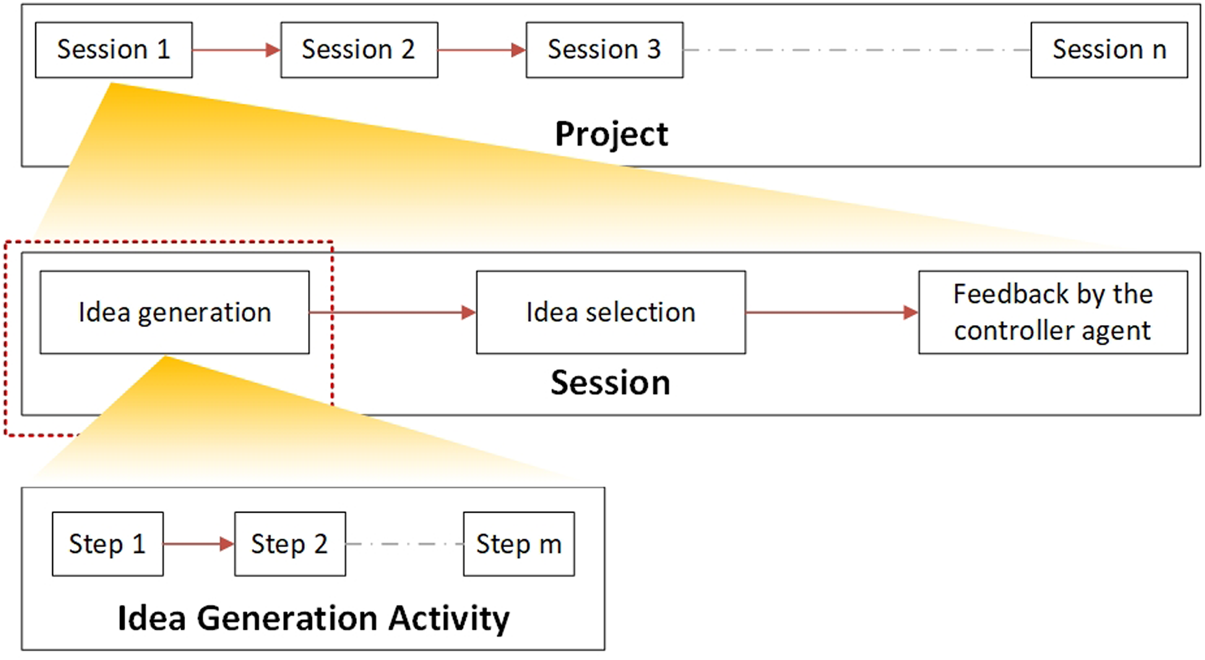
The design project schema used in this paper is shown in Figure 2 (Singh et al., Reference Singh, Cascini, Casakin and Singh2019). As shown in Figure 2, a design collaboration activity starts in the form of a project. Each project has a set of design agents and a controller agent (analogous to a project leader, manager, or others in a similar role) who is responsible for assigning the task, evaluating the solution quality and providing feedback to the team. The project consists of several sessions of idea generation and idea selection before receiving feedback on their proposed solution from the controller agent for that session. Each idea generation event consists of several cognitive steps before proposing a solution to the team. These steps are analogical to the designer exploring alternative solutions (Ball et al., Reference Ball, Lambell, Reed, Reid, Lloyd and Christiaans2001): moving from one point (solution) to another on a design space forms a step. Inspired by this notion, the work in this paper focuses on idea generation.
The focus of the study is shown in the green box.

The design task
The definition of the design task is critical as it drives many aspects of the simulation while having a resemblance to the real world. Design teams are often not immediately aware of the quality of their solution and proceed by trial and error; this is especially true when the designers start working and they have no past experience. In this aspect, design tends to resemble a search task with a fixed design space and variables rather than a mathematical optimization problem. A design task typically has a certain number of design variables for which values are selected and combined to generate unique solutions. Furthermore, it is often the case that the quality of these solutions varies with changes to the constituent variable values. Generally, there are many below-average solutions with a few solutions that have the highest value. These characteristics of real-world design tasks were emulated in the construction of the computational design task solved within the model. Agents interact with the task through trial and error, searching for a solution with high quality. The design variables are continuous in nature and result in a continuous definition of solution quality.
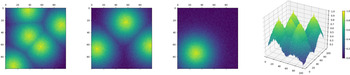
The computational representation of a design problem has been adopted in many design research (Green, Reference Green1997; Cvetković and Parmee, Reference Cvetković and Parmee2002; Gero and Kannengiesser, Reference Gero and Kannengiesser2004; Ehrich and Haymaker, Reference Ehrich and Haymaker2012; McComb et al., Reference McComb, Cagan and Kotovsky2015). Some of the design tasks used in previous work are represented as binary functions (Schreiber et al., Reference Schreiber, Singh and Carley2004). Design tasks that are represented as binary functions often have extreme solution values (i.e., immediately next to the best solution, there is the worst solution). This is an inaccurate representation of the more stable design tasks seen in the real world. This was taken into account while mathematically representing the solution space for this work. The design solution space is modeled in such a way that there is a gradual slope between the best and worst solutions, hence the subtle decrease in the hues around the best solution values (examples can be seen from Fig. 3). Similar to the real-world design problems, some noise was added to the objective function so that the probability of having the best and the worst solution next to each other is not completely eliminated and the design problem could have multiple best solution. The design problem can be computationally represented in multi-dimension that is composed of a landscape function f(x) [see Eq. (1)] and the given number of best solutions (maxima or peaks). The landscape function draws the desired shape around the given number of maxima. Here, x in f(x) is an n-dimensional array (x 1, x 2, x 3,…, xn) of design variables. The landscape function f(x) constructs the slopes around the given number of peaks. The following general assumptions were made regarding the design solution space for this model.
• There is a limited number of n design variables each ranging within a definite interval (unknown to the agents). The design space is represented by all the combination of values of these n variables. For initiation, simplification, and visualization purposes, two variables (n = 2) are chosen to represent the design problem. However, for future work, it could be extended to multiple dimensions.
• Each point on the n-dimensional surface defines a potential solution to the design problem and can be evaluated to yield a quality value. The agents do not know the values of f(x) for any solution of the design space before the start of the project; however, they are aware of the limits of the solution space.
Examples of design solution space with a different number of best solutions (peaks in lighter hue) and a side bar showing solution values. The last image shows an example of a 3D projection of a design space with five peaks.

The design space could be changed with relatively small effort based on the shape (gradient around the maxima), the number of peaks (number of maxima), and the distance between the peaks. The results of the design outcome presented in the paper are related to five peaks. The design solution space has a maximum value of 1 (lightest hue) and a minimum of 0 (darkest hue), as shown in an example in Figure 3 with several local maxima and minima.
 $$f( x ) = \displaystyle{1 \over {\left({1 + {\rm e}^{\left({\left({1/\sqrt M } \right)D-2} \right)}} \right)}},$$
where M is the size given to represent the solution space in a 2D matrix. In this case, M = 100, such that the solution space was represented as a 100 × 100 matrix. D represents the distance between the random point (x 1,x 2) and the nearest best solutions. The number of best solution or the peaks are specified at the beginning of the simulation.
A similar design problem representation was used by Lapp et al. (Reference Lapp, Jablokow and McComb2019) when simulating teamwork based on a different cognitive style where the amplitude of their objective function (peaks) affected exploration. Other studies in problem-solving like Dionne et al. (Reference Dionne, Sayama, Hao and Bush2010) and Sayama et al. (Reference Sayama, Farrell and Dionne2010) also used a similar 1D and 2D representation of the problem with peaks and valleys.
Generating solutions
In order to simulate artificial humans, learning is an important feature to implement in the model. For example, studies have been done where agents learn collectively (Wu and Duffy, Reference Wu and Duffy2004), socially using mental models (Singh, Reference Singh2009), or to simulate curiously in agents (Saunders and Gero, Reference Saunders and Gero2004). Most of the models described in the literature deal with some form of learning in their agents to accomplish the purpose of their work. The most common logic implemented in many models listed above is in the form of learning from experience (McComb, Reference McComb2016; Lapp et al., Reference Lapp, Jablokow and McComb2019). However, while simulating learning it is often assumed that the agents are aware of the design solution space and they thrive for the optimal solution (McComb et al., Reference McComb, Cagan and Kotovsky2017). This works perfectly when the goal of the model is to find the optimal solution depending on the configuration of its parameters. On the other hand, the model presented in this paper aims at mimicking a collaborative idea generation session where the design solution space is unknown to the agents in a way that is similar to a real brainstorming scenario, but at the same time, the individuals (agents in the model) are aware of the boundary conditions. To model thinking in design teams, the authors have taken inspiration from Stempfle and Badke-Schaub (Reference Stempfle and Badke-Schaub2002), where the basic thinking model consisted of exploration, generation, comparison, and selection. Keeping this in mind, the design agents explore the design space, generate solutions, compare it with the solutions they generated in the past and eventually select one to propose to the team. When an agent moves from one point to another in a design solution space, it is analogous to an individual formulating consequent thought during idea generation. The trajectory formed by connecting these points (thoughts) represents the overall process followed by an agent.
In order to learn, the agents explore the design solution space. Every time an agent stops at a point on the design solution space, that point is treated as the agent's selected solution. As mentioned before, the paper only deals with the results related to individual thinking during idea generation in design teams, however, the team interaction (proposing ideas, combining, and decision-making) that are occurring in the backend are not described in the paper and do not impact the results presented here. Idea generation is simulated in agents based on the following features, each of which is explained in more detail in the subsequent sections:
• Agent'sway to explore solution space
• Memory to store past experiences
• Recall capability
• Ability to learn from failure and successful past experience
• Influence of the influencer(s) (as explained in the “Background” section)
Exploring the solution space
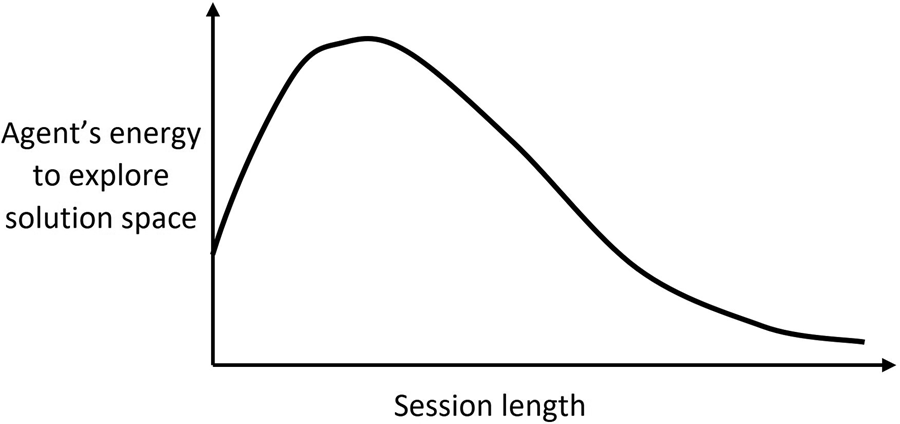
The way agents explore the solution space in the model depends on their energy because individuals during the initial ideation phase are slower in exploring the solutions as they get warmed up in the beginning by triggering memory search. This is followed by more exploration by recalling past solutions from their memory. However, at some point, this recalling process becomes tiring, and the rate of exploration of the solution space drops toward the end of the session (Goucher-Lambert et al., Reference Goucher-Lambert, Moss and Cagan2019) (illustrated in Fig. 4). This behavior is modeled mathematically as shown in Eq. (2). Changing the shape parameter of the curve (σ) makes it possible to generate different energy curves, hence different exploration styles could be assigned to agents. The curve is personalized and kept constant for an agent throughout a session. It does not change with respect to other team member nor depends on factors such as motivation to solve a problem.
 $$O( {{z}^{\prime}} ) = \displaystyle{1 \over {{\rm \sigma }\sqrt {2\pi } }}{\rm e}^{( {- {\rm ln}( {z}^{\prime}) /2{\rm \sigma }^2 } ) } + c.$$
An example plot of an agent's energy to explore solution space.

The exploration of the solution space depends on the length of the idea generation session (i.e., the number of the steps), in the given Eq. (2), z′ is the normalized length of the session. The value of σ lies between 0 < σ ≤ 1, it represents the shape parameter that affects the overall shape of the curve. c is the energy value when the session starts where 0.0 < c < 0.5 is randomly assigned to the agents as it was assumed that there is a certain amount of energy in individuals when the session starts (maximum energy was 1 and minimum was 0) .
Memory
Taking inspiration from the constructive memory concept (Liew and Gero, Reference Liew and Gero2004), the model constructed here implements a simplified version of memories in agents where memory is created based on design agents’ past experience.
Different agents have different memory storage and store experience after working on the design task at the end of a session. These experiences are in the form of feedback from the controller agent. The experiences that are not utilized in the agent's current situation and are not recalled for a long time are forgotten from the memory. The forgetting in agents is based on the Decay Theory, which suggests that “If there was no attempt to recall an event, the greater the time since the event, the more likely it would be to forget the event” (Oberauer and Lewandowsky, Reference Oberauer and Lewandowsky2008). Accordingly, agents in the model exhibit the behavior that suggests that memories are not permanent.
Recall capability
Recalling here refers to the act of bringing a past event back into one's mind. When an agent is unable to recall, it does not mean that the information is permanently removed from its memory but rather that it is unable to be retrieved from its memory for that situation. An individual in real situations might not be able to recall any similar experience from the past while approaching a problem in its current situation. Similarly, in the model, an agent has its feedback from the controller agent stored in its memory. This feedback is in the form of positive (successful experiences) or negative (failed experiences) events, but an agent might not be able to recall them while solving the problem.
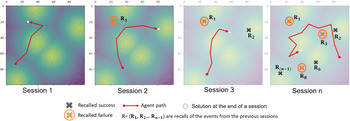
An agent could recall the stored events in any order and the recalled events from the past alter the way it approaches the solution (Murdock, Reference Murdock1962). The recalling ability in agents depends on the intensity of the solution value and the time of recall as explained by Banaji (Reference Banaji1986) and varies from agent to agent. Identical to the real-world situation where individuals recall their worst and best events results more clearly than their mediocre outcomes, this phenomenon of recency and primacy effect is simulated in the model as given by Murdock (Reference Murdock1962). This means that the events that are either first or most recent are recalled more often than the events in-between. Likewise, the events that are extreme (i.e., best and the worst) are more easily recalled. An example of the events being recalled is shown in Figure 5. The red path is the trajectory that each agent takes before selecting the final solution. This red path is made of several steps that are analogous to a designer moving from one solution to another in a design space during an idea generation session. The set of recalled memories (shown as R in Fig. 5) could be of a positive (gray cross) or a negative event (orange cross).
An example showing an agent recalling events while exploring solutions.

Learning from experience
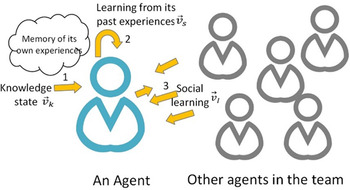
The most common form of simulating learning in agents is in the form of reinforcement learning, where the agents use feedback from the environment to determine their action for the current state (Eliassi-Rad and Shavlik, Reference Eliassi-Rad and Shavlik2003; Hulse et al., Reference Hulse, Tumer, Hoyle and Tumer2019) (seen as arrow 2 in Fig. 6). Similarly, in the model, agents learn about the solutions space gradually as they receive feedback from the controller agent present in their environment. The behavior resembles the one described by Cagan and Kotovsky (Reference Cagan and Kotovsky1997), where the agents move randomly when they start their search but become more regulated as they learn about their problem. According to the feedback (a numerical value) received by an agent at the end of a session, the event is broadly classified as positive (successful) and negative (failure) which are stored in its memory. The event is said to be in a positive category when the feedback value is above a certain threshold and in a negative category when it is below, it could be seen from the example shown in Figure 5 (as black and orange crosses). The learning from the past, which could be positive or negative experience, is different and have a different impact on the current situation (Wimmer and Shohamy, Reference Wimmer and Shohamy2012) are described below:
An agent learning (explained more in the sections “Learning from experience” and “Effect of the influencers”).

Learning from a positive experience  $( {{\vec{v}}_s} )$ and how it affects an agent on its current solution depends on threefactors (Fig. 7):
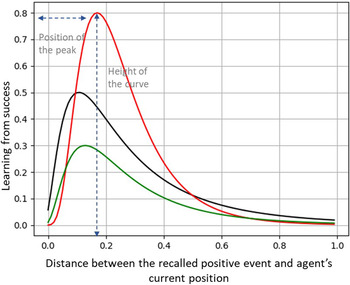
• The magnitude of learning from the positive experience (|v s| = S(d′)) depends on the similarity between an agent's current solution in “mind” and the recalled positive event (Read and Grushka-Cockayne, Reference Read and Grushka-Cockayne2010). If the recalled event is similar (closer on solution space) to the solution “in mind”, the agent is more influenced by its previous experience than those that are far in distance (not so similar) (Gentner, Reference Gentner, Vosniadou and Ortony1989). On the other hand, if the recalled positive event is too similar (i.e., too close) as the solution in mind, the agent's learning is less influenced by it. This assumed that an individual will not apply the exact same (or slightly different) knowledge from the past event to their current situation, hence compelling it to produce different solutions. The similarity is represented as the distance between the recalled and current agent position (d).
• The amount of learning from a positive experience also depends on the expertise level of an agent. It means that when an agent has a lower domain-expertise level, it will learn slower therefore a less steep slope than the agent who is more expertise (Ball et al., Reference Ball, Ormerod and Morley2004). It is seen in Figure 7 as the position of the peak of the learning curve. This is represented in Eq. (3.1), as α that depends on an agent's expertise (E) level, where E was randomly assigned to the agents when the session starts.
• Lastly, learning from a positive experience depends on the time when the recalled event occurred (Δt). It is shown as the height of the learning curve in Figure 7 where more is the height; greater is the learning when the positive experience is recent. Its height is represented in Eqs (3.2) and (3.3) where τ is the adjusted value of Δt so that the value of the curve in Eq. (3) is normalized.
Different amount of learning from one's own positive experience.

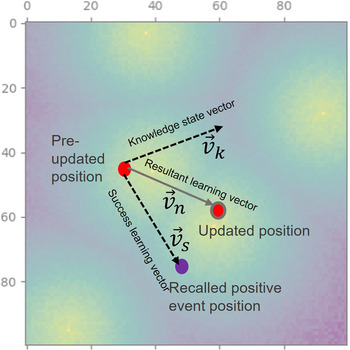
The amount of learning from the positive experience recalled (magnitude of the learning vector as shown in Fig. 8) can be represented by S(d′) and is given in the following equation:
 $$S( {{d}^{\prime}} ) = {\rm \tau }\left({\displaystyle{{\displaystyle{1 \over {{d}^{\prime}\alpha^{\sqrt {2\pi } }}}{\rm e}^{( {-( ( {\ln ( {{d}^{\prime}} ) } ) /2\alpha^2) } ) }} \over {0.7}}} \right),$$
d′ = 4.0 ⋅ d + 0.1. Here, d′ is the adjusted value of d such that 0 ≤ S(d′) ≤ 1.
The updated position on an agent after learning from a positive experience.

In computational terms, d is the distance between the current agent (solution) position in session n and recalled success (solution) position of session Sn. d is the similarity between the current design task and recalled positive experienced as explained above that similarity is one of the factors on which learning magnitude depends. In Eq. (3), S(d′) is divided by 0.7 to normalize it. The other variables in the above equation (on which learning magnitude depends) are explained as follows:
 $$\alpha = 0.8 - ( {0.2\cdot E} ), $$
 $$\tau = 1 - ( {0.7\cdot \Delta t} ), $$
 $$\Delta t = n - \displaystyle{{S_n} \over N'},$$
where n is the current session number of an agent and Sn is the session when the recalled success occurred. N is the number of sessions in the equation 3.3.
The learning from positive experience vector,  $\vec{v}_s$, is summed to the initial knowledge state vector of an agent
 $\vec{v}_k$ to get the resultant learning vector
 $( {{\vec{v}}_n} )$ from the two learning states (arrows 1 and 2 shown in Fig. 6) for an idea generation session given as Eq. (4).
 $$\vec{v}_n = \sum\limits_{i = 1}^N {{\vec{v}}_{s_i} + {\vec{v}}_k}, $$
where in the equation 4, N is the number of positive experiences recalled in a session n and i is the initial starting index.
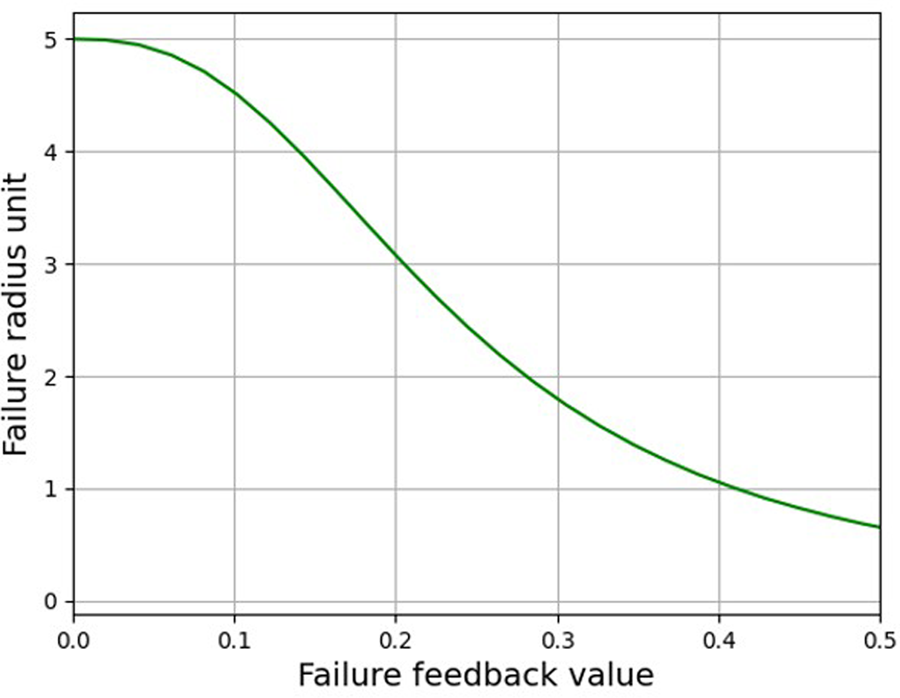
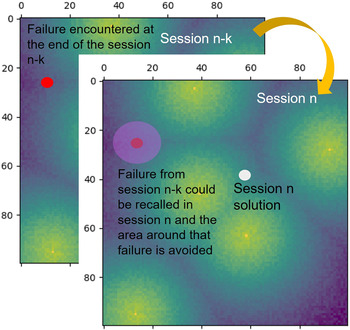
Learning for a negative experience is different from a positive experience as humans try to avoid the failures they have committed in the past and tend to follow the path that led to previous success (Wimmer and Shohamy, Reference Wimmer and Shohamy2012). Similarly, learning from negative experiences is done in the form of avoiding the areas where previous failures have occurred. An agent avoids the negative experiences by forming a circle around the point where the recalled failure had occurred. Like the real scenario where an individual remembers the failure zones on the solution space while exploring new solutions. The radius of this circle differs from agent to agent and depends on the severity of the recalled negative event (Fig. 9). The maximum failure radius is chosen to be five units for a 100 × 100. The radius or the size of the circle denotes the learning capacity from a failure of an agent, and it will avoid the circle area around the recalled failure (Fig. 10).
Failure radius depends on the value of the recalled failure (where five units are the max radius for a 100 × 100 units of solution space).

An example where an agent (in red) encounters a failure at session n−k, which is being recalled in session n, an area around the failure is avoided.

Effect of the influencers
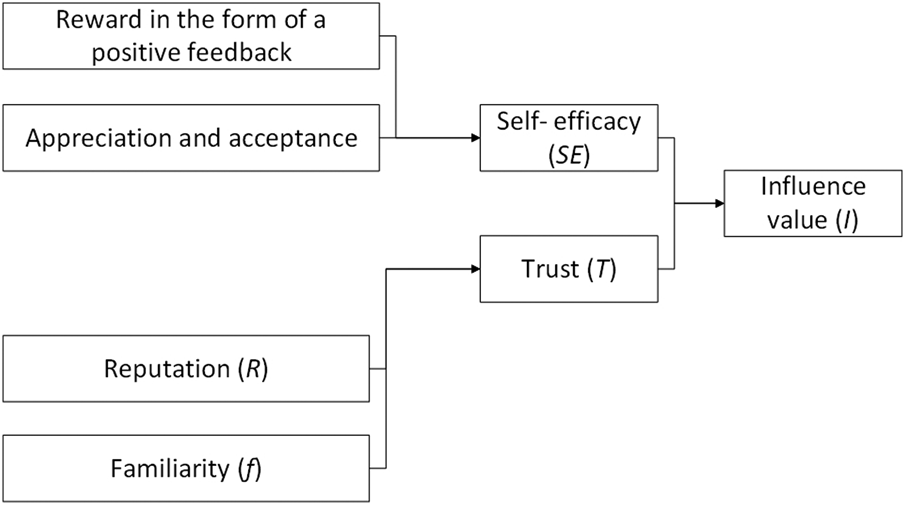
To investigate the factors that could give rise to the influencer effect in design teams, self-efficacy and trust (resulting from the mutual knowledge of each other) were chosen as initial parameters to begin the investigation. Self-efficacy is implemented in the model as a dynamic feature in agents that changes based on its intrinsic and extrinsic motivation (Ryan and Deci, Reference Ryan and Deci2000). Like self-efficacy, trust also changes throughout the simulation as in real situations where it depends on the interacting individual's familiarity and reputation (Mui et al., Reference Mui, Mohtashemi and Halberstadt2002; Costa, Reference Costa2003). To model the “influencing effect”, each agent has an influencing value from other agents in the team and it depends on the factors shown in Figure 11. The influence value I (same magnitude of the social learning vector  $\vert {{\vec{v}}_I} \vert$), for an agent i of agent j is computed as Eq. (5) (an example in Fig. 12). Here, j varies until the total number of agents present in a team and j ≠ i.
 $$I_i^j ( {\Delta {\rm SE}, \;{\rm SE}, \;T} ) = w_1( \Delta {\rm S}{\rm E}_{i-j}) ^{1.5} + w_2( {{\rm S}{\rm E}^j} ) + w_3( {T_i^j } ), $$
ΔSE in the equation 5 is the difference in self-efficacy of agent i and agent j, T is the degree of trust of agent i has on agent j. SE is the self-efficacy of an agent j. The weights w 1, w 2, and w 3 were decided in after the empirical studies, presented in the next section.
 $$T( {R, \;f} ) _i^j = w_4( R^j) + w_5( {\,f_i^j } ). $$
Determining influence value.

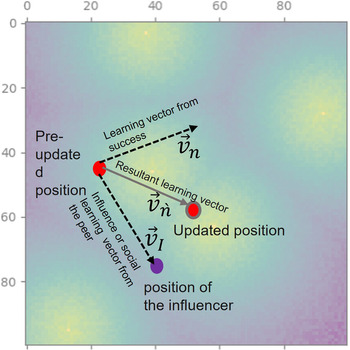
The updated position on an agent is the sum of the vectors of its resultant learning vector from recalled success and the influence value vector.

The amount of trust an agent i has an agent j depends on R and f (Costa, Reference Costa2003). R is the reputation of an agent j and f is the familiarity (i.e., how well does an agent i knows agent j). Familiarity, f between two agents, is calculated as the number of sessions agent i and j have worked together, therefore familiar with each other. Reputation, on the other hand, is given as Eq. (5.2), where N a is the number of solutions that are accepted by the controller agent and N p is the total number of the solutions proposed by an agent. Familiarity and reputation, in reality, may not be fully independent but here they are modeled as mutually independent parameters (Hinds et al., Reference Hinds, Carley, Krackhardt and Wholey2000). In the model, familiarity between the two agent increases with the number of idea generation sessions they have in common, as the agents at this point are not being shuffled (replaced, removed, or added), the familiarity is the same for all of them. Thus, familiarity being constant, reputation is the only factor that is affecting trust.
The weights in Eqs (5) and (5.1), w 1, w 2, w 3, w 4, and w 5 were decided after the empirical studies presented in the next section.
 $$R = \displaystyle{{N_{\rm a}} \over {N_{\rm p}}},$$
 $$\vec{v}_{{n}^{\prime}} = \sum\limits_{i = 1}^N {{\vec{v}}_{I_i} + {\vec{v}}_n}, $$
where  $\vec{v}_{I_i}$ is the total amount of learning by an agent i from its peers (arrow 3 as shown in Fig. 6) given in Eq. (6.1) and
 $\vec{v}_n$ is as calculated in Eq. (4). The resultant vector
 $\vec{v}_{{n}^{\prime}}$ is the total amount of learning an agent does while generating solutions to the design problem.
 $$\vec{v}_{I_i} = \sum\limits_{\matrix{ {\,j = 1} \cr {\,j\ne i} \cr } }^N {I_i^j }, $$
In the equation 6.1,N is the number of agents in a session n with the agent i and j is the initial starting index for its peers.
Studies show that an individual proposes more ideas when the team accepts their ideas and high self-efficacy individuals get lesser change in their self-efficacies (increase and decrease) than the ones with lower self-efficacies (Pearson ρ = −0.717, p-value < 0.001) (Singh et al., Reference Singh, Cascini and McComb2020). Similarly, an agent's change in its self-efficacy is simulated in the model. Figure 11 also shows that self-efficacy depends on an individual's motivation, which is impacted by an appreciation by team members or rewards (in terms of positive feedback) given by the superiors. Computationally, appreciation based motivation happens for an agent when other agents select its solution and reward-based when the controller agent provides good feedback (Ryan and Deci, Reference Ryan and Deci2000). Both of these forms of motivation contribute to the individual's change in self-efficacy. Despite the fact that these two phenomena have different mechanisms, they are modeled similarly.
Empirical studies
The development of the model presented in the previous section was guided by phenomena demonstrated in the psychology, sociology, and design literature. This section presents empirical studies that were conducted to improve the model in several ways:
• Validate the assumption: The work assumes that self-efficacy and trust could be the individual characteristics responsible for the influencer effect. Due to insufficient work done in the past to reveal the qualities of an influencer(s) in design teams, the experiments were conducted to get some initial insights.
• Determining the weights of the model equations: The additional insights were gained regarding the relationship among the model parameters that were used to estimate weights (w 1, w 2, w 3, w 4, and w 5) for Eqs (5) and (5.1) (given in the above section).
• Verify the model logic: The model logic such as the lower self-efficacy agents perceiving a greater number of influencers than higher self-efficacy was verified by the empirical study.
These two experiments presented here were observational in nature. Data collection from these experiments was done mainly through survey questionnaires. It was not mandatory for the participants to take part in the surveys.
Observation Experiment 1
Data collection
The experiment was set up to monitor design teams working on semester-long design task given by a company for a master's degree course of Methods and Tools for Systematic Innovation. There were 10 teams with 4–5 mechanical engineering graduate students in each of them.
The data werecollected twice in the form of online surveys (the link to the sample questionnaires is provided in Appendix B). Initial data collection was conducted when the course started and was related to collecting information about their self-efficacy (Carberry et al., Reference Carberry, Lee and Ohland2010) and problem-solving attitudes. The questions for determining self-efficacy were taken from Carberry et al. (Reference Carberry, Lee and Ohland2010), but the scale was changed from 10 to 4-point to match the scale of problem-solving questions. The questions related to the problem-solving attitude aimed to capture an individual's approach when handling a design problem. The same set of questions were used by Becattini and Cascini (Reference Becattini, Cascini, Corazza and Agnoli2016) to assess characteristics of creative instruments for problem-solving in students. The questionnaire and the scales employed here have already been validated and used by other researchers in the past (Carberry et al., Reference Carberry, Lee and Ohland2010; Becattini and Cascini, Reference Becattini, Cascini, Corazza and Agnoli2016). The second data collection was conducted after the students had started working in their respective teams on the given task. In order to map the difference in their problem-solving attitudes and self-efficacy, the questions used in the initial data collection survey were repeated besides some additional questions related to trust, familiarity and influencers on a 5-point Likert scales (5 being maximum) where Ohland et al. (Reference Ohland, Loughry, Woehr, Bullard, Felder, Finelli, Layton, Pomeranz and Schmucker2012) was used as a reference.
Results obtained
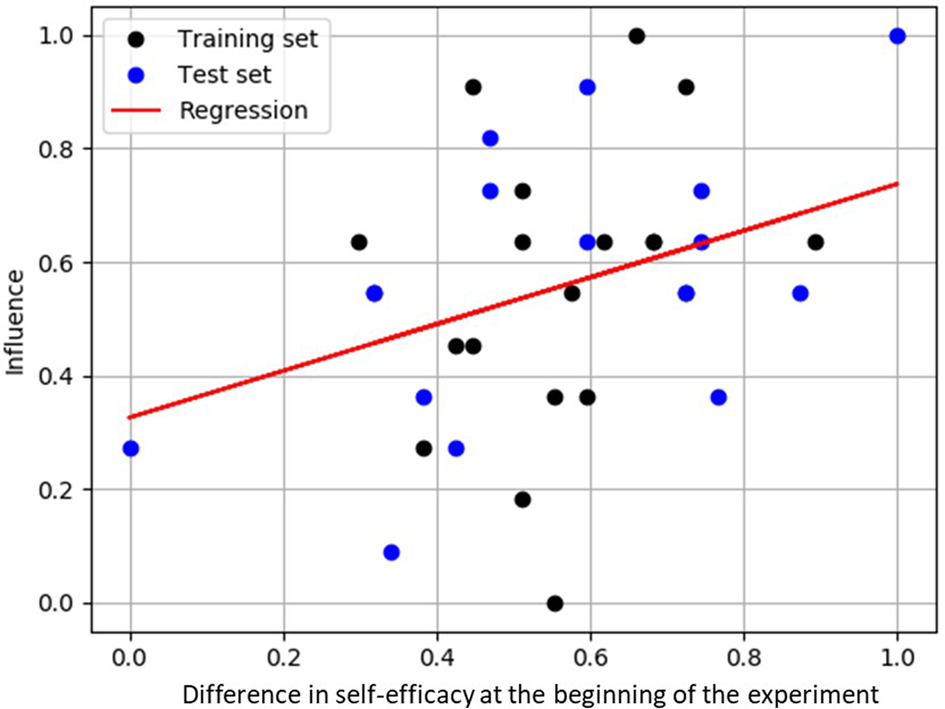
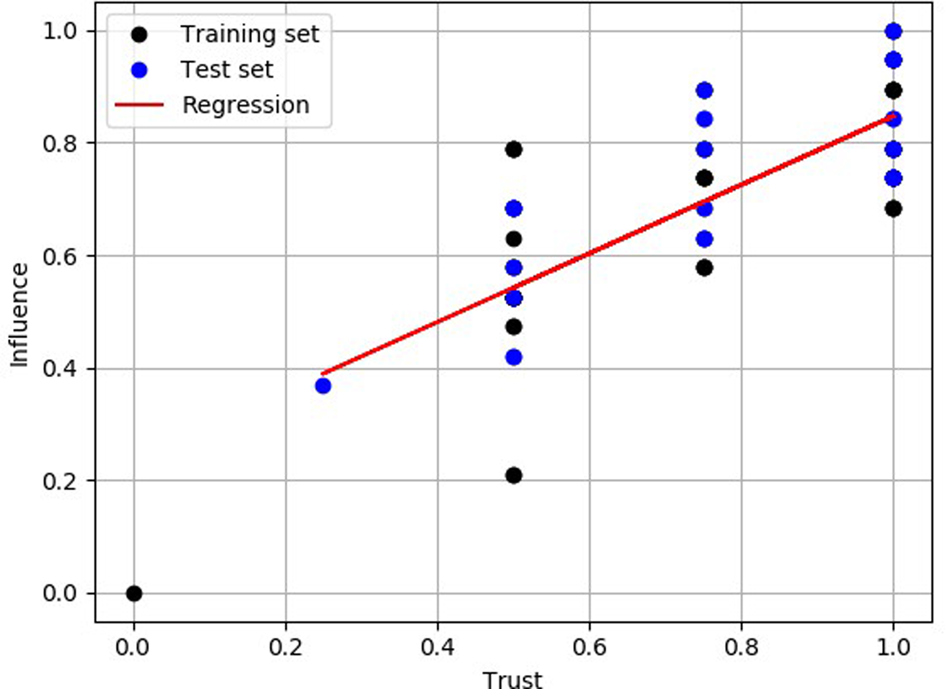
It was found that the difference in an individual's self-efficacy with respect to their peers could be responsible for perceived degree of influence from its peers . In other words, a positive correlation was found between the difference in the self-efficacy of an individual and its team member at the beginning of the experiment and the perceived influence value entered by the individual after they started working in teams (Pearson ρ = 0.41, p-value = 0.014).This means that individuals with low self-efficacy have more tendency to be influenced by others with higher self-efficacies. The impact of the difference in individuals' self-efficacy is not new as studies have shown that it affects team's social attributes like group identification and conflicts (Desivilya and Eizen, Reference Syna Desivilya and Eizen2005). Secondly, it was validated that trust plays an important role in determining influencers. It was found that trust between an individual and other individual team member after they started working in teams was positively correlated with its perceived degree of influence (Kendall τ = 0.6, p-value < 0.001). Thus, it conforms to the studies that have stated that trust affects individual relationships and team processes (Costa, 2003). The linear regressions between the perceived degree of influence and the difference in self-efficacies and trust could be seen in Figures 13 and 14 where the data set was shuffled and divided into training (67%) and test set (33%). Hence, the results of observation experiment 1 helped in supporting the assumption. As the data was collected using 4- and 5-point Likert scale, plots in Figures 13 and 14 show normalized values and show many overlapping data points.
Linear regression between delta self-efficacy and influence. Regression coefficient: 0.41. Mean squared error: 0.04. Variance score: 0.30.

Linear regression between trust and influence. Regression coefficients: 0.61. Mean squared error: 0.01. Variance score: 0.62.

Observation Experiment 2
Data collection
The second experiment was conducted to collect information related to decision-making during idea selection, but a minor portion of the experiment aimed at finding out the number of perceived influencers in a team. The experiment was set up during the EU's Erasmus+ project called ELPID,Footnote 1 where five teams of eight students from four different universities worked on a design task for a period of 3 days. The workshop was a sprint to introduce students to ideation techniques.
Though the teams were under observation throughout the workshop, the data collection was only performed on the second day of the workshop. The collection was done in the form of a short survey where the question related to their self-efficacy (similar to the one given in Appendix B) was measured on a 5-point Likert scale (5 being very self-confident in doing the engineering design activity). The question related to identifying the perceived number of influencers in a team was open-ended. The other questions that are out of the scope of this paper were mainly related to decision making during idea selection.
Results obtained
A slightly negative correlation (Kendall τ = −0.3, p-value = 0.03) was found between the individuals’ self-efficacy and the number of perceive influencers in their team. The low correlation could be because individuals with high self-efficacy are more likely to perceive others with high self-efficacy as influencers. This could be supported by the other findings such as the relationship between individuals’ self-efficacy and the degree of influence by them. A positive correlation (Kendall τ = 0.32, p-value = 0.013) was found between the individuals’ self-efficacies and their degree of influence as perceived by others. This means that those who had high self-efficacy were also perceived to have more influence value. Similar results were obtained by Singh et al. (Reference Singh, Cascini and McComb2020), where individuals who had high self-efficacy, also perceived high influence from the influencers (Pearson ρ = 0.55, p-value < 0.001). Hence, further supporting that perceived influence could depend on self-efficacy and the difference in self-efficacy of two individuals.
Implementation of the empirical results
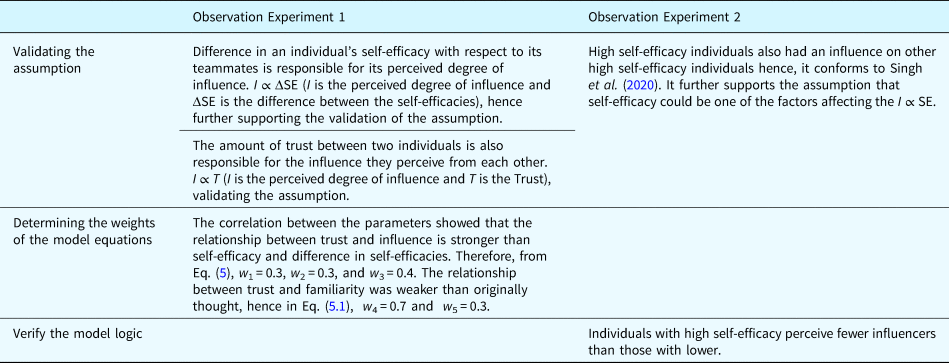
A summary of outcomes from the two observation experiments presented in this paper is given in Table 1.
Insights from the observation experiments that were used in the model

Model results and discussion
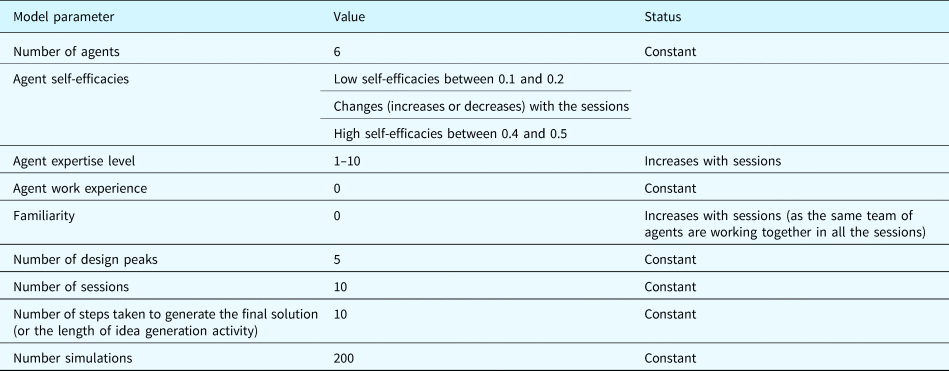
The model, which has now been verified through two empirical studies, is now used to conduct several computational experiments. Specifically, to test the effect of influencers on design thinking during idea generation, a few parameters were varied while keeping the others constant. In this case, the self-efficacy of each agent was allotted at the beginning of the simulation to control the number of influencers in the team. Trust, which is the other parameter to determine influencer(s), depends on the reputation of an agentsand was dynamic as itchanged with each session. Familiarity, at the beginning of the simulation was same for all the agents and was increased with every sessions that agents had in common. Other parameters, which could be relevant, such as team size, design task, the number of idea generation sessions, and the length of the session, were kept constant. All the agents begin without any previous experience of working on the same task. The detailed table of the status of the model parameters could be found in Appendix A. To check the functionality of the model, two scenarios were framed and tested. The first scenario tested the situation when the team has a high variationin the self-efficacy of its agents. Three subscenarios here were:
1. One agent with high self-efficacy and others with low (1 influencer)
2. Two agents with high self-efficacy and others with low (2 influencers)
3. Three agents with high self-efficacy and others with low (3 influencers)
The second scenario tested the situation when the team has low variationin the self-efficacy of its agents (i.e., all agents either have high or low self-efficacy initially). Two sub-scenarios here were:
1. All with low self-efficacy (i.e., no influencer)
2. All with high self-efficacy (i.e., all influencers)
This was done to understand the effect of influencers on design output due to the presence of an unequal distribution of influence in design teams. To see the functionality of the model, some of the findings are related to (1) difference in learning are presented while the other findings answer the research question are related to (2) quality of the solutions (Shah et al., Reference Shah, Smith and Vargas-Hernandez2003) and (3) exploration of design space (Dorst and Cross, Reference Dorst and Cross2001). As defined earlier in the “Model Description” section that the quality of the solution is the value of a point on a design solution space. The exploration of the agents is quantified in three different ways as given below. These three different measures were chosen as it would be useful to see how much the agents explore the design space while considering the quality and diversity of these explored solutions.
Exploration index (EI) is the number of points (solutions) explored when generating solutions on a lower resolution solution space (solnlowr) to the area of this lower resolution space (Arealowr) [Eq. (7)]. The lower resolution of solution space means that the original solution space (100 × 100 units) is decreased in size by a factor (5 in this case) so that the resultant is a smaller space (20 × 20 units). This means that if an agent explores solutions within five units of neighboring cells, it is counted as one unit of exploration. This simplification was done to avoid potential logical inconsistencies which could arise when an agent explores immediate neighbor cells to an agent exploring five cells at a larger unit distance.
 $${\rm EI} = \displaystyle{{{\rm sol}{\rm n}_{{\rm lowr}}{\rm \;}} \over {{\rm Are}{\rm a}_{{\rm lowr}}}}.$$
Exploration quality index (EQI) is the ratio of the number of solutions explored on a lower resolution solution space (solnsr) with solution quality above a certain threshold, t (in this case, t is above 0.5, where 0 is a minimum and 1 is a maximum solution quality value) to the total number of solutions (totSolnr) available on the design solution space greater than the threshold value [Eq. (8)]. This means that if an agent explores solutions within five units of neighbouring cells, the EQI will be the mean of the solution values of these 5 cells. Similar to EI, this simplification helped in evaluating the quality of the explored solutions while avoiding the inconsistencies which could arise when an agent explores immediate neighbour cells to an agent exploring five cells at a larger unit distance.
 $${\rm EQI} = \displaystyle{{{\rm solns}\;_r} \over {{\rm totSol}{\rm n}_r}}.$$
Spread is the dispersion of the solutions from the centroid of the solutions. The spread of the solutions obtained was calculated to see how different the solutions were from each other (i.e., variety of the solutions).
The agent idea generation results are related to the exploration and quality of the solution. The results are from five peak design space (i.e., five best solutions) to get an insight into how different compositions of influencer(s) affect idea generation in this design task setting. The results are calculated based on the Monte Carlo logic to reduce the effect of randomness; hence, the results below are based on 200 simulations.
The results related to different learning styles:
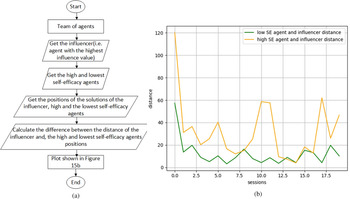
Figure 15b shows how low and high self-efficacy agents behave during idea generation based on Figure 15a shows the flowchart of the extraction of the required data from the simulation. The figure shows the distance between the solutions of a low and high self-efficacy agent with respect to an influencer (here the maximum sessions were 20). It could be inferred that a high self-efficacy agent (but lesser than the self-efficacy of an influencer) explores solutions differently than an Influencer, while a low self-efficacy agent (is the one with the lowest self-efficacy in the team) generates solutions closer to that of an influencer. This aligns with expectations on the nature of influence in design teams and corresponds to Brown and Pehrson (Reference Brown, Pehrson, Brown and Pehrson2019), where it was stated that some individuals are more influenced by the influencer(s) than others.
(a) A flowchart showing the steps taken to plot 15b. (b) An example showing the distance between the low and high self-efficacy agents from the influencer (for maximum sessions = 20).

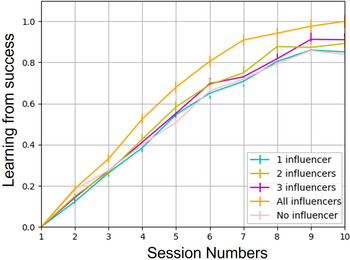
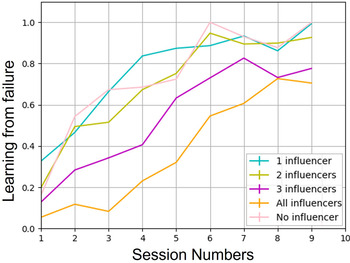
The learning modeled in this work could be associated with Associative Learning that states that ideas and experiences reinforce each other and can be mentally linked to one another (Paivio, Reference Paivio1969). This type of learning is a form of conditional learning that is based on the theory, which states that an individual's behavior could be modified or learned based on a stimulus and a response (Paivio, Reference Paivio1969). For example, if an agent's solution was bad (i.e., it got poor feedback from the controller agent) (stimulus), it will not produce similar solutions (response) (i.e., avoiding that area on the solution space). Based on the relationship between the two stimuli (current and recalled events), associative memory can be called (Paivio, Reference Paivio1969). The agent uses both the positive and negative reinforcers (stimuli used to change behavior), to modify the way they generate their current solution. Figures 16 and 17 show agents with the lowest self-efficacy in teams with a varying number of influencers learn from their successes and failures for a design task with five best solutions. Learning from success and failure has been explained in the Model description, where agents avoid the failures they have committed in the past and tend to follow the path that led to previous success. The curves obtained in the results shown in Figure 16 are similar to the learning curves described in Leibowitz et al. (Reference Leibowitz, Baum, Enden and Karniel2010). There is not much difference in the success learning curves (Fig. 16), with the lowestself-efficacy agents in teams of all influencers learning slightly more from their success than other team combinations. The failure learning results shown in Figure 17 are more divergent and agents in the teams when all agents start at high self-efficacy (all influencers) have the least ability to learn from failure than the other combinations tested. Concerning learning from failure, all the lowest self-efficacy agents in the team with no influencer, 1 influencer, and 3 influencers, learn more from their failures toward the end of a project. In general, it could be seen from Figure 17 that the learning from failure becomes steady toward the end of a project. The slope of the failure learning curves (failure rate) exhibit somewhat similar behavior to the “early failure” phase (widely used in reliability engineering) (Wilkins, Reference Wilkins2002), where the rate of failure decreases with time, hence the system improves (Proschan, Reference Proschan2012).
Learning from success.

Learning from failure.

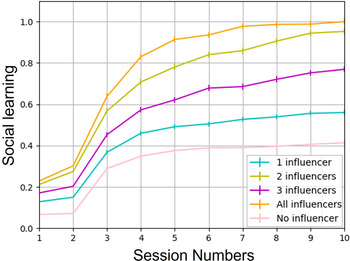
Social influence, which leads to the imitation in individuals to modify opinions, attitudes, and behavior similar to the others they are interacting with, is referred to as social learning. As it could be seen from Figure 18, the influence of individuals is unevenly distributed in a team, consequently, is social learning. The amount of social learning in the teams where the ratio of influencers to non-influencers (i.e., low self-efficacy agents) was half and agents in teams with all influencers, social learning could be seen high throughout the project, while minimum when all agents have low self-efficacy when they start working (Fig. 18). Social learning curves are similar to the ones obtained in other domains of study such as online gaming (Landfried et al., Reference Landfried, Fernández and Mocskos2019) or during diffusion of innovation (O'Brien and Bentley, Reference O'Brien and Bentley2011).
Social learning.

The results related to the quality of the solutions:
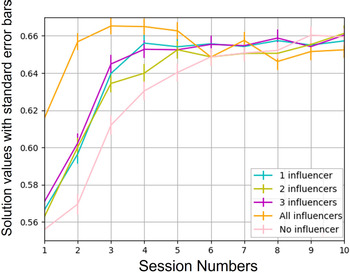
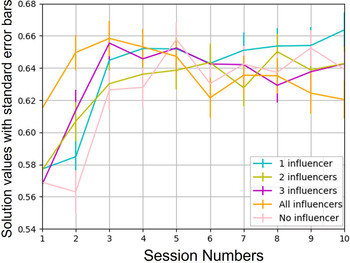
The results related to design quality for a 5-peak configuration of a design task with respect to different influencer/non-influencer team compositions could be seen in Figure 19 (ANOVA F = 34.02, p < 0.001). The pairwise (post hoc T-test) comparisons of the generated solution quality were also statistically significant for all the cases except two (i.e., teams with 1 and 2 influencers, and teams with 1 and 3 influencers solution quality). Agents in the all influencer team, on average had better solution quality than other team compositions. In general, the quality of solutions increases with the idea generation sessions with minor divergence. This shows that all agents in the model are learning (from different modes as shown in Fig. 6). One possible reason for this could be because the individuals in teams compare their performance with the others in the teams, hence converge in their solution quality (Larey and Paulus, Reference Larey and Paulus1999). They are storing the events in their memory and recalling the ones associated with their current situation (explained in the “Model description” section). Recalling these events and associating them to the current situation enhanced idea generation (Dugosh and Paulus, Reference Dugosh and Paulus2005). The quality results of the model are consistent with the study done by Brown et al. (Reference Brown, Tumeo, Larey and Paulus1998) and Paulus (Reference Paulus2000), where it was shown that exposure to others’ ideas may increase the quality of ideas generated. By narrowing down, one could observe that agents in the teams of no influencer produced better quality ideas after the second half of the project while the opposite could be seen in teams of all influencers. Figure 20 shows the quality of solutions of the lowest self-efficacy agent in different team compositions (Kruskal–Wallis H = 4.75, p = 0.31). It shows that agents with the lowest self-efficacy in teams behave similarly when generating solutions, irrespective of the influencer team composition.
Mean solution quality for all the agents in a team.

Mean solution quality for the lowest self-efficacy agent in a team.

The results related to exploration values:
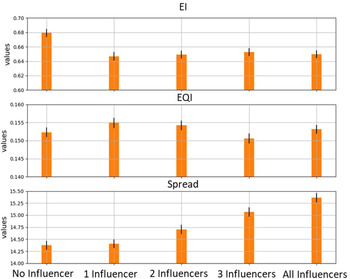
In general, it can be seen from Figure 21(top) that the teams with well-defined influencers and all influencers have a lesser exploration index (EI) than no influencer teams. The exploration of solutions on the design space by all the teams differs significantly (Kruskal–Wallis H = 18.70, p < 0.001). The pairwise comparison (post hoc Conover's test) further confirmed that agents in all and well-defined influencer teams behave significantly different from no influencer team composition. This could mean that due to a lesser number of influential agents, agents in the team keep exploring new areas on the design solution space. The quality of solutions explored (EQI) by the individual agents during idea generation could also be seen in Figure 21(middle). Even though it seems that few influencer teams (like 1 and 2 influencers) had better EQI, the compositions did not differ significantly in their EQI values (ANOVA F = 1.53, p = 0.19). Teams with or without well-defined influencers had similar EQI. A weak positive correlation was found between EI and EQI (Kendall τ = 0.2, p-value < 0.001), which suggests that as the agents explore more, they have a better chance of generating an above-average solution. This model behavior does not explicitly contradict the studies that state that exploring a greater percentage of design space does not explicitly guarantee to find better alternatives (Ehrich and Haymaker, Reference Ehrich and Haymaker2012; McComb et al., Reference McComb, Cagan and Kotovsky2015). As well as it does not explicitly, conforms to the studies that state that larger exploration has more possibility to have high quality solutions (Danes et al., Reference Danes, Lindsey-Mullikin and Lertwachara2020). One main reason could be the configuration of the design space with five peaks. As the number of best solution peaks were more, hence a greater probability of finding higher quality solutions on exploring.
Exploration values (EI, EQI, and spread).

The diversity in the generated solutions as seen from Figure 21(bottom) in all the cases differs significantly (Kruskal–Wallis H = 84.78, p < 0.001). After conducting a pairwise comparison (post hoc Conover's test), it was found that agents in the teams with few well-defined influencers (1 and 2 influencers) behave similarly when generating solution (i.e., follow the influencer). Agents with all low self-efficacy (no influencer) also behaved similar to the 1 and 2 influencer team agents. While agents in teams with half influencers and all agents with high self-efficacy generate more diversity in the solutions as seen from Figure 15b that high self-efficacy agents are not afraid to explore on their own. Social influence is a dynamic in nature, as the influencers influence others in the team, they become is influential and the former start becoming more influential (Brown and Pehrson, Reference Brown, Pehrson, Brown and Pehrson2019), this phenomenon is more prominent in the teams of no influencer as they had least variety. It could be inferred that fewer influencers influence others in the team to imitate them in their solution. One influencer means exploring the solutions close to that influencer, this increases when the influencers become 2 and so on. As all agents have low self-efficacy, so when an influencer emerges among them, they blindly explore areas near the influencer, thus low spread. Paulus and Dzindolet (Reference Paulus and Dzindolet2008) stated that due to social comparison, individuals tend to move toward the direction of the social comparison referent (influencer(s)) and mimic the performance of their co-workers. As there are fewer influencers (either intentionally assigned or emerge) in 1 influencer and no influencer teams, the other noninfluencers follow one agent, hence lesser spread than the other team compositions. The other explanation could be that the EI value that gives an idea about the exploration while spread shows the dispersion of the solutions from the centroid of the solutions. This could mean that the agents in the no influencer teams explored more the design space while the explored solutions were at a somewhat equal distance from the centroid, hence low dispersion value. In the case of all influencers, agents have high self-efficacy hence more capability to explore other than the solutions of an “emerged influencer(s)”. A general trend in the exploration (EI) and diversity in the generated solution could be seen where higher exploration was correlated to higher diversity in the generated solutions (Kendall τ = 0.4, p-value < 0.001).
The behavior of teams without well-defined influencers (i.e., no and all influencers) differed from each other, as in no influencer team behavior tended toward teams with a few defined influencers (like 1 or 2 influencers). The influencer(s) might have emerged in the no influence team as the team moved from one session to another. Since there were fewer influencers (either intentionally assigned or emerge) in 1, 2, and no influencer team, the other non-influencers follow them, hence lesser spread than the other team compositions with more influencers (like 3) or all with high self-efficacy (all influencer). In the case of all influencers, agents have high self-efficacy hence more capability to explore than no influencer team where an influencer might have emerged, and agents had low self-efficacy.
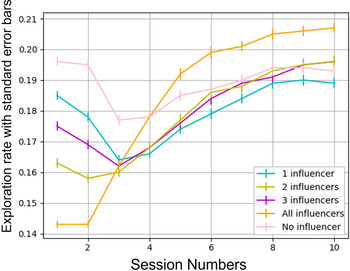
The exploration rate, which is the number of solutions in a design space explored during a session, without considering the ones in the previous session could be seen in Figure 22. In general, the exploration rate during sessions three to five is lower than in other sessions in teams of no to a few prominent influencers. This could suggest that the effect of the influencers on exploration is maximum somewhat in the early middle of the project, as it is known from Agars et al. (Reference Agars, Kaufman, Locke, Mumford, Hunter and Bedell-Avers2008) where group-creativity is a “function of the extent to which social influences affect individuals within the group at earlier stages”. On the contrary teams with all influencers, which have the least exploration rate initially, dramatically increase their exploration rate than other teams after four to five sessions.
Session-wise exploration rate.

Summary
Like any other collaborative design session, the simulation starts with a design task given to a team of agents who must produce solutions. Agents generated solutions based on the learning rules assigned to them. The effect of the influencers on idea generation was simulated and the results were discussed as the answers to the research question. However, before investigating the research question, it was crucial to gain insights into the characteristics that give rise to an influencer in a design team, therefore an assumption was made that self-efficacy and trust are characteristics that determine how individuals perceive the degree of influence by others in the team.
The assumption was validated by the results from the empirical studies where it was found that self-efficacy and trust could be some of the characteristics resulting in the perceived degree of influence in design teams. It was found that if an individual had lesser self-efficacy than the other, the difference in their self-efficacies was responsible for the perceived degree of influence by the individual with less self-efficacy. Trust between the two individuals was highly positively correlated to the perceived degree of influence. This means that if an individual trusts the other, they also perceive the other individual as influential. Lastly, individuals with high self-efficacy might perceive fewer influencers than those with lower.
The insights for the empirical studies were used to tune the model, and subsequently, a series of simulations were used to explore the relationship between influence distribution and design outcomes. The simulation results show that both low and high self-efficacy agents were affected by influencers. A low self-efficacy agent explored solutions closer to that of an influencer than a high self-efficacy agent. Agents also learnt from past positive or negative events throughout the project. As learning from positive experience increased, learning from the negative events became stable. The quality of the solutions increased with the number of idea generation sessions as the agents learnt from their past events and others in the team. The generated solution quality values of teams with well-defined influencers differed significantly from the teams without well-defined influencers. This shows that the agents in the teams are affected by the presence of influencers in teams when generating solutions. Teams with one prominent influencer have a similar effect on their team agents’ solution quality as of teams with multiple influencers (in this case 2 or 3 influencers). Despite the second half of the project where agents in no influencer teams produced better quality ideas, all influencers on average had better quality than all the team compositions.
Agents in teams with well-defined influencers and all with similar high self-efficacy (all influencers) had lesser exploration (EI) than teams where all agents had low similar self-efficacy (no influencer). The quality of the explored solutions (EQI) by individual agents during idea generation was not affected by the presence of influencers. However, the dispersion of the solutions (spread) or variety in the generated solution was lesser for the teams with no or few defined influencers than teams with more influence (3 and all influencers). The exploration rate was lower during the first few sessions in the teams of no influencers and a few prominent influencer teams. Agents in teams with one prominent influencer had less exploration rate toward the end of a project. Overall, all high self-efficacy agents (all influencers) start exploring more and more somewhat after the middle of the project. The impact of the influencers on session-wise exploration was found to be stronger somewhat in the early middle of the project.
Conclusion
Many factors could affect the outcomes of collaborative design activity. Here, a computational model was constructed to facilitate the study of these factors. Specifically, this model was capable of exploring the effect of social influence in the team. Social influence (which give rise to imitation behavior called social learning) is known to affect brainstorming and hence design outcomes like quality and exploration values but has not been studied in detail. The initial model was constructed from the existing literature. The results are thought-provoking and could be used to deduce patterns in individual and team behavior due to the unequal distribution of influence in design teams. They help in recognizing individuals’ and team outcomes, which would assist in taking appropriate action and thus more control over managing design activity for better results. The results clearly demonstrate that the presence of a few prominent influencers affects design outcome by limiting variety (spread) and enhancing quality (especially when all the agents have low self-efficacy), thus addressing the research question that is, what is the effect of influencer(s) on idea generation outcomes (exploration and quality)? The social influence or in other words individuals with high social influence called influencers positively or negatively influence brainstorming of others in the team, depends on the cognitive state of the brainstormer (Brown et al., Reference Brown, Tumeo, Larey and Paulus1998) (i.e., the self-efficacy levels of the team members) as well as on the desired nature of design output (i.e., whether the higher variety is required or quality). However, the results mentioned above should be considered as insights instead of actual understandings, as they would vary with the complexity of the task modeled, the number of agents and learning rules. Although authors have also analyzed results related to 1, 3, and 12 peaks design space configuration, to enhance clarity and space limitation, the results presented here are confined to 5 peaks. Although the strength of this research is the simplification of the experimental scenarios, it is important to be explicit on how far one can take the results presented in the model. Although the results are applicable in their respective settings, they still need validation from the real experiments. They are not indicating the exact behavior of influences, but rather they could be interpreted as indications of how influencers are affecting design teams. Undoubtedly, more work needs to be done to see how influencers in the design team affect team and organization creativity. This includes (1) the assumed relationship between trust, self-efficacy, and influence, (2) the mutual relationship between trust and familiarity, (3) the design space representation, (4) a richer representation of communication and collaboration, (5) a more nuanced model for the effect of influence based on agent traits, and (6) the representation of the other forms of social learning.
The adherence of many of the results from the simulation to patterns shown in the literature provides partial validation of the model. However, further validation using additional empirical experiments should be a major focus of future work. The wider purpose of the work is to provide a computational approach that focuses on representing the collaborative process, underlying its results on project outcomes. The key advantage of this computational approach lies in providing suggestions on patterns (related to design outcome) of design team activity. This model may provide useful insights for building suitable strategies for team building and team performance.
Appendix A
The values of model parameters that were assigned when an idea generation activity starts

Appendix B
Link to the questionnaires:

Part 2 additional: https://forms.office.com/Pages/ResponsePage.aspx?id=K3EXCvNtXUKAjjCd8ope6-5WK7zPMwFMqdi9F2m40mJUOEdTVEpZTlJKSkgyM1o1NkVRQVJVNFBPMC4u

Harshika Singh is a research assistant and a former PhD student at the Department of Mechanical Engineering at Politecnico di Milano, Italy. Along with her primary research, which is to understand design team dynamics, she also works as a research fellow for European Union Projects such as OIPEC (Open innovation Platform for University-Enterprise Collaboration), ELPID (E-learning Platform for Innovative Product Development), and Project Interreg between Italy and Switzerland. Her areas of interest also include methods and tools for new product development, design creativity, and data-driven design.
Gaetano Cascini holds a PhD in Machine Design and is a Full Professor at Politecnico di Milano, Department of Mechanical Engineering. His research interests cover Engineering Design Methods and Tools with a focus on the concept generation stages both for product and process innovation, as well as design cognition and its experimental investigation. He is a Co-Editor in Chief of the International Journal of Design Creativity and Innovation (Taylor and Francis) and a member of the Design Society Board of Management. He has coordinated several research projects: among the others the European projects FORMAT (FORecast and Roadmapping for MAnufacturing Technologies), SPARK (Spatial Augmented Reality as a Key for co-creativity), and OIPEC (Open Innovation Platform for University-Enterprise Collaboration).
Christopher McComb is an Associate Professor in the Department of Mechanical Engineering at Carnegie Mellon University. Prior to this, he was an Assistant Professor in the School of Engineering Design, Technology, and Professional Programs (SEDTAPP) at Penn State University, where he was a director in the Technology and Humans Research in Engineering Design (THRED) Group. McComb attended California State University-Fresno and received dual BS degrees in Civil and Mechanical Engineering. He later attended Carnegie Mellon University as a National Science Foundation Graduate Research Fellow and obtained his MS and PhD in Mechanical Engineering. His research interests include team-based design and engineering methodologies, machine learning for engineering design, and STEM education.