
I. INTRODUCTION
Research in electrodes for solid oxide fuel cells (SOFCs) is an active field spanning materials synthesis, physical chemistry, and electrochemistry. Reference Weber and Ivers-Tiffee1 While reduced operating temperatures in the 300–500 °C range could enable the use of solid oxide fuel cells for portable applications, many elementary processes that are thermally activated may suffer, leading to diminished power density. Hence, there is a great need to explore new materials that can perform as catalysts for fuel oxidation and moreover develop fundamental understanding of reaction phenomena under dynamic conditions.
Noble metals such as Pt or Ru make excellent catalysts at these temperature ranges. However, they suffer from morphological instability. Reference Kerman, Lai and Ramanathan2–Reference Ryll, Galinski, Schlagenhauf, Elser, Rupp, Bieberle-Hutter and Gauckler4 Group IV–VI transition metal carbides are interesting candidate systems as they show properties of both ceramics and metals. Reference Goldschmidt5–Reference Toth7 In particular, carbides of tungsten are widely used engineering materials in wear-resistant applications due to their refractory nature. WC shows high hardness, high melting temperature, and low friction co-efficient, which suggests long term microstructural stability at high operating temperatures. Interestingly, WC also possesses high electrical conductivity comparable to some metals (∼0.5 × 10⁵ S/cm at 300 K). Reference Pierson8,Reference Kittel9
Another unique aspect of WC is that it is catalytically active for hydrogen and hydrocarbon fuel oxidation, similar to that of the Pt-group metals. Reference Levy and Boudart10–Reference Houston, Laramore and Park12 In an early study, Levy and Boudart noted the resemblance between WC and Pt in surface catalysis due to similarities in the valence band structure of WC and Pt. Reference Levy and Boudart10 Subsequent studies have compared the catalytic performance of transition metal carbides and Pt-group metals. Reference Colton, Huang and Rabalais13–Reference Hwu and Chen15 WC is also being studied as an electrocatalyst for proton exchange membrane and direct methanol fuel cells that operate at near room temperature, aiming to replace noble metal catalysts. Reference Ross and Stonehart16–Reference Ganesan and Lee19 Fewer studies exist on the use of carbides as anodes for high-temperature fuel cells. Torabi et al. investigated WC in the composite form of WC-yttria stabilized zirconia (YSZ) as a candidate anode for SOFCs operating above 800 °C. Reference Torabi, Etsell, Semagina and Sarkar20–Reference Torabi and Etsell22 The cells based on a 20 vol% WC-infiltrated porous YSZ anode was reported to obtain a maximum power density of 45 mW/cm2 in 80%H2–20%CH4 mixed fuel and 15 mW/cm2 in pure methane at 800 °C; the incorporation of Ru, Ni, and ceria improves the performance to 120 mW/cm2 in 80%H2–20%CH4 mixed fuel and 40 mW/cm2 in pure methane.
Some of the challenges in implementing non-oxide carbide layers in a fuel cell include control of film morphology, stoichiometry, crystal structure, and carbon vacancies. Tungsten carbide has several stoichiometric compositions, among which WC and W2C are the main phases. Reference Kurlov and Gusev23 WC has two forms, a hexagonal structure for α-WC and a rock salt structure for β-WC, while W2C has a hexagonal close packed structure. Reference Kurlov and Gusev23 At the same time, tungsten carbide may exist as WC1−x , which has a face centered cubic structure. Reference Kurlov and Gusev23 Tungsten carbide is also sensitive to oxidants, such as oxygen or water, Reference Newkirk24–Reference Andersson and Bergstrom27 which are normally present in fuel cell environments. Although the redox stability of WO3 and the potential application of WO3-infiltrated W–Cu–ScYSZ SOFCs anode at 650 °C were reported, Reference Hussain, Sudireddy, Hogh and Bonanos28 the oxidation state of the tungsten carbide will influence not only its catalytic performance but also electron transport, both of which significantly affect the functionality at the electrode. Under operating conditions for SOFCs, chemical stability against oxidation and decomposition varies greatly and needs to be carefully evaluated through thermodynamic analysis.
In this work, we present a study of WC as an anode in low temperature SOFCs. This was done by calculating the thermodynamically stable phases under operating environment, careful optimization of synthesis to tune film morphology and structure, and direct measure of catalytic activity in a flow reactor designed to interface with fuel cells. The findings demonstrate the potential of WC as a working anode in low temperature SOFCs that utilize hydrocarbon fuels and may also expand the application of carbides as catalysts in industrial fuel processing.
II. EXPERIMENTS
A. WC thin film sputter deposition
WC thin films were prepared by D.C. magnetron sputtering (AJA International, Scituate, Massachusetts). The target was 2″ diameter, 99.5% purity WC (ACI Alloys, San Jose, California). The deposition atmosphere was pure Ar with a flow rate of 20 sccm and pressure of 4, 10, 20, or 75 mTorr. Growth pressure was controlled using an adaptive pressure regulator controlling a throttle valve. Deposition power was 150 W, and the deposition temperature was room temperature. 200 nm thick SiNx coated 500 μm thick Si or scandia doped zirconia (ScDZ) cells (Fuel Cell Materials, Lewis Center, Ohio) were used as the substrates for thin film characterization as shown in Supplementary Material Fig. 1.
B. WC thin film characterization
The thicknesses of the sputtered thin films were measured using a surface profilometer (Dektak 6M, Veeco, Oyster Bay, New York) (also confirmed by cross-section scanning electron microscope). X-ray diffraction (XRD; D2, Bruker Corporation, Billerica, Massachusetts) using conventional θ−2θ diffraction geometry determined the films' crystal phase and texture. The compositions of the films were analyzed using x-ray photoelectron spectroscopy (XPS; K-Alpha, Thermo Scientific, Waltham, Massachusetts). XP spectra were collected using a 400 μm spot size and 20 eV pass energy from an Al monochromated source after 60 s of Ar plasma sputtering at 200 eV to remove any surface contaminants. W 4f XP spectra were deconvoluted using CasaXPS software with each region fitted with a Shirley background and each peak fitted using a GL(30) line shape. W 4f 7/2 and W 4f 5/2 peaks were fitted by the software by constraining the full width at half maximum to be equal and allowing the peak positions and areas to float while minimizing the residual. Accuracy of the fit was determined by the separation of the W 4f 7/2 and W 4f 5/2 peaks, which is 2.1 eV. Our fits all resulted in peak separations of between 1.9 and 2.1 eV. Surface morphologies were investigated using field emission scanning electron microscope (FESEM; Ultra-Plus, Carl Zeiss AG, Oberkochen, Germany). Quantitative porosity was estimated using ImageJ software.
C. Thermodynamic analysis of carbide stability
Thermodynamic calculations were performed using the Equilibrium Compositions module in HSC Chemistry software (Outokumpu Research Oy, Version 5.11, Pori, Finland). This software has an extensive thermochemical database with more than 17,000 compounds. For a specified reaction system with its species, phases, the amounts of raw materials, and temperatures, the Equilibrium Compositions module enables the calculation of products at equilibrium in isothermal and isobaric conditions.
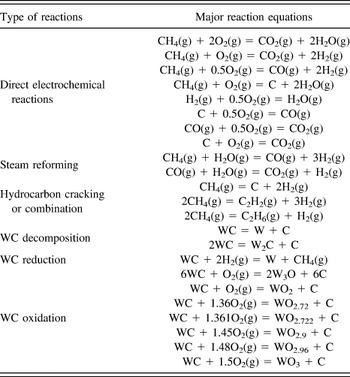
In our study, thermodynamic data of 63 chemical species consisting of chemical elements (W, C, H, and/or O) were taken into account (see details in Table I). To simulate the fuel cell anode environment, we studied a closed reaction system consisting of 1 mole of WC and 100,000 mole of fuel gas of different compositions in the temperature range of 0–900 °C at 1 atm. The large ratio of fuel gas amount to WC amount (100,000:1) was set based on the fact that fuel gas was continuously supplied to the anode during fuel cell operation. The fuel gas compositions studied include both dry and 3% humidified pure H2, 80%H2–20%CH4, 50%H2–50%CH4, and pure CH4. The equilibrium composition of the products of WC in the fuel gas versus temperature was derived via the Gibbs free energy minimization method.
SOFC reactions considered for the thermodynamic stability of WC. A list of the reactions, including direct electrochemical reactions; steam reforming; hydrocarbon cracking and combination; and WC decomposition, reduction, and oxidation taking place at the WC anode side of the SOFC with a mixture of H2/CH4 as fuel and air as oxidant. The O2 either comes from water bubbler or from the air on the cathode side.

D. Solid oxide fuel cells fabrication and electrochemical measurements
WC anode/ScDZ electrolyte/Pt cathode (WC/ScDZ/Pt) SOFCs were fabricated using 130–170 μm thick ScDZ substrates (Fuel Cell Materials) as model electrolytes [Supplementary Material Fig. 1(d)]. Pt was initially chosen as a cathode as it is a commonly used electrode in this operating temperature range. The Pt cathode was sputter deposited at 250 W, 75 mTorr, and room temperature, resulting in a 75 nm thick film with optimal nanoporous structure. Reference Kerman, Lai and Ramanathan2 WC anodes were deposited as described above.
WC anode/ScDZ electrolyte/lanthanide strontium cobalt ferrite (LSCF) [(La0.6Sr0.4)0.95Co0.2Fe0.8O3−x ] cathode (WC/ScDZ/LSCF) and Pt anode/ScDZ electrolyte/LSCF cathode (Pt/ScDZ/LSCF) SOFCs were fabricated using prefabricated half cells consisting of 130–170 μm thick ScDZ electrolyte and ∼30 μm thick LSCF cathode (Fuel Cell Materials). LSCF cathode has a perovskite structure, mixed ionic and electronic conduction, and stable oxygen reduction activity, making it a suitable cathode in SOFCs. Reference Xiong, Lai, Johnson and Ramanathan29 75 nm thick Pt anode was sputter deposited at 250 W, 75 mTorr, and room temperature for an optimal nanoporous structure. Reference Kerman, Lai and Ramanathan2 WC anode was sputter deposited at 150 W, 10 mTorr, and room temperature with a thickness of 160 nm [Supplementary Material Figs. 1(e)–1(g)].
Fuel cells were evaluated in a custom-designed fuel cell test station (Supplementary Material Fig. 2). Each experiment was performed on at least two anodes to verify results, with typically only one data set shown. The temperature was ramped up from room temperature to the desired temperature at a rate of 20 °C/min. The fuel gas mixture flowed at 100 mL/min to the anode side, while standing air was used as oxidant at the cathode side. Unless otherwise specified, the fuel gas was a mixture of 80%H2–20%CH4. Current density versus voltage scans were performed from the measured open circuit voltage (OCV) to 0 V at a scan rate of 20 mV/s and electrochemical impedance spectroscopy (EIS) scans were performed from 106 to 1 Hz with 20 mV amplitude using a Solartron 1260/1287 electrochemical test setup (Solartron Analytical, Farnborough, United Kingdom).
E. Flow reactor studies on fuel utilization
Flow reactor tests were done in a custom-designed electrochemical flow reactor (Supplementary Material Fig. 3). In brief, WC/ScDZ/LSCF SOFCs were sealed onto an alumina reactor tube with Ceramabond 552 alumina cement (Aremco Products, LLC, Valley Cottage, New York), which was fitted into the flow reactor. Fuel gas flowed at 20 mL/min to the anode, while standing air was used as the oxidant at the cathode side. Silver mesh (Alfa Aesar, Haverhill, Massachusetts) electrodes were attached to the anode and cathode by means of silver paint (Structure Probe Inc., Westchester, Pennsylvania), and silver wires connected these electrodes to a BioLogic SP-200 potentiostat (BioLogic Science Instruments SAS, Claix, France), which was used to collect current versus voltage and EIS scans, and to modulate the applied current, allowing for controlled oxygen anion flux across the electrolyte membrane. The output gas from the flow reactor was directed into a Shimadzu GC-2014 gas chromatograph (GC; Shimadzu Corp., Kyoto, Japan), which was used to analyze the gas stream for fuel cell reaction products. Prefabricated ScDZ/LSCF substrates with silver mesh electrodes were used for controlled oxygen anion transport measurements (Supplementary Material Fig. 4).
The GC was calibrated using external gas standards from Air Liquide with known concentrations of O2, N2, H2, methane, ethane, ethene, CO2, CO, and acetylene. These 9 molecules were identified by their unique retention times through our instrument, which were known and verified by the manufacturer. These calibrations of O2, H2, and methane were independently verified, along with their retention times, using mass flow controllers to flow known concentrations of these gases through our flow reactor and comparing this with their measured concentration by GC. The retention time and calibration of N2, O2, and CO2 were also independently verified by injecting air from the room and ensuring that measured concentrations matched known atmospheric concentrations of these molecules.
III. RESULTS AND DISCUSSION
A. Thermodynamic stability of WC: calculations and experimental correlation
The chemical stability of WC is a determining factor in catalytic performance, requiring careful evaluation of the phases present under SOFC operation conditions, including temperature and partial pressures of fuel species and products. The thermodynamic stability of WC in H2/CH4 fuel was evaluated using HSC Chemistry database.
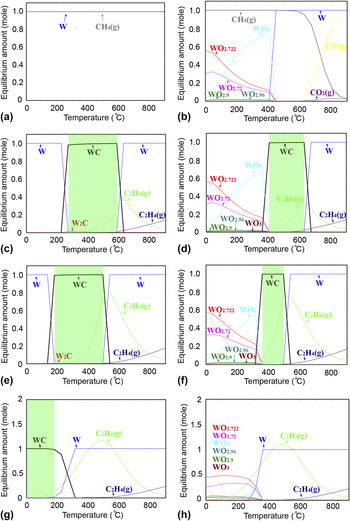
The stable phases present depend strongly on the gas-phase composition and temperature (Fig. 1). Thermodynamic analyses indicate that WC decomposes to W in dry H2 or CH4 at the target operating temperature window of 300–500 °C [Figs. 1(a) and 1(g)]. Addition of 3%H2O to H2 or CH4 leads to degradation of WC to various tungsten oxide phases at temperatures below ∼400 °C [Figs. 1(b) and 1(h)]. In contrast, WC is stable in a dry 80%H2–20%CH4 environment between 300 and 580 °C [Fig. 1(c)] and in a dry 50%H2–50%CH4 environment between 200 and 500 °C [Fig. 1(e)]. The stability of WC also depends on water content. In humidified 80%H2–20%CH4 and 50%H2–50%CH4, the stability window of WC shrinks to 410–620 °C and 350–500 °C, respectively, due to the formation of tungsten oxides.
Thermodynamic stability of WC in H2/CH4 fuel mixture. Thermodynamic equilibrium composition of products when 1 mol of WC is exposed to (a) dry H2, (b) 3% humidified H2, (c) dry 80%H2–20%CH4, (d) 3% humidified 80%H2–20%CH4, (e) dry 50%H2–50%CH4, (f) 3% humidified 50%H2–50%CH4, (g) dry CH4, and (h) 3% humidified CH4 between 0 and 900 °C. The temperature window for WC stability is highlighted in green. The detailed set of chemical reactions considered in the stability analysis is listed in Table I.

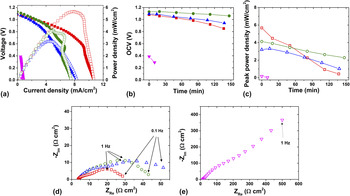
Fuel cell experiments in various fuel mixtures were conducted to compare with calculations on the material stability (Fig. 2). Four identical SOFCs with WC anodes were tested with the same oxidant (air) but different fuel mixtures (100%H2, 80%H2–20%CH4, 50%H2–50%CH4, and 100%CH4). As shown in Figs. 2(a) and 2(b), although the initial peak power density decreases with increasing CH4 percentage in fuel, the OCV of the SOFC under 80%H2–20%CH4 was stable at 1.1 V for at least 150 min, while the OCV of the SOFCs under 100%H2 or 50%H2–50%CH4 decreased from 1.1 V to less than 1 V over this time period. The OCV of the SOFC in 100%CH4 decreased from 0.4 V to 0 V within 30 min, suggesting that the film was unstable or damaged during the test. Figure 2(c) shows that the SOFC tested in 80%H2–20%CH4 also demonstrated a more stable peak power density than the SOFCs tested under other fuel environments. This relative stable SOFC performance in 80%H2–20%CH4 at 500 °C agrees well with the thermodynamic calculations for WC under these conditions.
Fuel gas composition dependent performance of WC/ScDZ/LSCF SOFCs. (a) The initial voltage (closed symbols) and power density (open symbols) versus current density, (b) OCV versus time, and (c) peak power density versus time of the SOFCs measured under various fuel environments: 100%H2 (red square), 80%H2–20%CH4 (green circle), 50%H2–50%CH4 (blue triangle), and 100%CH4 (purple inverse triangle). (d) EIS of the SOFCs with 100%H2, 80%H2–20%CH4, and 50%H2–50%CH4 as fuel. (e) The EIS of the SOFC with 100%CH4 as fuel. All measurements were made using air as the oxidant at 500 °C.

To further investigate the WC anodes under various fuel environments, initial EIS measurements under open circuit conditions were performed along with the I–V measurements, and the Nyquist plot of the resulting spectra are shown in Figs. 2(d) and 2(e). The high-frequency intercept with the real axis corresponds to the cell area-specific ohmic resistance (ASRohm), which includes the ohmic resistance of the WC anode, the ScDZ electrolyte, the LSCF cathode, the external lead wires, and the contact resistances associated with all interfaces. The area-specific polarization resistance (ASRp), corresponding to the non-ohmic electrode (anode + cathode) polarization, can be usually extrapolated from the difference between the high-frequency intercept and the low-frequency intercept with the real axis. Reference O'Hayre, Cha, Colella and Prinz30 The ASRohm of SOFCs tested with 100%H2, 80%H2–20%CH4, and 50%H2–50%CH4 were similar (4 Ω cm2), but the ASRp of SOFC increases as the CH4 content increases, indicating that the WC has a greater catalytic activity for H2 than for CH4, consistent with the peak power density comparison in Fig. 2(a). The SOFC tested with pure CH4 as fuel showed much greater ASRohm (15 Ω cm2) and ASRp, indicating that the WC anode was probably oxidized and not catalytic for CH4.
Postmeasurement characterization by XRD shows that the WC anode was completely oxidized to WO3 after the fuel cell test in pure CH4 [Supplementary Material Fig. 5(a)]. The as-prepared film showed an XRD peak at ∼37°, which is typical of WC1–x (PDF 020-1316). After fuel cell testing in pure CH4, that peak at 37° disappeared, while a new peak at 23–24° appeared, corresponding to WO3 (PDF 032-1395). The FESEM image of the thin film after testing showed nanoparticles with a grain size of ∼100 nm [Supplementary Material Fig. 5(b)]. The WC nanoparticles, as prepared, were only 10–20 nm [Supplementary Material Figs. 1(b) and 1(f)], indicating that WC and WO3 nanoparticles can be distinguished based on the surface morphology. This oxidation agrees with the thermodynamic calculation that WC is not stable in pure CH4 at the target temperature (Fig. 1), and explains the much lower fuel cell performance of the WC anode in pure CH4 (Fig. 2).
B. Microstructural optimization of WC anode for SOFCs
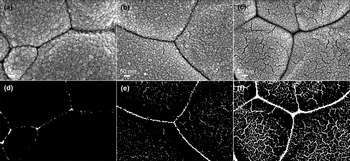
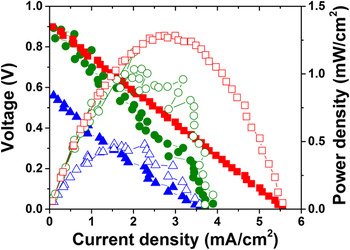
Optimization of the porosity of the WC anode is critical for achieving greater triple phase boundary (TPB) interfaces and mitigating oxidation, and is directly manifested in peak power density. The porosity of the WC anode is related to the deposition pressure during sputtering; higher Ar pressure results in increased porosity of the WC film, and vice versa (Fig. 3). FESEM images of WC anode prepared on ScDZ electrolyte under the deposition pressures of 10, 20, and 75 mTorr were analyzed using ImageJ and the corresponding porosities were estimated to be 1%, 4%, and 16%, respectively (Fig. 3). WC anodes with a porosity of 1% had higher OCVs as well as higher peak power densities than WC anodes with a porosity of 4 or 16% (Fig. 4). However, WC anodes deposited at 4 mTorr had OCV of only 0.5 V and much lower peak power densities than WC anodes sputtered at 10 mTorr (not shown). This suggests that deposition at 4 mTorr Ar pressure results in a denser film that inhibits gas diffusion to the electrolyte surface, decreasing the performance. Hence, a deposition pressure of 10 mTorr Ar corresponds to the optimal performance.
FESEM and corresponding binary converted image of WC anode prepared under various deposition pressures. 80 nm thick WC anodes deposited on ScDZ substrates in (a) and (d) 10 mTorr, (b) and (e) 20 mTorr, and (c) and (f) 75 mTorr of Ar. Note that the ratio of white area in (d), (e) and (f) corresponds to the porosity. The grain-boundary like features that span the entire SEM image (dark lines in a–c) are due to the substrate while rest of the features are from the WC film grown on top.

Anode porosity dependent performance of SOFCs. The voltage (closed symbols) and power density (open symbols) versus current density of WC/ScDZ/Pt SOFCs with 80 nm thick WC anodes with 1% porosity (red square), 4% porosity (green circle) and 16% porosity (blue triangle) measured with 80%H2–20%CH4 as fuel and standing air as oxidant at 500 °C.

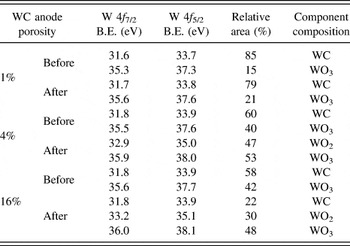
The composition of the anodes was also dependent on the porosity, and the differences in performance were reflected in the compositional changes that occurred during fuel cell testing (Table II). The composition of the anodes was estimated by de-convoluting the W 4f XP spectra collected on each sample before and after fuel cell testing (Supplementary Material Fig. 6). The oxide phase in as-prepared WC thin film was detected by XPS (surface sensitive) and does not show up in XRD, suggesting that the oxide phase is amorphous and formed on the top surface. The 1% porous anode was largely unchanged after fuel cell testing, with the WC component decreasing slightly from 85 to 79% of the total W 4f signal, while the WO3 component increased from 15 to 21%. Reference Hakansson, Johansson and Johansson31,Reference Fleisch and Mains32 The 4% porous anode, in contrast, converted from 60% WC and 40% WO3, as deposited, to 47% WO2 and 53% WO3 after fuel cell testing. Reference Gassman, Macomber and Willging33 The 16% porous anode was 58% WC and 42% WO3 as deposited and 22% WC, 48% WO3, and 30% WO2 after testing. The more porous (4 and 16% porous) anodes were oxidized during preparation due to their increased surface area, and continued to be easily oxidized during fuel cell testing, in contrast to the 1% porous anode which did not change significantly during testing. The conversion of WC to WO2 and WO3 could explain the decrease in performance of the more porous anodes over the course of the experiment, while the relative stability of the anode deposited at 10 mTorr accounts for its more stable performance. These results suggest that optimal porosity of the WC anode is achieved at a deposition pressure of 10 mTorr, resulting in thin films that are resistant to oxidation in the fuel cell environment and have maximal performance.
Composition of 80 nm thick carbide anodes before and after fuel cell testing. W 4f XPS peaks were fitted using CasaXPS and the peak areas were used to determine the relative amount of each component for each sample. Determination of the component composition was done by comparing the W 4f 7/2 binding energies measured here with known values for WC, WO2, and WO3. Reference Hakansson, Johansson and Johansson31–Reference Gassman, Macomber and Willging33

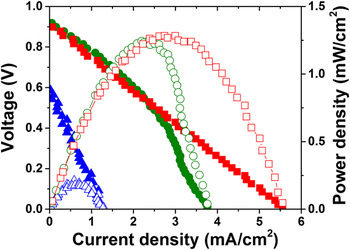
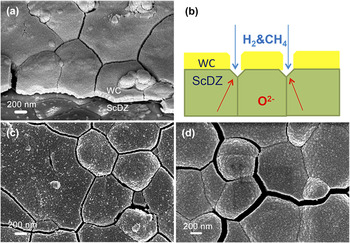
The WC anode thickness is a critical parameter to be investigated, because the anode must be thin enough to allow gas diffusion but also thick enough to ensure electrical conduction and enough active catalytic sites. The performance of SOFCs with WC anode of different thicknesses were compared (Fig. 5), where the 80 and 160 nm thick anode exhibits a higher OCV and peak power density, while the SOFC with a 320 nm thick WC anode showed the lowest OCV and peak power density, suggesting that gas diffusion was inhibited in this case. FESEM images of the 160 and 320 nm thick WC anodes show that the thinner film had more cracks, leading to increased TPB length (Fig. 6). This could explain the improved power densities seen in the 80 and 160 nm thick films compared with the 320 nm thick anode. Note that no delamination was observed during the fabrication and testing between the anode and electrolyte.
Anode thickness dependent performance of SOFCs. The voltage (closed symbols) and power density (open symbols) versus current density of WC/ScDZ/Pt SOFCs with 80 nm (red square), 160 nm (green circle), and 320 nm (blue triangle) thick WC anodes sputtered in 10 mTorr Ar measured with 80%H2–20CH4 as fuel and air as oxidant at 500 °C.

The thickness dependence of WC thin film surface morphology after fuel cell test. (a) Cross section FESEM of 160 nm WC/ScDZ/LSCF SOFC after fuel cell test; (b) schematic of the triple phase boundary; planar FESEM of WC anode with a thickness of (c) 160 nm and (d) 320 nm sputtered in 10 mTorr Ar after fuel cell test.

C. Flow reactor studies on WC anode fuel cells
A custom-built electrochemical flow reactor was used for catalysis studies on WC/ScDZ/LSCF SOFCs. The fuel cell gas output was analyzed by GC, and control tests were done showing nearly ideal oxygen flux across the electrolyte membrane as a function of applied current (Supplementary Material Fig. 4). This indicated that our setup could be used to control the oxygen anion availability during reaction.
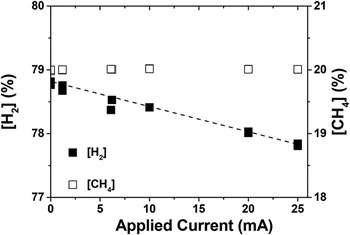
The OCV of WC/ScDZ/LSCF SOFC remained stable at 1.15 V over the entire 48 h experiment (Supplementary Material Fig. 7), and a stable peak power density of 5 mW/cm2 was obtained. Quantification of hydrogen and methane in the gas stream by GC after reaction at the anode surface allowed us to identify some of the reactions occurring at the anode. Applied current translates directly into oxygen anion flux across the electrolyte and therefore to oxygen anions available for reaction with the fuel gases at the anode surface (Supplementary Material Fig. 4). The H2 concentration shows a clear linear dependence on the current, suggesting catalytic reaction between the H2 and oxygen anions on the surface (Fig. 7). The slope of the line is −7 mL/min H2/A, or 7 mL of hydrogen consumed for every Amp of current applied per minute. An ideal flux of oxygen anions across the electrolyte, where each molecule of O2 requires the transfer of 4 e−, gives a flow rate of 3.48 mL/min of O2 per Amp. Two molecules of H2 are thus consumed for each molecule of O2 electrochemically transported, suggesting that the H2 reacts catalytically on the WC surface to form H2O. The concentration of methane was unaffected by any applied current, indicating that there was no net reaction of methane with the oxygen anions under these conditions. However, previous experiments showed that WC was unstable under H2 environments, indicating that methane was a necessary component in the fuel gas mixture (Fig. 1). This suggests that the primary role of methane in this case is stabilization of the anode and prevention of decomposition or oxidation.
Dependence of [H2] and [CH4] on applied current. The concentration of hydrogen and methane in the gas output stream as a function of applied current. There is a linear dependence of [H2] on applied current while [CH4] is independent of applied current.

D. Performance of WC anode-based SOFCs
The performance of WC and Pt anodes were compared by fabricating WC/ScDZ/LSCF and Pt/ScDZ/LSCF SOFCs, where the WC and Pt anodes were both deposited under optimal conditions.
Reference Kerman, Lai and Ramanathan2
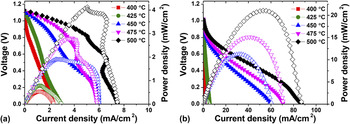
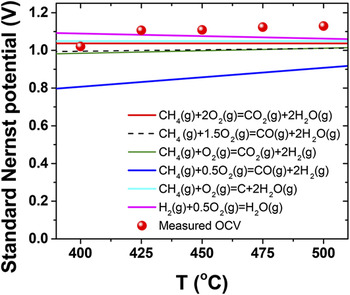
The OCVs were 1.1 and 1 V for the WC and Pt anode SOFCs, respectively [Figs. 8(a) and 8(b)]), which are similar to the Nernst potential expected for hydrogen oxidation under these conditions (standard Nernst potential calculations shown in Fig. 9). The measured OCV suggests that hydrogen oxidation, not methane oxidation, is occurring at the WC anode, in agreement with our flow reactor studies. Compared with Pt anodes, the I–V curve of WC anode shows a smaller slope at low current density and correspondingly a larger slope at high current density. The initial voltage loss at low current density represents the activation polarization, and so the smaller slope of WC anode suggests good catalytic performance of WC anode for the fuel; while the voltage loss at high current density represents the concentration polarization, and so the larger slope of WC anode suggests poor fuel gas diffusion at the anode due to the low porosity. At 500 °C, the peak power density of the WC anode SOFC (4.1 mW/cm2) is lower but within same order of magnitude as the Pt anode SOFC (21 mW/cm2) [Figs. 8(a) and (b)]. Torabi et al. reported a peak power density of 45 mW/cm2 with 20 vol% WC-infiltrated porous YSZ anode in 80%H2–20%CH4 mixed fuel at 800 °C,
Reference Torabi and Etsell21
which suggests the peak power density of 4 mW/cm2 for WC thin film anodes observed in this study is a reasonable value considering the 300 °C temperature difference between our study and that of Torabi et al. Using the Arrhenius relationship between the power density (P) and the temperature (P is proportional to
 ${{\rm{e}}^{ - {E_{\rm{a}}}/KT}}$
), the activation energy (E
a) for power density was determined to be approximately 1 eV for the WC SOFC and 1.2 eV for the Pt anode SOFC, respectively.
Performance of WC/ScDZ/LSCF and Pt/ScDZ/LSCF SOFCs. Voltage (closed symbols) and power density (open symbols) curves as a function of current density measured in 80%H2–20%CH4 between 400 and 500 °C for (a) a WC/ScDZ/LSCF SOFC and (b) a Pt/ScDZ/LSCF SOFC.

Standard Nernst potentials of fuel cell reactions as a function of temperature. Temperature dependence of the measured OCV and the standard Nernst potentials of the direct electrochemical reactions involved during WC anode SOFC operation with 80%H2–20%CH4 as fuel and standing air as oxidant between 400 and 500 °C.

IV. CONCLUSIONS
The use of a non-noble carbide system has been explored as an anode in SOFCs operating in the sub-500 °C range, combining chemical thermodynamics calculations, flow reactor measurements, and extensive microstructural studies. By optimizing the fuel species, porosity, and thickness, a stable, near-Nernstian OCV of 1.1 V was realized for WC anode based-SOFCs. In the measured temperature range, WC anode was found to be reactive with hydrogen, but not with methane. These results indicate that the use of pure WC as anode will be challenging in SOFCs due to inherent instability toward oxidation, unless the fuel composition and operating temperature are carefully tuned to maintain stability of the carbide phase.
Supplementary Material
To view supplementary material for this article, please visit http://dx.doi.org/10.1557/jmr.2016.312.
ACKNOWLEDGMENTS
Financial support from ARPA-E (DE–AR0000491) is acknowledged. We thank Neil Simrick and Zhuhua Cai for helpful discussions.