Introduction
The increased nitrate-nitrogen (nitrate-N) found in some aquifers is an important environmental problem. The extensive nature of agriculture can cause “non-point” nitrate contamination. Nitrogen (N) is considered to be one of the most difficult nutrients to manage in an agricultural system. Nitrate-N is the most mobile form of this nutrient, being both highly soluble and negatively charged. From an environmental point of view, the challenge is to develop and implement practices that prevent nitrate-N from entering subsurface and surface water flows.
Hydrologic processes control nitrate-N movement, with leaching the greater water pollution contributor, as compared to runoff (Brinsfield and Staver, Reference Brinsfield and Staver1991). Contamination of groundwater depends on vadose zone water, solute storage and unconfined aquifer presence. In other words, contamination requires the presence of excess nitrate-N and enough percolating water to carry the ion below the root zone. These conditions are often achieved when soil and environmental conditions cause N inputs from soil or manure mineralization, and fertilizer addition, to be greater than N outputs via crop removal and soil immobilization.
In agricultural soils, several factors influence nitrate-N movement. The first factor is timing. In humid or sub humid climates, conditions most frequently associated with nitrate-N leaching are observed during fall-winter-spring hydrologic recharge (Brinsfield and Staver, Reference Brinsfield and Staver1991). The second factor is soil/vadose zone amendment with manure and fertilizer N. The third factor is organic soil N mineralization. Occurring with favorable soil environmental conditions, both mineralization and manure/fertilizer amendment will affect total soil inorganic N levels. Best management practices (no-tillage, split N fertilization, and conservative N fertilization rates based on realistic yield goals) have been recommended to reduce nitrate-N pollution (Angle et al., Reference Angle, Gross, Hill and McIntosh1993). However, in their research, Brinsfield and Staver (Reference Brinsfield and Staver1991) did not observe any significant reductions in nitrate-N losses from implementation of these practices.
To decrease nitrate leaching/contamination of groundwater under agricultural soils, management practices immobilizing residual nitrate-N following maize harvest are needed. Towards that goal, planting winter cover crops provides some control of nitrate-N leaching. This practice benefits soil-crop management systems by increasing N supply to the next crop, reducing soil erosion, improving soil physical properties and conserving other nutrients. Between 1930 and 1945 the role of cover crops in N conservation was studied, and significant reductions in leached N losses were often demonstrated. Cover crops reduce nitrate-N leaching by immobilizing the nutrient and by reducing the amount of percolating water. Several investigators in the United States (Reicosky and Warnes, Reference Reicosky and Warnes1991; Brinsfield and Staver, Reference Brinsfield and Staver1991) and Europe (Martinez and Guirard, Reference Martinez and Guirard1990) have observed that several winter cover crop species reduced percolating water volume and nitrate-N concentrations. The evidence shows that well-adapted winter cover crops achieve considerable nitrate-N phytoremediation.
Winter cereal cover, planted immediately after maize harvest, may reduce nitrate-N leaching potential, but the practice is not cheap. Using a site-specific approach, delineation of areas at greater risk of causing nitrate-N pollution and then executing site-specific cover crop establishment may be possible. Costs will be associated with: a) gathering information regarding a field’s soil fertility and/or plant nutrition; b) purchase of cover crop seed, and; c) planting the seed in the appropriate place within the field. Information gathering usually consists of plant tissue and/or soil sample acquisition, analysis and interpretation. The results of soil sample analysis have been particularly important in guiding nitrate-N phytoremediation.
Soil sampling requires skilled labor, and test results are not always timely, causing further uncertainty. However, some growers, fertilizer retailers and consultants have suggested that maps resulting from spatially referenced grain yield monitoring could be the basis of fertilizer rate prescription maps and, as well, nitrate-N phytoremediation maps. The maps show the spatial distribution of grain yield within a field, and converting grain yield to N removal gives a map that could be the basis for winter cover seeding for subsequent nitrate-N phytoremediation.
The possibility of using N removal maps to create nitrate-N phytoremediation maps has a number of attractive features. To select areas needing cover cropping, yield monitor data and published grain N data are combined to make N removal/cover crop establishment prescription maps. No soil sampling, especially expensive grid soil sampling, would be required. However, data taken from a long-term N fertility experiment shows grain N concentration values change with season, cultivar and N availability (data not shown). This suggests grain N values will vary within the field and implies that in fields where spatial yield patterns are driven by other nutrient availability, N removal based phytoremediation may not be optimal. In addition, N response patterns for a field can vary with different seasons. In such cases, only soil testing would identify areas where low yield was driven by low N availability.
The objective of our study was to compare nitrate-N phytoremediation areas derived from five sources of information. The first was based on grid soil sampling. The second was a single, uniform cover crop establishment, based on a single “composite” soil sample created from the average of the grid samples in a field. The third was based on a yield map, with a single value for grain N. The fourth was based on a yield map with values for grain N measured on the same grid pattern as was done for the soil sampling. The fifth was also based on a yield map and a “composite” grain N concentration value – the average of the grid grain N values for the field.
Materials and methods
Two fields, designated A and B and located in Marion County, Kentucky, were chosen for this study. Both were planted to maize (cv. Garst 8220 and Garst 8481, respectively) in April 1999, without prior tillage. Field A was 20.8 ha in area, while B was 17.7 ha in size. The soil in both fields is largely a well-drained Typic Paleudalf. Both fields contain significant areas of fragipan soil (Typic Fragiudalf). Field B contains an area of a Typic Hapludult. Field A had a history of uniform chemical fertilizer application. Field B had a history of liquid swine manure and chemical fertilizer N applications. Maize yield was monitored with a calibrated Ag Leader 2000 system installed on an eight-row John Deere 9600 series combine equipped with a Trimble global positioning system (GPS). Raw yield monitor data were collected each second, with an average area of 6.5 m2 for each data point in these two fields. Soil (8 cores to a 10 cm depth) and grain (4 ears) samples were taken on a 54 m by 60 m grid after crop physiological maturity. Each grid sample location was recorded on a hand-held CMT GPS unit. Digital elevation was determined with a Trimble real-time kinematic GPS system on a 7 m by 7 m grid interval.
Molar potassium chloride extractable nitrate-N (Technicon Auto Analyzer), water pH, total soil nitrogen and organic carbon (dry combustion method) and soil texture (pipette method) were determined on each soil sample. Ears were dried, shelled and the grain analyzed for total N (micro-Kjeldahl digestion) by automated colorimetry.
For spatial analysis, geostatistics (interpolation kriging) was used to evaluate the grid sampled soil nitrate-N and grain N concentration data (Pebesma and Wesseling, Reference Pebesma and Wesseling1998). Soil organic matter and nitrate-N maps were then generated by kriging. The effect of point rows, a clogged yield monitor, header drop without harvest, and other spurious data points were removed from yield maps. Less than 4% of the individual raw data points were removed in this way. The spatially positioned yield values were used to calculate nutrient removal as: a) the product of the yield and the kriged interpolation for the measured grain N concentration; or b) the product of the yield and the tabular value for grain N concentration of 19 kg N/Mg grain dry matter.
To recommend cover crop establishment in a site-specific manner, areas at greater risk for nitrate-N leaching were identified. Two classes were created, depending on whether the soil’s nitrate-N content was greater than 25 kg N /ha. This cutoff was selected according to previous work by Stoddard et al. (Reference Stoddard, Grove, Coyne and Thom2005), Roth and Fox (Reference Roth and Fox1990), and Jemison and Fox (Reference Jemison and Fox1994), who found that as soil nitrate-N rose above 25 kg N/ha, the flow-weighted average leachate nitrate-N concentration rose above 10 mg N/L. To delimit these areas, the total soil nitrate-N content of the upper 90 cm of soil was estimated. This estimate is weakened by the fact that our soil sampling was confined to the surface 10 cm of soil. However, the 1999 growing season was droughty at this location. Other data examining the distribution of soil nitrate-N with depth in a similar Kentucky soil under similar soil-crop management indicated that soil nitrate-N accumulation in the surface 0–10 cm would account for about 67% of profile (0 to 90 cm) soil nitrate-N in a dry year (Stoddard et al., Reference Stoddard, Grove, Coyne and Thom2005).
Areas at “high risk” for nitrate-N leaching were also delimited using estimates of the balance between crop N uptake (output) and soil organic N mineralization plus N fertilization (input). Cover crop establishment would be recommended where N uptake was low and the balance between N input and output suggested greater potential for nitrate-N leaching. The total soil N was assumed to mineralize at a rate of 2 percent per year. As the cooperating grower applied a single rate of fertilizer N in each field (urea-ammonium nitrate solution at rates of 230 kg N/ha and 154 kg N/ha in A and B, respectively), uniformity of N fertilizer application was assumed. Values for N uptake by the crop were calculated with grain N removal plus an estimate of the N immobilized within the remaining maize residues (stover). Stover yields were assumed to be proportional to maize yields (a harvest index of 0.50; IPCC, 2006), as was the stover N concentration (14 kg N/Mg stover dry matter; IPCC, 2006). Though the N in the stover will not be removed from the field, the N contained within these crop residues will not be available for leaching in the following hydrologic season. If N uptake was less than fertilizer and mineralized soil N inputs, and the balance was higher than 25 kg N/ha, a “high” nitrate leaching risk was again assumed. The same two risk classes were defined for all five combinations of information used in approaching the recommendation for where to establish the winter cereal cover crop in these two fields. “Low risk” was defined as areas with estimated soil nitrate-N levels less than 25 kg N/ha, while the “high risk” designation was given to areas with estimated soil nitrate-N levels equal to or greater than 25 kg N/ha.
Results and Discussion
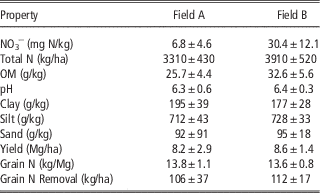
Composite soil test, grain yield and grain tissue N information for the two fields is given in Table 1. Soil nitrate-N concentrations in Field B were, on average, about 5 times greater than those observed in A. Field B averaged nearly 7 g/kg higher organic matter than did Field A. Soil water pH and soil texture were similar in these two fields. The grain yield was lower, and much more variable, in Field A than Field B. Grain N concentration was slightly higher in Field A than B. Grain N concentrations observed in both fields were well below the tabular concentration value of 19 kg N/Mg grain dry matter.
Soil test, yield, and grain composition information (mean ± one standard deviation)

Steeper slopes were generally associated with lower yield in both fields (maps not shown). In Field B the lowest elevations also exhibited lower average yield. These responses were probably due to greater surface erosion in the steeply sloped areas, expressed morphologically as a shallower surface horizon. The lower yields were also associated with soil survey map units in these fields (not shown).
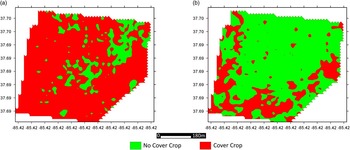
For Field B, the phytoremediation prescription maps designed using either the grid-sampled grain N concentrations (Fig. 1a) or the published tabular grain N value (Fig. 1b) to calculate N removal and the balance between N input and output delineate very different areas associated with either low or high risk of nitrate-N leaching. Using the published tabular value decreased the area considered to be at high risk for nitrate-N leaching. Because this field has been manured, the amount of N applied in chemical fertilizer form was 30% less than that for Field A. As a consequence, more than 60% of B would be designated as having a “low” risk of nitrate-N leaching using the input-output approach.
Field B phytoremediation prescription maps based upon the balance between N inputs and outputs: a) using grid-sampled grain N concentrations; b) using a published tabular grain N concentration value.

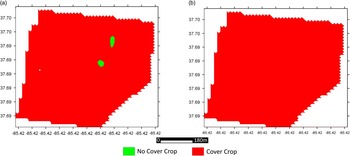
The soil nitrate-N map obtained from grid sampling Field B (Fig. 2a) indicated that although considerable variation in this parameter existed within the field, no values below 11 kg nitrate-N/ha were found. There was no evident relationship between soil series map unit and soil nitrate-N concentrations (not shown). Based on our risk classification, a little less than 95% of Field B’s area would be recommended for cover cropping. There were differences between the cover cropping prescription map derived from the N balance calculations and the one generated from soil nitrate-N measurements. Although there was not a strong relationship between these two approaches, we observed some areas of high N removal/immobilization that coincided with lower soil NO3 − concentrations (not shown). Three of the five prescription methods, grid soil nitrate-N and N balance (using grid sampled values, or a single “composite” field value, for grain N concentration) selected roughly similar, and large, areas to be cover cropped. The “composite” soil nitrate-N approach indicated that 100% of Field B should be cover cropped.
Field B phytoremediation prescription maps based upon the soil nitrate-N content: a) using grid soil sample concentrations; b) using “composite” soil nitrate-N value concentration.

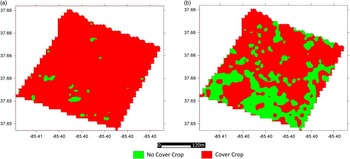
For Field A, the phytoremediation prescription maps based upon using either grid-sampled grain N concentrations (Fig. 3a) or the published tabular grain N value (Fig. 3b) to calculate N removal and the balance between N input and output again delineate different sized areas for each risk class. In this case, as in that for Field B, using the published tabular value decreased the area considered at ”high“ risk for N leaching loss, though the reduction in recommended cover crop area with use of the tabular value was less in A than in B. This latter result is due mainly to the greater rate of fertilizer N applied in Field A. Regardless of method, the N balance approach resulted in a recommendation that more than 50% of Field A’s area be cover cropped.
Field A phytoremediation prescription maps based upon the balance between N inputs and outputs: a) using grid-sampled grain N concentrations; b) using a published tabular grain N concentration value.

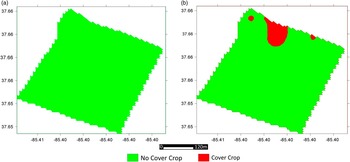
Using the “composite” soil nitrate-N value, the recommendation would call for little of Field A to be cover cropped (Fig. 4b). The map of grid sampled soil nitrate-N concentrations for Field A (Fig. 4a) also evidenced little variation. In this field, lower soil nitrate-N values were associated with the fragipan soil, and there was greater variation in soil nitrate-N within the well-drained soil. The higher values were located exclusively at the lower elevations within the well-drained soil. The grid sampled soil nitrate-N approach caused only small areas of Field A to be recommended for cover cropping.
Field A phytoremediation prescription maps based upon the soil nitrate-N content: a) using grid soil sample concentrations; b) using “composite” soil sample concentration.

There were definite differences between the N balance approach and the sampled soil nitrate-N approach as regards the spatial delineation of areas within Field A for cover cropping. There was almost no relationship between these two general prescription methods. For example, the lower parts of the field exhibited greater yield (and high N removal/uptake), but also exhibited greater soil nitrate-N concentrations (map not shown). These yielded contradictory recommendations as regards nitrate-N leaching risk and the need for cover cropping. We believe this is related to the dry weather observed in 1999, in which greater soil moisture in lower parts of the landscape favored mineralization, crop growth and nutrient uptake, but was not so excessive so as to cause nitrate-N leaching. For this field, the five prescription methods did diagnose the nitrate-N leaching potential differently. In general, N balance approaches recommended extensive cover cropping of this field, while the sampled soil nitrate-N approaches recommended the opposite.
Conclusions
In conclusion, we found that composite soil sampling across these medium-large field areas would have overlooked important differences in the nitrate-N concentrations in these fields, resulting in either under- or over-prediction of the area recommended for cover crop establishment. Uncertainty due to the shallow soil sampling protocol is acknowledged. We also found that yield map based nutrient balance calculations resulted in recommendations for greater areas of cover cropping in Field A, but somewhat lesser areas in Field B. The fact that the chosen published grain N concentration was higher than that observed in these two fields, with these two hybrids, caused reduced estimates of the field area needing cover cropping. This latter observation might vary with other hybrids, other N management schemes and other seasons, but suggests some estimate of actual grain N concentration should be attempted for each field if the yield monitor-N balance approach is to be used. The results suggest that the yield map might best be used as a field stratification tool, where areas of similar crop performance are delineated. Then, random soil sampling within those areas might be done to give more optimal nutrient management information. The results suggest that due to the complicated nature of the N cycle (related to climatic, soil and management conditions), the interpretation of soil nitrate-N tests and yield monitor based N balance approaches to prescribing spatial variation in the need for cover cropping must be based on a careful examination of the production system.