


Introduction
The behaviour of glaciers in south-east Alaska is a function of surface mass balance and glacier dynamics. The surface mass balance and annual equilibrium-line altitude (ELAa) are controlled solely by climate and can be used as climatic indicators regardless of glacier type. Surge and tide-water glaciers, during parts of their surge or advance-retreat cycle, are insensitive to climate; their behaviour is dictated by either surge or calving dynamics. Climatic changes control the surface mass balance and therefore the behaviour of other types of glaciers. There is an immediate secondary and delayed primary response of south-east Alaskan glaciers to each climatic change. The terminus response to changing ablation conditions is immediate but secondary, since in this region the percentage change in ablation for any given climatic change is less than the change in accumulation. The primary response due to changing accumulation lags by an unknown period.
The fluctuation in climatic parameters which control glacier behaviour are recorded by the glacier. Examining a large number of glaciers within a restricted region and combining the data with existing weather records permits a better climatic identification than can otherwise be obtained. This is particularly true in south-east Alaska, where there are several thousand glaciers, but only seven weather stations, all at sea-level.
Before Alaska glaciers can be used to identify climate, the annual mass balance of a large number of glaciers must be known. Because the mass balance cannot be measured directly on more than two or three glaciers, a model had to be developed that would predict accurately the mass balance of large glaciers, utilizing local weather records, satellite imagery, and field studies on the Juneau Icefield.
The model was developed for use as a substitute for detailed annual field work. The accuracy of the equations was tested against the exisiting mass-balance record of Andrei, Berendon, Lemon, and Taku Glaciers.
The model is based primarily on field work conducted by the Juneau Icefield Research Program (JIRP). JIRP has conducted annual climatic and mass-balance studies since 1946. Under the direction of Maynard M. Miller and the Foundation for Glacier and Environmental Research, annual field measurements include determination of: ELAa, budget gradient, glacier movement, glacier-surface level, heat budget, melt-water transport, meteorologie conditions, terminus fluctuations, and glacier thickness along selected transects. Methods utilized in mass-balance studies have been discussed by Reference LaChapelleLaChapelle (1954), Miller (Reference Miller1954, Reference Miller1975), Reference NielsenNielsen (1957), and Reference HubleyHubley (1957). The majority of the work has been conducted on Taku Glacier, thereby allowing annual mass-balance calculations to be completed for Taku Glacier during the 1946–85 period (Reference PeltoPelto in press).
Study-Area Climatic Conditions
A vast system of ice fields extends along the Coast Range system of south-east Alaska and adjacent Canada (Fig.1). At the Coast Range is an interaction zone between maritime and continental climatic conditions. South-eastern Alaska has the highest cyclone activity in North America due to its location east of the Aleutian low. The cyclonic frequency moderates temperatures and provides the maritime flanks of the Coast Range with 2000–4000 mm of annual precipitation. Precipitation decreases with distance from the ocean, with a sharp decline at the Coast Range crest. Table I gives the climatic conditions during the ablation season and accumulation season for three coastal weather stations of south-east Alaska. From these data, climatic conditions at specific elevations in the vicinity of each station can be estimated using data and techniques employed by Reference MarcusMarcus (1964) and Reference AdkinsAdkins (1958), and radiosonde data from each station.
South-east Alaska and north-west British Columbia; glacier-covered areas indicated by stippling, ice field is abbreviated IF, and selected glaciers are numbered, see Table III for numbering scheme.

Climatic Conditions Observed for three Coastal Alaskan weather Stations and Extrapolated for Different Elevation in their Respective Areas

During the accumulation season the weather in south-east Alaska and north-west British Columbia is dictated by the relative strengths of the maritime Aleutian low and the continental Canadian polar high (Reference MillerMiller 1975). The boundary separating continental and maritime climatic conditions generally intersects each ice field. The mean boundary position is 3–25 km inland of the Coast Range divide. The ELAa is dramatically higher under continental climatic conditions. Hence, even slight shifts in the mean boundary position can be identified by observing changes in ELAa on glaciers of each ice field. The primary storm track and prevailing wind direction are from the south-south-east to east.
During the ablation season the Aleutian low is no longer present. The cyclonic activity decreases and the prevailing wind is from the south-south-east to east-south-east.
Mass-Balance Controls
The surface mass balance of glaciers in south-east Alaska is controlled by three climatic parameters: accumulation-season cyclonic activity, ablation-season temperature, and summer cyclonic activity. Precipitation and winter balance increase as accumulation-season cyclonic activity increases. Cyclonic conditions are associated with mild temperatures in south-eastern Alaska, indicating a direct relationship between accumulation-season temperature and winter balance. This is also the case in southern Alaska (Reference MayoMayo 1984).
Ablation-season temperature dictates ablation below the snow line. Above the snow line, summer cyclonic activity is as important as temperature, since ablation is highest during storm conditions, high winds, and precipitation in the form of rain (Reference HubleyHubley 1957). Ablation increases as summer cyclonic activity and ablation-season temperature increase.
In the case of the maritime glaciers of south-east Alaska, 65–70% of the annual mass-balance variance is accounted for solely by the accumulation cyclonic activity (Reference PeltoPelto in press). Ablation-season temperature and cyclonic activity explain 25–30% of the variance. Glaciers on the continental side of the ice fields have estimated variances of 55–60% for accumulation-season cyclonic activity and 30–40% for ablation-season conditions. Therefore, the primary control of annual mass-balance fluctuations is the changing intensity and duration of maritime conditions for each glacier.
On a geodynamic basis, the mass balance of south-east Alaskan glaciers is dictated by the calving rate, the percentage of a glacier’s area in the zone of maximum accumulation (MAA), and the accumulation-area ratio (AAR: percentage of a glacier’s area above the ELA). The maximum accumulation area in south-east Alaska and north-west British Columbia is the region where mean accumulation-season temperature is estimated from meteorologic and winter-balance measurements to be in the range of -5° to -13°C, Changes in the regimen on non-surging glaciers occur only when AAR and MAA percentages cross the equilibrium threshold values (Reference MercerMercer 1961). As determined in this study, the respective threshold values for AAR and MAA are: 67 and 50 for a non-calving or low-calving-rate glacier, 76 and 55 for a moderate-calving-rate glacier, and 84 and 62 for a high-calving-rate glacier. The mean calving rate for a low-calving-rate glacier is less than 200 m/a, 200–1100 m/a for a moderate-calving-rate glacier, and greater than 1100 m/a for a high-calving-rate glacier.
Of 120 glaciers in south-east Alaska and north-west British Columbia examined with these criteria, only three do not fall within the above guidelines, proving the usefulness of this method for mass-balance estimation. Changes in terminus configuration or fjord geometry alter the calving rate and cause pronounced shifts in the threshold AAR and MAA values for the glacier.
Mass-Balance Calculation Method
The mass balance of a glacier is the sum of the surface and calving flux. The surface flux is dependent on the budget gradient, ELAa, and glacier surface at each elevation. The variation of the mean budget gradient on large south-east Alaskan glaciers is small and each is a reasonably uniform curve (Reference MayoMayo 1984). The mean budget gradient varies predictably from one glacier to another according to: ocean proximity, surface slope, and valley width-valley height ratio (Fig.2). Ocean proximity is measured along the path of primary winter and summer storm movement. Each of the parameters fluctuates from the terminus to divide and one tributary to another on each glacier. The effect of each parameter was determined from comparison of the budget gradients for Andrei, Berendon, Columbia, Kaskawuish, Lemon, Malaspina, Salmon, Taku, and Wolverine Glaciers (Reference AdkinsAdkins 1958; Reference Meier and PostMeier and Post 1962; Reference Marcus and RagleMarcus and Ragle 1970; Reference MayoMayo 1984; Reference YoungYoung unpublished). This method was then tested on Herbert, Llewellyn, Sawyer, Twin, and Vaughan Lewis Glaciers, proving accurate to within ±0.15 mm/m for any elevation.
Factors dictating the budget gradient of south-east Alaskan glaciers. Proximity to ocean, surface slope, and valley width-valley height ratio. Also shown are the maximum and minimum boundary conditions for the annual budget gradient of Taku Glacier.

The mean budget gradient is then known for each glacier; however, annual fluctuations are significant. Annual budget-gradient variations are due almost entirely to the changing intensity and duration of maritime conditions for each glacier. Corrections are based on annual observation of each glacier’s activity index and the ELAa gradient from the maritime to the continental side of each ice field, and utilization of local weather records to determine accumulation-season cyclonic activity, ablation-season temperature, and summer cyclonic activity. The activity index is the budget gradient in the vicinity of the ELA (Reference Meier and PostMeier and Post 1962), and can be measured by observing the snow-line rise with time. The snow line and ELAa are nearly coincident at the end of the ablation season in this region. The ELAa gradient is the rise in elevation of the ELAa with distance inland from the maritime to the continental side of the ice field. This distance is measured along the primary winter storm-path direction. As the activity index and ELAa gradient increase, so does mass balance (Fig.3). This method proved accurate in replicating the annual budget gradient of Taku Glacier without using any field data for the 1977–84 period (Fig.4). The values of activity-index and ELAa-gradient values, and their effect on mass balance, vary slightly from one ice field to another.
The effect of varying activity index (AI), and equilibrium-line gradient from the continental to the maritime side of the Juneau Icefield, on the mass balance of Taku Glacier.

The predicted budget gradient (bn*) and measured budget gradient (bn) for Taku Glacier in 1967.

The surface area within each 160 m elevation was determined from U.S.G.S. topographic maps using a polar planimeter. The annual surface mass balance could then be determined using Equation (1):
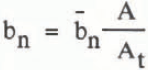
where At is the total surface area, A is the surface area within each 160 m elevation band, and bn is the mean balance within each 160 m elevation band. The net annual mass balance (bn), in meters of water equivalent, is the sum of the mass balance for each elevation band.
An equilibrium line-based equation similar to that of Reference BraithwaiteBraithwaite (1984) yields extremely similar results. It is actually more useful because it does not require a complete budget gradient. However, a more complete budget gradient does yield more accurate results

In Equation (2) G is the budget gradient, 1 is the ablation zone, 2 is the lower névé, 3 the upper neve, and ELAa the zero-budget equilibrium-line altitude. The ELAo is determined from the AAR and MAA mass-balance relationship for each glacier and checked by mass-balance calculation from the mean budget gradient and glacier surface area-elevation distribution.
The only variables are ELAa, determined from satellite imagery and keyed to topographic maps, and G determination, which has been described. The major error in this method is obtaining a satellite image at the end of the ablation season to determine the ELAa. There has been a usable image for the Juneau Icefield for nine of the last 11 years.
The above methods and Equation (2) were used to calculate the mass balance of Taku Glacier using a split-sample technique, in which no field data were utilized in model development or mass-balance calculations from odd-numbered years (Table II). Errors for one standard deviation on Taku Glacier are ±0.14 m annually and ±0.08 m for a 10-year period. The expected errors for other glaciers, where the equation proved applicable, are ±0.18−0.24 m annually and ±0.10−0.16 m for a 10-year period. Table III lists the ELA, AAR, MAA, 1976–84 mass balance and 1984 mass balance for 14 selected glaciers. Similar calculations were carried out for all 60 glaciers and the mean values are shown in Table III.
The Annual Equilibrium-Line Altitude (ELAa), Annual Mass Balance (bn: In mm of Water Equivalent), Number of data Points, and Predicted Mass Balance (bn*). 1985 Data are Preliminary and were not used for Calculation of Mean Values

The Equilibrium-Line Altitude, Accumulation-Area Ratio, Maximum Accumulation-Area Ratio, and Mass Balance of Selected South-East Alaskan and North-West British Columbia Glaciers; See Fig.1 for Map Location. The mean Values are those for all 60 Glaciers of this Study

The mass-balance prediction method was not satisfactory for glaciers which have an area less than 20 km2. It did prove accurate for Iskut, Juneau, Stikine, and Unuk Icefields, Brady Glacier, and the eastern part of Glacier Bay (Fig.1). These are all nunatak ice fields, with an interconnected plateau névé zone, drained by outlet glaciers. Accumulation via wind drifting and avalanching is insignificant on nunatak ice fields. There are no data to check this method in the case of valley ice fields, which consist of individual valley-glacier systems separated by high mountain ridges. It is unlikely that this method would be accurate for valley ice fields, such as Fairweather and St. Elias Icefields of south-east Alaska, where avalanching and wind drifting are significant sources of accumulation.
The calving flux is the product of calving velocity, ice thickness, and glacier width. There is no suitable method for determining the calving flux, although Reference Brown, Meier and PostBrown and others (1982) demonstrated that water depth at the glacier front is the primary variable. In the current study only changes in the calving flux were estimated. These estimates were based on annual aerial photographs and satellite images. The most useful check of the calving flux is to calculate volume flux at a point near the terminus where glacier depth, width, and ice velocity are known. These data are obtainable for most south-east Alaskan tide-water glaciers. If a glacier is not retreating rapidly or being down-drawn, then the calving flux cannot exceed the winter balance or the calculated volume flux by a significant amount. Use of only summer glacier velocities leads to an overestimate of the calving flux, as was the case in the Reference Brown, Meier and PostBrown and others (1982) study.
Climatic Trends
The mass-balance record during the 1946–85 period for Iskut, Juneau, Stikine, and Unuk Icefields can be divided into four climatic intervals. The climate and mass-balance trends for this period are shown in Fig.5. During the 1946–62 period, ablation-season conditions were relatively constant. The single variable determining mass balance was accumulation-season cyclonic activity fluctuations. Winter temperature and cyclonic activity decreased from 1945 to 1953, causing moderately negative mass balances. Winter temperature and cyclonic activity then increased from 1954 to 1962, producing declining negative balances. From 1963 to 1975, low ablation-season temperatures and above-average winter precipitation caused slightly positive glacier balances. Lower winter temperature was due to a global temperature decline and not to decreasing cyclonic activity, hence winter precipitation did not decline. A rapid increase in annual temperature delineates the 1976–83 interval. Record ablation-season warmth offset slightly above-average winter precipitation, causing moderately negative mass balances. From 1984 through 1986, record accumulation-season warmth and precipitation, in addition to average ablation-season temperatures, has resulted in large positive mass balances. This climatic interval is especially noteworthy because of an eastward shift in the wind drift moats that had been stationary since 1946 on the Juneau Icefield.
5 year running means of accumulation-season temperature (Tw), ablation-season temperature (Ts), and mass balance of south-east Alaska and north-west British Columbia glaciers, in mm of water equivalent. From 1946 to 1971 the mass-balance record is based on 16 glaciers for which ELAa data were available. Between 1972 and 1985, the mass-balance curve is based on all 60 glaciers of this study.

Conclusions
it is evident that the surface mass balance of many glaciers in south-east Alaska can be identified using satellite imagery, local weather records, and Juneau Icefield glaciologic data. Modification of the budget-gradient estimation methods is necessary to obtain mass-balance records for glaciers of the Alaska, Chugach, Fairweather, St. Elias, and Wrangell Mountains. To predict the future behaviour of glaciers in south-east Alaska and north-west British Columbia requires an understanding of the dynamics which determine the lag time and magnitude of terminus response.
During the 1900–62 period no more than 12 of the 60 glaciers were near to equilibrium conditions. At present, 29 of the 60 glaciers are near equilibrium. The positive mass-balance pulse of the 1963–75 period has not reached the termini of most of the glaciers. This, in conjunction with the recent warm winter temperatures, causing record winter balances, could lead to a stabilization of the ice volume of glaciers in south-east Alaska for the remainder of this century.
Reference BraithwaiteBraithwaite (1984) posed the question, “can the mass balance of a glacier be estimated from its equilibrium-line altitude?” The answer in south-east Alaska and north-west British Columbia is “no”. If rephrased, can the mass balance of a glacier be estimated from its snow line and ELA at different times during the ablation season and from regional variations of the ELAa? The answer for south-east Alaska and north-west British Columbia is “yes”.



