1. Introduction
In insurance applications, modelling of multivariate data is crucial, for instance, for pricing of dependent risks, risk management of different portfolios or reinsurance modelling of joint risks. The choice of tractable multivariate distributions for such modelling purposes is large. In this contribution, we are concerned with the joint distribution of the largest claims observed in two insurance portfolios. In this respect, we denote by X i and Y i the ith claim observed in each portfolio, respectively. We consider the classical collective model over a fixed period of time. Hence, we define N as the claim counting random variable. Clearly, when N=0, no claims are reported and the largest claim observed in each portfolio is null. However, we are mainly interested in the case where N≥1. Therefore, we define Λ=N|N≥1. For a given bivariate distribution function G, a new class of bivariate distributions, denoted F, can be introduced in the context of the distribution of largest claims observed in a bivariate portfolio as illustrated in Hashorva et al Reference Hashorva, Ratovomirija and Tamraz. (2017). An instance that motivates F in practice is if X i ’s model the claim sizes of an insurance portfolio and Y i ’s the allocated loss adjustment expense related to the settlement of X i ’s, such as legal fees, investigations of claims, etc. The dependency observed between the largest claims of X i and Y i is relevant when pricing an excess-of-loss reinsurance treaty in the case where the insurer and reinsurer share the settlement costs, see Cebrian et al. (Reference Cebrian, Denuit and Lambert2003) for more details.
More specifically, if Λ is a discrete random variable with
 ${\Bbb P}\left\{ {{\rm \Lambda }{\equals}i} \right\}{\equals}p(i)\geq 0,\,i\in{\Bbb N}$
, then F can be defined by its Laplace transform, see Joe (Reference Joe1997, Chapter 4.2):
 $$F\left( {x,\,y} \right)\, {\equals}\, L_{{\rm \Lambda }} \left( {{\minus}{\rm ln}\,G\left( {x,\,y} \right)} \right),\quad x,\,y\geq 0$$
with L Λ the Laplace transform of Λ. Moreover, if G has continuous marginal df’s G 1, G 2, we have that F has marginal df’s:
 $$F_{i} \left( {x_{i} } \right)\, {\equals}\, L_{{\rm \Lambda }} \left( {{\minus}{\rm ln}\,G_{i} \left( {x_{i} } \right)} \right),\quad i\, {\equals}\, 1,\,2$$
and unique copula:
 $$C\left( {u_{1} ,\,u_{2} } \right)\, {\equals}\, L_{{\rm \Lambda }} \left( {{\minus}{\rm ln}Q\left( {\upsilon _{1} ,\,\upsilon _{2} } \right)} \right),\quad u_{1} ,\,u_{2} \in\left[ {0,\,1} \right]$$
where we set
 $\upsilon _{i} \, {\equals}\, e^{{{\minus}L_{{\rm \Lambda }}^{{{\minus}1}} \left( {u_{i} } \right)}} $
and Q the unique copula of G.
Note that by differentiating (2) we get the corresponding copula density c of C as follows:
 $$c\left( {u_{1} ,\,u_{2} } \right)\, {\equals}\, {{{{\partial \upsilon _{1} } \over {\partial u_{1} }}{{\partial \upsilon _{2} } \over {\partial u_{2} }}} \over {Q^{2} \left( {\upsilon _{1} ,\,\upsilon _{2} } \right)}}\left( {(L_{{\rm \Lambda }}^{\prime} (t){\plus}L_{{\rm \Lambda }}^{\prime\prime} (t)){{\partial Q(\upsilon _{1} ,\,\upsilon _{2} )} \over {\partial \upsilon _{1} }}\,{{\partial Q(\upsilon _{1} ,\,\upsilon _{2} )} \over {\partial \upsilon _{2} }}{\minus}L_{{\rm \Lambda }}^{\prime} (t)Q(\upsilon _{1} ,\,\upsilon _{2} )q(\upsilon _{1} ,\,\upsilon _{2} )} \right)$$
where
 $L_{{\rm \Lambda }}^{\prime} (s)\, {\equals}\, {\minus}{\Bbb E}\left\{ {{\rm \Lambda }e^{{{\minus}s{\rm \Lambda }}} } \right\},\,L_{{\rm \Lambda }}^{\prime\prime} (s)\, {\equals}\, {\Bbb E}\left\{ {{\rm \Lambda }^{2} e^{{{\minus}s{\rm \Lambda }}} } \right\}$
and q the pdf of Q given by
 $$q\left( {u_{1} ,\,u_{2} } \right)\, {\equals}\, {{g\left( {G_{1}^{{{\minus}1}} \left( {u_{1} } \right),\,G_{2}^{{{\minus}1}} \left( {u_{2} } \right)} \right)} \over {g_{1} \left( {G_{1}^{{{\minus}1}} \left( {u_{1} } \right)} \right)g_{2} \left( {G_{2}^{{{\minus}1}} \left( {u_{2} } \right)} \right)}},\,u_{1} ,\,u_{2} \in\left[ {0,\,1} \right]$$
Here g is the pdf of G and g 1, g 2 its marginal pdf’s.
In the aforementioned paper, three special cases for Λ were considered by transforming a discrete random variable N, namely Shifted Geometric, Shifted Poisson or Truncated Poisson. For these choices of Λ, the density function c has a very tractable form and therefore can be easily used for parametric estimation purposes.
As seen from (3), it is crucial that we have a tractable formula for the Laplace transform L Λ or that of the random variable N.
Instead of the Poisson choice for N we can take, for instance
 $$N\mathop{\, {\equals}\, }\limits^{d} {\rm Poisson}\left( {\lambda W} \right)$$
where λ>0 is a fixed parameter and W a modifier, i.e., a non-negative random variable. Here
 $\mathop{\, {\equals}\, }\limits^{d} $
means equality in distribution. Clearly, this idea carries over to other parametric models for Λ.
Another interesting choice of N is motivated by the Poisson case. Clearly, we can write a Poisson random variable as a compound Poisson random variable. Thus, with motivation from the collective model, we consider N to be a compound random variable as follows:
 $$N\, {\equals}\, \mathop{\sum}\limits_{i\, {\equals}\, 1}^Y {Z_{i} } {\rm \ztbnd },\quad N\, {\equals}\, 0\,{\rm if}\,Y\, {\equals}\, 0$$
where Y is a counting random variable independent of Z i ’s which are discrete random variables with values in 0,1 ….
Both constructions above are interesting and lead to new classes of mixture copulas. The drawback is that in many cases, no explicit form of the Laplace transform is available, which renders the parametric estimation difficult.
In this paper, we shall focus on a tractable choice for Z i ’s, namely these are independent copies of a Sibuya random variable Z with probability generating function (pgf):
 $$P_{Z} \left( z \right)\, {\equals}\, 1{\minus}\left( {1{\minus}z} \right)^{\alpha } $$
with α∈(0, 1] a fixed parameter. For such Z and Y a Poisson random variable with parameter λ>0, then N given by (5) has a discrete-stable distribution with parameters λ>0 and α∈(0, 1]. Discrete-stable distributions have been discussed in Steutel & Van Harn (Reference Steutel and Van Harn1979). These so-called discrete distributions satisfy many interesting properties. Specifically, in view of Steutel & Van Harn (Reference Steutel and Van Harn1979) the pgf P of a discrete-stable distribution N with parameters (α, λ) is of the form:
 $$P_{N} \left( z \right)\, {\equals}\, e^{{{\minus}\lambda (1{\minus}z)^{\alpha } }} $$
where λ>0, α∈(0, 1] and |z|≤1. By setting z=e −t in (6), we can define the distribution of N via its Laplace transform:
 $$L_{N} \left( t \right)\, {\equals}\, {\Bbb E}\left\{ {e^{{{\minus}tN}} } \right\}\, {\equals}\, e^{{{\minus}\lambda [1{\minus}e^{{{\minus}t}} ]^{\alpha } }} , \quad t\geq 0,\,\lambda \,\gt\,0,\,\alpha \in(0,\,1]$$
We have the following explicit formulas:
 $${\Bbb P}\left\{ {N\, {\equals}\, 0} \right\}\, {\equals}\, e^{{{\minus}\lambda }} $$
 $${\Bbb P}\left\{ {N\, {\equals}\, 1} \right\}\, {\equals}\, \alpha \lambda e^{{{\minus}\lambda }} $$
 $${\Bbb P}\left\{ {N\, {\equals}\, 2} \right\}\, {\equals}\, {{\alpha \lambda } \over 2}e^{{{\minus}\lambda }} \left( {1{\minus}\alpha {\plus}\alpha \lambda } \right)$$
Clearly, we obtain the Poisson distribution for α=1 in (7).
The case α<1 is substantially different from the Poisson case of α=1. Indeed, if α<1, then
 ${\Bbb E}(N)\, {\equals}\, \infty$
and for such α the discrete-stable distribution is heavy-tailed.
Hereafter, we shall discuss two different models for Λ based on N as above, namely:
Model A (Shifted discrete-stable): Setting Λ=N+1, we have that
 $$L_{\Lambda } \left( t \right)\, {\equals}\, {\Bbb E}\big\{ {e^{{{\minus}t(1{\plus}N)}} } \big\}\, {\equals}\, e^{{{\minus}t}} e^{{{\minus}\lambda [1{\minus}e^{{{\minus}t}} ]^{\alpha } }} , \quad t\geq 0$$
hence
 $$F\left( {x,\,y} \right)\, {\equals}\, G\left( {x,\,y} \right)e^{{{\minus}\lambda [1{\minus}G(x,\,y)]^{\alpha } }} , \quad x,\,y\geq 0$$
Model B (Truncated discrete-stable): We define Λ=N|N≥1. Hence p(i)=p(i)/(1−p(0)), i≥1. This implies that
 $$\eqalignno{ {\Bbb E}\left\{ {e^{{{\minus}t\Lambda }} } \right\} & \, {\equals}\, \mathop{\sum}\limits_{i\, {\equals}\, 1}^\infty {{{p\left( i \right)} \over {1{\minus}p\left( 0 \right)}}e^{{{\minus}ti}} {\plus}{{p\left( 0 \right)} \over {1{\minus}p\left( 0 \right)}}{\minus}{{p\left( 0 \right)} \over {1{\minus}p\left( 0 \right)}}} \cr & \, {\equals}\, {{e^{{{\minus}\lambda \left( {1{\minus}e^{{{\minus}t}} } \right)^{\alpha } }} {\minus}e^{{{\minus}\lambda }} } \over {1{\minus}e^{{{\minus}\lambda }} }} $$
leading to (set
 $b_{\lambda } \,\colon\,\, {\equals}\, {{e^{{{\minus}\lambda }} } \over {1{\minus}e^{{{\minus}\lambda }} }}$
)
 $$F\left( {x,\,y} \right)\, {\equals}\, {1 \over {1{\minus}e^{{{\minus}\lambda }} }}\left[ {e^{{{\minus}\lambda [1{\minus}G(x,\,y)]^{\alpha } }} {\minus}e^{{{\minus}\lambda }} } \right]\, {\equals}\, b_{\lambda } \left[ {e^{{\lambda (1{\minus}[1{\minus}G(x,\,y)]^{\alpha } )}} {\minus}1} \right], \quad t\geq 0$$
All the models introduced above lead to distribution functions F which depend on two additional parameters α and λ. The dependence introduced by the choice of G and (α, λ) is interesting. Even if we have the product case
 $$G\left( {x,\,y} \right)\, {\equals}\, G_{1} \left( x \right)G_{2} \left( y \right), \quad x,\,y\in{\Bbb R}$$
the distribution function F is not a product distribution.
In this paper, we are interested in the main properties of F for Λ specified as above and the possible applications of such F for modelling-dependent insurance data. This paper is structured as follows. In section 2, we study some dependence properties of F by means of Monte Carlo simulations for Model A. Section 3 discusses various methods for estimating the parameters of the new constructed copula as well as goodness of fit. Finally, section 4 is dedicated to applications of this copula to concrete insurance data sets.
2 Dependence Properties of F
2.1 Dependence measures
We investigate the dependence properties of F and its corresponding copula C for a given joint distribution function G with copula Q and Λ as in Model A. The dependence between the largest claim amounts observed in two insurance portfolios, i.e. (X Λ:Λ, Y Λ:Λ), is evaluated with respect to the parameter α of the shifted discrete-stable distribution. In this respect, we define below the most commonly used non-parametric methods. They measure different aspects of the dependence structure governed by C, see Fredricks & Nelsen (Reference Fredricks and Nelsen2007).
For a given copula C, Kendall’s τ is defined as
 $$\tau \left( C \right)\, {\equals}\, 4\mathop{\int}\limits_0^1 {\mathop{\int}\limits_0^1 {C(u,\,\upsilon )dC(u,\upsilon ){\minus}1} } $$
whereas Spearman’s rank correlation coefficient ρ S is given by
 $$\rho _{S} \left( C \right)\, {\equals}\, 12\mathop{\int}\limits_0^1 {\mathop{\int}\limits_0^1 {C\left( {u,\,\upsilon } \right)dud\upsilon {\minus}3} } \, {\equals}\, 12\mathop{\int}\limits_0^1 {\mathop{\int}\limits_0^1 {u\upsilon dC(u,\,\upsilon ){\minus}3} } $$
Remarks 2.1 We show in the next section by simulation that for a given copula Q with parameter θ, the level of dependence governed by C decreases as the parameter α of the shifted discrete-stable distribution increases.
2.2 Monte Carlo simulation
We study the dependence property of C by means of Monte Carlo simulations. In order to do so, we consider two types of copula for Q, namely the Gumbel and the Clayton copula both with parameter θ=10 and Λ as defined in Model A with λ=10. We compare the level of dependence governed by copula C with respect to the parameter α of the discrete-stable distribution. The simulation procedure follows Step 1 to Step 4 described below and is repeated 10,000 times.
Step 1: Generate a random value n from the discrete-stable distribution Λ.
Step 2: Generate n random vectors (U 11, U 21), … , (U 1n , U 2n ) from copula Q.
Step 3: Calculate Z 1= max(U 11, … , U 1n ) and Z 2= max(U 21, … , U 2n ).
Step 4: Return the vector (V 1, V 2) with
 $$V_{1} \, {\equals}\, Z_{1} e^{{{\minus}\lambda (1{\minus}Z_{1} )^{\alpha } }} , \quad V_{2} \, {\equals}\, Z_{2} e^{{{\minus}\lambda (1{\minus}Z_{2} )^{\alpha } }} $$
In view of Step 1, simulating a random number from the discrete-stable distribution is not straightforward as it does not have a closed form for its probability mass function. Therefore, Devroye (Reference Devroye1993) developed the following result.
Lemma 2.2 If a random variable X follows a discrete-stable distribution with parameters (α, λ), then X follows a Poisson distribution with parameter λ 1/α S α,1 , where S α,1 a positive stable random variate with parameter α.
Several methods were discussed in the literature for the choice of S α,1. In the sequel, we refer to the method described in Kanter (Reference Kanter1975) where the expression of S α,1 is given by
 $$S_{{\alpha ,1}} \, {\equals}\, \left( {{{{\rm sin}\left( {(1{\minus}\alpha )\pi U} \right)} \over {E\,{\rm sin}\left( {\alpha \pi U} \right)}}} \right)^{{{{(1{\minus}\alpha )} \over \alpha }}} \left( {{{{\rm sin}\left( {\alpha \pi U} \right)} \over {{\rm sin}\left( {\pi U} \right)}}} \right)^{{{1 \over \alpha }}} $$
with α∈(0, 1) and U~Uniform (0, 1) being independent of the unit exponential random variable E~Exp(1).
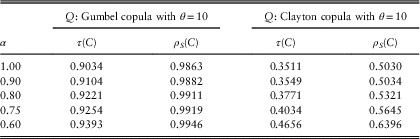
In Table 1, we compute the empirical dependence measures relative to copula C.
Empirical Kendall’s τ and Spearman’s ρ with respect to α.

Table 1 shows that as the parameter α of the discrete-stable distribution decreases, the level of dependence governed by copula C increases. Note that α=1, i.e., the Shifted Poisson case, yields the lowest level of dependence between the maximal claim amounts observed in the two portfolios.
3 Parameter Estimation and Goodness of Fit
3.1 Parameter estimation
In this section, we discuss different methods to estimate the parameters of the new copula C, principally the parameter θ of the original copula Q and the parameters (α, λ) of the discrete-stable distribution Λ. In the sequel, for the sake of simplicity, we denote by Θ=(θ, α, λ) the parameters of the new copula. The different methods for estimating the parameters of a copula is widely discussed in the literature. We count two parametric methods and one semi-parametric. The choice of one of these methods depends on the willingness of the user to make assumptions or not about the unknown margins.
Typically, when marginal distributions are known, parametric methods are more frequently employed. The most popular method discussed in the literature is the maximum likelihood estimation (MLE). It is a fully parametric method well known for its optimality properties. The parameters of the copula and of the marginal distributions are estimated simultaneously by maximising the log-likelihood function. However, this method is computationally intensive especially when estimating multiple parameters. An alternative method that requires less computations is the Inference Functions for Margins (IFM) proposed by Joe (Reference Joe1997). It is a two-step estimation method. In the first step, the parameters of the marginal distributions are estimated separately by maximising the corresponding log-likelihood functions. Next, by replacing the marginal parameters by their first stage estimators, the maximisation of the log-likelihood solves for Θ in the second step. However, both methods rely on the choice of the marginals. Kim et al. (Reference Kim, Silvapulle and Silvapulle2007) show that a misspecification of the marginals may lead to discrepancies in the performance of the estimators.
In practice, the marginal distributions are unknown and are thus estimated non-parametrically. Genest et al. (Reference Genest, Ghoudi and Rivest1995) described a new method for estimating the dependence parameter Θ of the copula C which is a semi-parametric one known as the Pseudo-maximum likelihood (PML) method. It is solely based on the ranks of the observations. In the first stage, the marginals are replaced by their empirical counterparts in the pseudo-log-likelihood function. Then, in the second stage, the maximisation of the latter returns the estimators of Θ of the new copula C. In the sequel, we shall utilise the PML method.
Let X~G
1 and Y~G
2 where G
1 and G
2 are the marginals of X and Y, respectively. In light of the PML method, G
1 and G
2 are estimated by their empirical counterparts denoted hereafter by
 $\widetilde{{G_{1} }}$
and
 $\widetilde{{G_{2} }}$
and defined as follows:
 $$\widetilde{{G_{1} }}\left( x \right)\, {\equals}\, {1 \over n}\mathop{\sum}\limits_{i\, {\equals}\, 1}^n {1\left\{ {X_{i} \leq x} \right\}} ,\quad \widetilde{{G_{2} }}\left( y \right)\, {\equals}\, {1 \over n}\mathop{\sum}\limits_{i\, {\equals}\, 1}^n {1\left\{ {Y_{i} \leq y} \right\}} $$
The method consists in finding Θ that maximises the pseudo-log-likelihood function given by:
 $$l\left( \Theta \right)\, {\equals}\, \mathop \sum\limits_{i\, {\equals}\, 1}^n {\rm log}c_{\Theta } \left( {U_{i} ,\,V_{i} } \right)$$
where c
Θ is the copula density defined in (3),
 $U_{i} \, {\equals}\, {n \over {n{\plus}1}}\widetilde{{G_{1} }}(x_{i} )$
and
 $V_{i} \, {\equals}\, {n \over {n{\plus}1}}\widetilde{{G_{2} }}(y_{i} )$
are the pseudo-observations. The rescaling factor
 ${n \over {n{\plus}1}}$
is introduced to avoid numerical difficulties arising at the boundaries [0, 1]2 (see Genest et al., Reference Genest, Ghoudi and Rivest1995). Kim et al. (Reference Kim, Silvapulle and Silvapulle2007) show that the PML methods performs better than the IFM and MLE methods. Moreover, Genest et al. (Reference Genest, Ghoudi and Rivest1995) and Shih & Louis (Reference Shih and Louis1995) (in the presence of censorship) show that under suitable conditions, the resulting estimator of Θ is consistent and asymptotically normally distributed.
Below, we give the expression of the copula density for both Model A and Model B along with the corresponding pseudo-log-likelihood functions.
∙ Model A: Λ follows a shifted discrete-stable distribution.
The pdf of the shifted discrete-stable copula is given by
 $$c_{\Theta } \left( {u_{1} ,\,u_{2} } \right)\, {\equals}\, W\left( {\upsilon _{1} ,\,\upsilon _{2} } \right){{e^{{\lambda \left[ {(1{\minus}\upsilon _{1} )^{\alpha } {\plus}(1{\minus}\upsilon _{2} )^{\alpha } {\minus}(1{\minus}Q(\upsilon _{1} ,\,\upsilon _{2} ))^{\alpha } } \right]}} } \over {\left( {1{\plus}\lambda \alpha \upsilon _{1} \left( {1{\minus}\upsilon _{1} } \right)^{{\alpha {\minus}1}} } \right)\left( {1{\plus}\lambda \alpha \upsilon _{2} \left( {1{\minus}\upsilon _{2} } \right)^{{\alpha {\minus}1}} } \right)}}$$
where
 $$\eqalignno{ W\left( {\upsilon _{1} ,\,\upsilon _{2} } \right) & \, {\equals}\, \lambda \alpha \left( {1{\minus}Q(\upsilon _{1} ,\,\upsilon _{2} )} \right)^{{\alpha {\minus}2}} \left[ {2{\minus}(\alpha {\plus}1)Q(\upsilon _{1} ,\,\upsilon _{2} ){\plus}\lambda \alpha Q(\upsilon _{1} ,\,\upsilon _{2} )(1{\minus}Q(\upsilon _{1} ,\,\upsilon _{2} ))^{\alpha } } \right]{{\partial Q\left( {\upsilon _{1} ,\,\upsilon _{2} } \right)} \over {\partial \upsilon _{1} }}{{\partial Q\left( {\upsilon _{1} ,\,\upsilon _{2} } \right)} \over {\partial \upsilon _{2} }} \cr & {\plus}\left[ {1{\plus}\lambda \alpha Q\left( {\upsilon _{1} ,\,\upsilon _{2} } \right)\left( {1{\minus}Q(\upsilon _{1} ,\,\upsilon _{2} )} \right)^{{\alpha {\minus}1}} } \right]{{\partial ^{2} Q\left( {\upsilon _{1} ,\,\upsilon _{2} } \right)} \over {\partial \upsilon _{1} \partial \upsilon _{2} }} $$
 $${\rm and}\,v_{j} \, {\equals}\, f^{{{\minus}1}} \left( {u_{j} } \right)\,{\rm such}\,{\rm that}\,f\left( {v_{j} } \right)\, {\equals}\, v_{j} \,e^{{{\minus}\lambda \left( {1{\minus}v_{j} } \right)^{\alpha } }} ,\,j\, {\equals}\, 1,\,2.$$
The resulting pseudo-log-likelihood function of the above copula can be written as follows:
 $$\eqalignno{ l\left( \Theta \right) & \, {\equals}\, \mathop{\sum}\limits_{i\, {\equals}\, 1}^n {\left[ {\lambda \left[ {\left( {1{\minus}\upsilon _{{1i}} } \right)^{\alpha } {\plus}\left( {1{\minus}\upsilon _{{2i}} } \right)^{\alpha } {\minus}\left( {1{\minus}Q\left( {\upsilon _{{1i}} ,\,\upsilon _{{2i}} } \right)} \right)^{\alpha } } \right]} \right.} {\minus}{\rm ln}\left( {1{\plus}\lambda \alpha \upsilon _{{1i}} \left( {1{\minus}\upsilon _{{1i}} } \right)^{{\alpha {\minus}1}} } \right) \cr & \left. {{\minus}{\rm ln}\left( {1{\plus}\lambda \alpha \upsilon _{{2i}} \left( {1{\minus}\upsilon _{{2i}} } \right)^{{\alpha {\minus}1}} } \right){\plus}{\rm ln}\,W\left( {\upsilon _{{1i}} ,\,\upsilon _{{2i}} } \right)} \right] $$
∙ Model B: Λ follows a truncated discrete-stable distribution.
The joint density of the truncated discrete-stable copula is of the form:
 $$c\left( {u_{1} ,\,u_{2} } \right)\, {\equals}\, W\left( {v_{1} ,\,v_{2} } \right)\left( {{{1{\minus}e^{{{\minus}\lambda }} } \over {\lambda \alpha }}{{e^{{\lambda \left[ {\left( {1{\minus}v_{1} } \right)^{\alpha } {\plus}\left( {1{\minus}v_{2} } \right)^{\alpha } {\minus}\left( {1{\minus}Q\left( {v_{1} ,v_{2} } \right)} \right)^{\alpha } } \right]}} } \over {\left( {1{\minus}v_{1} } \right)^{{\alpha {\minus}1}} \left( {1{\minus}v_{2} } \right)^{{\alpha {\minus}1}} }}\left( {1{\minus}Q\left( {v_{1} ,v_{2} } \right)} \right)^{{\alpha {\minus}2}} } \right)$$
where
 $$\eqalignno{ W\left( {v_{1} ,\,v_{2} } \right) & \, {\equals}\, \left( {1{\minus}\alpha {\plus}\lambda \alpha \left( {1{\minus}Q\left( {v_{1} ,v_{2} } \right)} \right)^{\alpha } } \right){{\partial Q\left( {v_{1} ,\,v_{2} } \right)} \over {\partial v_{1} }}{{\partial Q\left( {v_{1} ,\,v_{2} } \right)} \over {\partial v_{2} }}{\plus}\left( {1{\minus}Q\left( {v_{1} ,\,v_{2} } \right)} \right){{\partial ^{2} Q\left( {v_{1} ,\,v_{2} } \right)} \over {\partial v_{1} \partial v_{2} }} \cr & {\rm and}\,v_{j} \, {\equals}\, 1{\minus}\left[ {{\minus}{{{\rm ln}\left( {e^{{{\minus}\lambda }} {\plus}u_{j} \left( {1{\minus}e^{{{\minus}\lambda }} } \right)} \right)} \over \lambda }} \right]^{{{1 \over \alpha }}} ,\,j\, {\equals}\, 1,\,2 $$
The resulting pseudo-log-likelihood function of the above copula is given by
 $$\eqalignno{ l\left( {\rm \Theta } \right) & \, {\equals}\, \mathop \sum\limits_{i\, {\equals}\, 1}^n \left[ {{\rm ln}\left( {1{\minus}e^{{{\minus}\lambda }} } \right){\minus}{\rm ln}\left( {\lambda \alpha } \right){\plus}\lambda \left[ {\left( {1{\minus}v_{{1i}} } \right)^{\alpha } {\plus}\left( {1{\minus}v_{{2i}} } \right)^{\alpha } {\minus}\left( {1{\minus}Q\left( {v_{{1i}} ,\,v_{{2i}} } \right)} \right)^{\alpha } } \right]} \right. \cr & \left. {{\minus}\left( {\alpha {\minus}1} \right){\rm ln}\left( {1{\minus}v_{{1i}} } \right){\minus}\left( {\alpha {\minus}1} \right){\rm ln}\left( {1{\minus}v_{{2i}} } \right){\plus}\left( {\alpha {\minus}2} \right){\rm ln}\left( {1{\minus}Q\left( {v_{{1i}} ,\,v_{{2i}} } \right)} \right){\plus}{\rm ln}W\left( {v_{{1i}} ,\,v_{{2i}} } \right)} \right] $$
3.2 Goodness of fit
Following the estimation of the parameter Θ, one need to assess the fit of the parametric copula C Θ to a given data set. In this respect, we consider the hypothesis tests
 $$H_{0} \,\colon\,C_{{\rm \Theta }} \in{\cal C}_{0} \,{\rm against}\,H_{1} \,\colon\,C_{{\rm \Theta }} \notin{\cal C}_{0} $$
where
 $${\cal C}_{0} \, {\equals}\, \left\{ {C_{{\rm \Theta }} \,\colon\,{\rm \Theta }\in{\cal O}} \right\}$$
is a class of some known parametric copulas and
 ${\cal O}$
an open subset of ℝ
p
for some integer p≥1. We refer to Genest et al. (Reference Genest, Rémillard and Beaudoin2009) for a review of the different methods used to assess the goodness of fit of a parametric copula.
In the sequel, we shall use the Cramer–von Mises test statistic, denoted hereafter by CVM. The corresponding statistic of this test is denoted by S
n
and is defined as follows:
 $$\left( {{\rm let}\,{\Bbb C}_{n} \left( {u,\,v} \right)\, {\equals}\, \sqrt n \left( {C_{n} \left( {u,\,v} \right){\minus}C_{{\rm \Theta }} \left( {u,\,v} \right)} \right)} \right)$$
 $$S_{n} \, {\equals}\, \mathop{\int}\limits_0^1 {\mathop{\int}\limits_0^1 {{\Bbb C}_{n} \left( {u,\,v} \right)^{2} dC_{n} \left( {u,\,v} \right)} } $$
where
 $C_{n} \left( {u,\,v} \right)\, {\equals}\, {1 \over n}\mathop{\sum}\nolimits_{i\, {\equals}\, 1}^n {1\left\{ {U_{i} \leq u,V_{i} \leq v} \right\}} {\rm \ztbnd6 }$
is the empirical copula and C
Θ the fitted copula with parameter Θ. It is worth mentioning that C
n
depends solely on the pseudo-observations U
i
and V
i
(see Deheuvels, Reference Deheuvels1979; Genest & Favre, Reference Genest and Favre2007). Large values for this test lead to the rejection of H
0.
Moreover, one might be interested to compute the p-values associated to S n . The larger the p-value the less likely is the rejection of the hypothesis H 0 at a significance level p. Genest et al. (Reference Genest, Rémillard and Beaudoin2009) described a parametric bootstrap procedure for the computation of the p-values corresponding to the goodness of fit using the CVM test statistic. The procedure is summarised under the following steps:
∙ Step 1: Calculate the MLE
 ${\rm \hat{\Theta }}$
of Θ using the PML method.
∙ Step 2: Compute the value of the test S n with
$$S_{n} \, {\equals}\, \mathop \sum\nolimits_{i\, {\equals}\, 1}^n \,\left( {C_{n} \left( {U_{i} ,\,V_{i} } \right){\minus}C_{{{\rm \hat{\Theta }}}} \left( {U_{i} ,\,V_{i} } \right)} \right)^{2} $$
.∙ Step 3: Let K denotes the number of bootstrap replications. Repeat Steps 4–6 for k∈{1, … , K}:
∙ Step 4: Generate a random sample
$\left( {\hat{X}_{{i,k}} ,\,\hat{Y}_{{i,k}} } \right)$
for i∈{1, … ,n} from
$C_{{{\rm \hat{\Theta }}}} $
as described in section 2.2 and compute their corresponding pseudo-observations, i.e,
$\hat{U}_{{i,k}} \, {\equals}\, {n \over {n{\plus}1}}\hat{X}_{{i,k}} $
and
$\hat{V}_{{i,k}} \, {\equals}\, {n \over {n{\plus}1}}\hat{Y}_{{i,k}} $
.∙ Step 5: Compute the empirical copula
$C_{{n,k}} \left( {u,\,v} \right)\, {\equals}\, {1 \over n}\mathop{\sum}\nolimits_{i\, {\equals}\, 1}^n {1 \{ {\hat{U}_{{i,k}} \leq u,\hat{V}_{{i,k}} \leq v} \}} {\rm \ztbnd6 }$
and estimate the MLE of Θ by
${\rm \hat{\Theta }}_{k} $
at each iteration based on
$\left( {\hat{U}_{{i,k}} ,\hat{V}_{{i,k}} } \right)$
for i∈{1, … ,n}.∙ Step 6: Calculate
$$S_{{n,k}} \, {\equals}\, \mathop{\sum}\nolimits_{i\, {\equals}\, 1}^n {\left( {C_{{n,k}} \left( {\hat{U}_{{i,k}} ,\hat{V}_{{i,k}} } \right){\minus}C_{{{\rm \hat{\Theta }}_{k} }} \left( {\hat{U}_{{i,k}} ,\hat{V}_{{i,k}} } \right)} \right)^{2} } $$
.


An approximate p-value for this test is given by
 $$p\, {\equals}\, {1 \over K}\mathop \sum\limits_{k\, {\equals}\, 1}^K {\rm \ztbnd6 }1\left( {S_{{n,k}} \geq S_{n} } \right).$$
Note that the largest the sample size, the more accurate the bootstrap procedure is (see Genest et al., Reference Genest, Rémillard and Beaudoin2009).
4 Insurance Applications
For illustration purposes, we consider real insurance data set applications. The original copula Q can be one of the following copulas: Gumbel, Frank, Student and Joe, see Appendix for more details on the copulas. Also, Λ with parameters (α, λ) follows one of the two distributions: shifted discrete-stable and truncated discrete-stable. We construct a new copula based on Q and Λ and assess the fit of this new family of copula to insurance data sets. We use the AIC criteria to assess the quality of each model relative to each of the other models. It is defined as
 $${\rm AIC}\, {\equals}\, {\minus}2{\rm \poll}l\left( {{\rm{\ {\vskip -4pt \hat} {\hskip -3.5pt \Theta }}}} \right){\plus}2p$$
where p=3 is the number of parameters to estimate and
 $l\left( {{\rm \hat{\Theta }}} \right)$
the pseudo-log-likelihood function as in (15) evaluated at
 ${\rm \hat{\Theta }}$
, estimator of Θ. Moreover, we use the CVM test to assess the goodness of fit of the copula to the data sets and compute the corresponding p-values relative to each copula model. Additionally, we include the root mean square error to measure the differences between the observed values and the ones predicted by the model. It is denoted hereafter by RMSE and is defined as follows, see Vandenberghe et al. (Reference Vandenberghe, Verhoest and De Baets2010), for instance
 $$RMSE\, {\equals}\, \sqrt {{1 \over n}\mathop \sum\limits_{i\, {\equals}\, 1}^n \left( {C_{{\rm \Theta }} \left( {U_{i} ,\,V_{i} } \right){\minus}C_{n} \left( {U_{i} ,\,V_{i} } \right)} \right)^{2} } $$
where C n is the empirical copula based on the observed values and C Θ the fitted one. Both models are then compared to other families of copulas already considered in Hashorva et al Reference Hashorva, Ratovomirija and Tamraz. (2017).
Remarks 4.1 In light of the bootstrap procedure described in section 3.2 for the computation of the p-value, we set K=1,000 that is K random samples of size n are generated where n corresponds to the size of each data set. Generally, K should be taken larger than the size of the data set used (see Genest et al., Reference Genest, Rémillard and Beaudoin2009). However, this is computationally intensive for most of the data sets considered.
4.1 Loss ALAE from medical insurance
In this section, we consider the SOA Medical Group Insurance data sets describing the medical claims observed over the years 1991–1992. These data sets can be found on the Society of Actuaries website under the following path: https://www.soa.org/Research/Experience-Study/group-health/91-92-group-medical-claims.aspx. The 171,236 claims recorded in both data sets are part of a larger database that includes the losses of 26 insurers over the period 1991–1992, see Grazier et al. (1997) for more description on the data.
We shall investigate the dependence between the hospital charges, corresponding to the loss variable X i , and the Other charges corresponding to the ALAE variable Y i associated to the settlement of X i .
The same data set was explored in Cebrian et al. (Reference Cebrian, Denuit and Lambert2003) where claims occurring during accident year 1991 were considered. For our study, we work with claims occurring during accident year 1992. The sample comprises of 75,789 claims. There are four different medical group plan types. Each policyholder belongs to one of these medical groups.
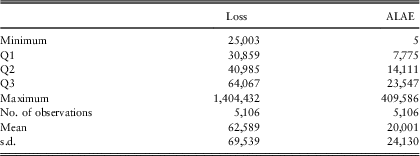
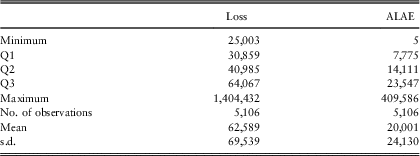
In the sequel, we consider the 1992 records relating to Plan type 4, the loss variable X i exceeding 25,000 in order to observe a positive dependence between the loss and the ALAE variables, and strictly positive ALAE. Some statistics on the data are presented in Table 2.
Statistics for Loss ALAE data from medical insurance.
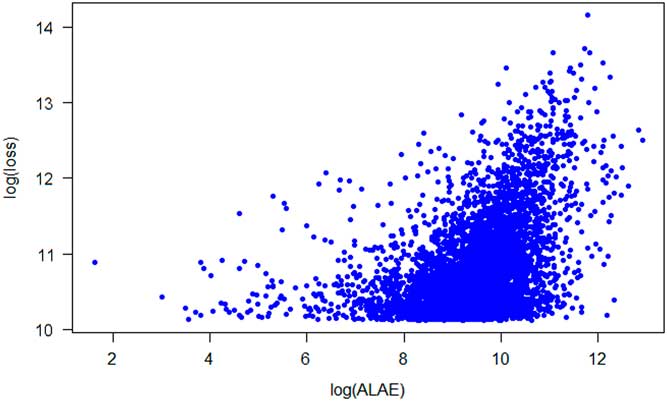
The scatterplot (ALAE, loss) on a log scale is depicted in Figure 1.
Scatterplot for log ALAE and log Loss.

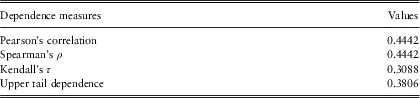
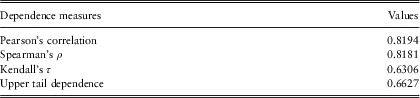
Furthermore, we compute the empirical dependence measures between the losses and their respective ALAE as shown in Table 3. The latter indicates a positive dependence between these two variables with an empirical upper tail dependence of 0.3806.
Dependence measures for Loss ALAE data from medical insurance.

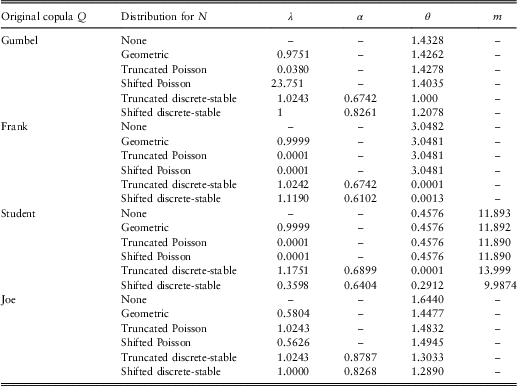
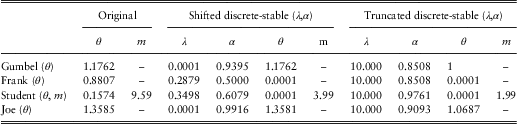
By maximising (15), we get the estimators of the parameters Θ of the copula models summarised hereunder in Table 4. The table includes as well the estimation of the parameters when Λ is either Geometric, Shifted Poisson or Truncated Poisson already considered in Hashorva et al Reference Hashorva, Ratovomirija and Tamraz. (2017).
Parameter estimation for the different copula models.

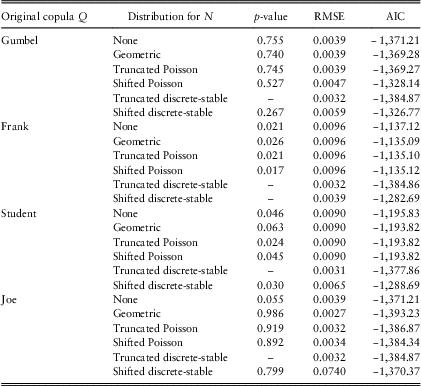
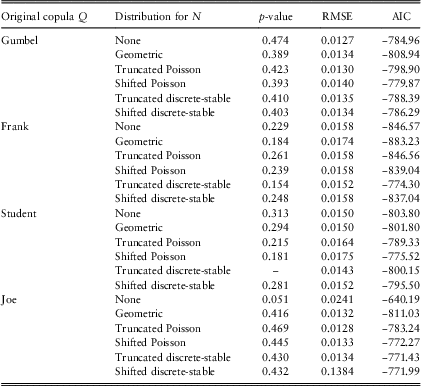
Following the estimation of the parameters, one is interested to assess the fit of these new copula models to the data set. The Table 5 illustrates the results.
p-Values, RMSE and AIC values for the different copula models.

Table 5 shows that
∙ Based on the p-values, the family of Gumbel and Joe copula are accepted at a significance level of 10% with the exception of Joe copula having a p-value of 5.5%. Clearly, the family of Frank and Student copula do not represent a good fit to the data due to a p-value smaller than 5%, however, the Student Geometric copula model is accepted at a significance level of 5%.
∙ Based on the RMSE, the Joe Geometric copula outperforms the other models having the smallest RMSE.
∙ And finally based on the AIC criteria, the Joe Geometric copula is the model that best fits the data followed by the Joe Truncated Poisson, Joe truncated discrete-stable and Gumbel truncated discrete-stable copulas.
4.2 Worker’s compensation insurance data
This data set examines the losses due to permanent and partial disability of the worker’s compensation line of business. In this data, we model the dependence between the pure premium P, defined as the loss due to partial and permanent disability per dollar of payroll, and the payroll PayR. The same data were used in Zhang & Lin (Reference Zhang and Lin2016) and Frees et al. (Reference Frees, Young and Luo2001). In order to reproduce the fit of the Geometric mixture copula developed by Zhang & Lin (Reference Zhang and Lin2016) we use the same estimation procedure. Therefore, the losses and payrolls are transformed to a logarithmic scale such that X=ln P and Y=ln PayR. Also, before replacing the marginals by their empirical distributions for the PML estimation approach, we smooth them by using the Gaussian non parametric kernel smoothing method defined for both components as follows (see e.g. Hansen, Reference Hansen2004):
 $$\widehat{{F_{X} }}\left( {x_{i} } \right)\, {\equals}\, {1 \over n}\mathop \sum\limits_{i\, {\equals}\, 1}^n {\rm \Phi }\left( {{{x_{i} {\minus}x_{j} } \over h}} \right)\,{\rm with}\,h\, {\equals}\, 0.2605,\,{\rm }\widehat{{F_{Y} }}\left( {y_{i} } \right)\, {\equals}\, {1 \over n}\mathop \sum\limits_{i\, {\equals}\, 1}^n {\rm \Phi }\left( {{{y_{i} {\minus}y_{j} } \over h}} \right)\,{\rm with }\,h\, {\equals}\, 0.1290$$
The empirical dependence measures are summarised in Table 6.
Dependence measures between P and PayR.

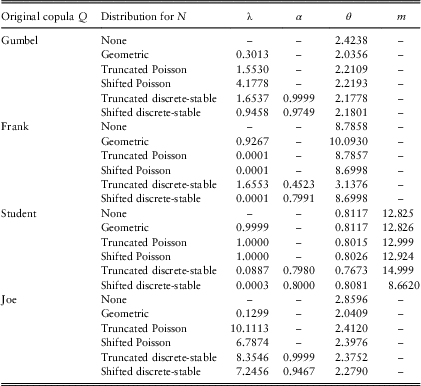
Table 7 gathers the estimation results from maximising (15). The parameters are estimated for all copula models including the ones considered in Hashorva et al Reference Hashorva, Ratovomirija and Tamraz. (2017) namely the case where Λ is either Geometric, Poisson or Truncated Poisson.
Parameter estimation for the different copula models.

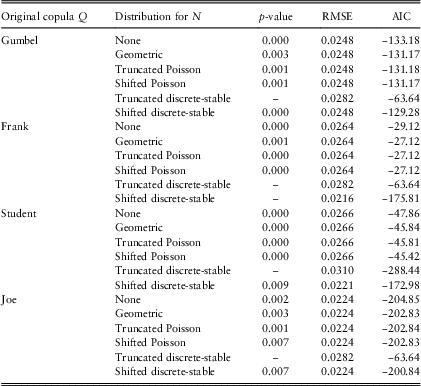
Following the estimation of the parameters, Table 8 highlights the results from the Goodness of fit test along with the RMSE and AIC criteria for each copula model.
p-Values, RMSE and AIC values for the different copula models.

Table 8 shows that
∙ based on the p-values, all models are accepted at a significance level of 10% with the exception of Joe copula having a p-value of 5.1%;
∙ based on the RMSE, the Gumbel copula followed by the Joe Truncated Poisson copula represent the best fit for the data as they have the smallest RMSE;
∙ and finally based on the AIC criteria, the family of Frank mixture copulas outperforms the others as for the majority of these copula models, the AIC is the smallest.
Joe copula should not be used to model this data as it has the lowest p-value (5.1%) and the greatest RMSE (0.0241) and AIC (−640.19) among all copula models. Moreover, Table 8 shows that for the majority of the models an increase in the p-value is associated with a decrease in the RMSE.
4.3 Danish fire insurance data
In this section, we shall consider the Danish data set collected from the Copenhagen Reinsurance Company which describes the fire insurance claims observed over the period 1980–1990. This data set is available on the following website www.ma.hw.ac.uk/∼mcneil/. It comprises of n=2,167 fire losses based on three components: buildings, content and profit. However, in the sequel, we shall analyse the dependency between the first two components. Let X i , Y i be the ith loss observed for both components respectively. For more description on the data, we refer to Haug et al. (Reference Haug, Klüppelberg and Peng2011). Table 9 displays the estimated parameters for each family of copula obtained when maximising the pseudo-log-likelihood function defined in (15).
Parameter estimation for the different copula models.

The Table 10 summarises the relevant measures relative to each copula model.
p-Values, RMSE and AIC values for the different copula models.

For this data set, Table 10 shows that
∙ based on the p-values, all models are rejected at a significance level of 1%;
∙ based on the RMSE, the Frank shifted discrete-stable copula models best the data with the lowest error;
∙ and finally based on the AIC, the copulas that best fit the data are the Student truncated discrete-stable copula followed by the Joe copula.
However, it is clear that, for this data set, the above models do not describe well the dependence of the maximum claim amounts and this is mainly explained by a low dependence level between the two components (see Hashorva et al Reference Hashorva, Ratovomirija and Tamraz., 2017).
4.4 Loss ALAE from general liability insurance
We use the data set available in R collected by the Insurance Services Office that examines the losses and their respective ALAE of a general liability insurance portfolio. For more description on the data, we refer to Denuit et al. (Reference Denuit, Purcaru and Van Keilegom2006). The data set comprises of n=1,500 claims from which 34 claims were censored. In the sequel, X i represents the ith loss observed and Y i the corresponding ALAE. Each loss X i is associated with a policy limit ℓ i . Typically, if X i exceeds the policy limit ℓ i , the observed loss corresponds to ℓ i , i.e., the exact amount of the loss is unknown. In this respect, we define the indicator function δ i as follows:
 $$\delta _{i} \, {\equals}\, \left\{ {\matrix{ 1 \hfill & {{\rm }if{\rm }} \hfill & {X_{i} \leq \ell _{i} ,} \hfill \cr 0 \hfill & {{\rm }if{\rm }} \hfill & {X_{i} \,\gt\,\ell _{i} ,i\, {\equals}\, 1,\,\ldots\,,n} \hfill \cr } } \right.$$
To estimate the parameters of the new copula, we shall maximise the pseudo-log-likelihood function l(Θ) defined in (15). Typically, U
i
and V
i
are the pseudo-observations of the variables X
i
and Y
i
, respectively, as defined in section 3.1. However, given that this data set is right-censored for the loss variable X
i
, the marginal of the latter, i.e.,
 $\widetilde{{G_{1} }}\left( x \right)$
, shall be approximated by the Kaplan–Meier estimator. Thus, the resulting pseudo-log-likelihood function is given by
 $$l\left( \Theta \right)\, {\equals}\, \mathop{\sum}\limits_{i\, {\equals}\, 1}^n {\left( {\delta _{i} \,\ln \,c_{\Theta } \,\left( {u_{i} ,\,v_{i} } \right){\plus}\left( {1{\minus}\delta _{i} } \right)\,\ln \,\left( {1{\minus}{{\partial C_{\Theta } \left( {u_{i} ,\,v_{i} } \right)} \over {\partial v}}} \right)} \right)} $$
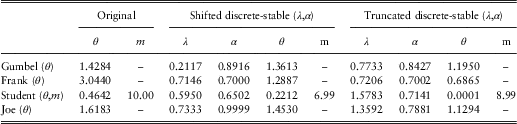
We shall estimate the parameter Θ of the new copula by maximising (18). The Table 11 describes the estimated parameters for the different families of copulas.
Parameter estimation for the different copula models.

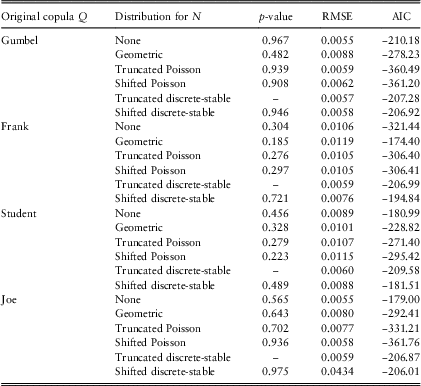
Following the estimation of the parameters, one is interested in assessing the fit of those models to the general liability data set. The table highlights the p-values, RMSE and AIC criteria for each model. These models are then compared to the ones observed in Hashorva et al Reference Hashorva, Ratovomirija and Tamraz. (2017), i.e., the case where Λ is either Geometric, Shifted Poisson or Truncated Poisson.
Table 12 shows that
∙ based on the p-values, all models are accepted at a significance level of 10%;
∙ based on the RMSE, the Joe Shifted discrete-stable copula outperforms the others having the smallest RMSE followed by the Gumbel and Joe shifted Poisson copulas;
∙ and finally based on the AIC criteria, the Frank shifted discrete-stable copula is the model that best fits the data, having the smallest AIC among all other models.
p-Values, RMSE and AIC values for the different copula models.

5 Proofs
5.1 Derivation of (16)–(17)
We derive first (16). Λ follows a shifted discrete-stable distribution with Laplace transform defined in (11). In light of (3), we compute the 1st and 2nd derivatives of (11) with respect to t:
 $$\eqalignno{ L_{{\rm \Lambda }}^{{\rm '}} \left( t \right)\, {\equals}\, & {\minus}e^{{{\minus}t}} e^{{{\minus}\lambda \left( {1{\minus}e^{{{\minus}t}} } \right)^{\alpha } }} \left( {1{\plus}\lambda \alpha e^{{{\minus}t}} \left( {1{\minus}e^{{{\minus}t}} } \right)^{{\alpha {\minus}1}} } \right), \cr L_{{\rm \Lambda }}^{{{\rm ''}}} \left( t \right)\, {\equals}\, &e^{{{\minus}t}} e^{{{\minus}\lambda \left( {1{\minus}e^{{{\minus}t}} } \right)^{\alpha } }} \left( {1{\plus}3\lambda \alpha e^{{{\minus}t}} \left( {1{\minus}e^{{{\minus}t}} } \right)^{{\alpha {\minus}1}} {\plus}\lambda ^{2} \alpha ^{2} e^{{{\minus}2t}} \left( {1{\minus}e^{{{\minus}t}} } \right)^{{2\alpha {\minus}2}}} \right \cr & {\plus}\lambda \alpha e^{{{\minus}2t}} \left( {1{\minus}e^{{{\minus}t}} } \right)^{{\alpha {\minus}2}} {\minus}\lambda \alpha ^{2} e^{{{\minus}2t}} \left( {1{\minus}e^{{{\minus}t}} } \right)^{{\alpha {\minus}2}} } \right) $$
By setting t=−lnQ(v
1, v
2) in (19) with
 $v_{i} \, {\equals}\, e^{{{\minus}L_{{\rm \Lambda }}^{{{\minus}1}} \left( {u_{i} } \right)}} $
for i=1, 2, c
Θ(u
1, u
2) defined in (3) is given by
 $$\eqalignno{ c_{{\rm \Theta }} \left( {u_{1} ,u_{2} } \right) & \, {\equals}\, {{e^{{\lambda \left[ {\left( {1{\minus}v_{1} } \right)^{\alpha } {\plus}\left( {1{\minus}v_{2} } \right)^{\alpha } {\minus}\left( {1{\minus}Q\left( {v_{1} ,\,v_{2} } \right)} \right)^{\alpha } } \right]}} } \over {\left( {1{\plus}\lambda \alpha v_{1} \left( {1{\minus}v_{1} } \right)^{{\alpha {\minus}1}} } \right)\left( {1{\plus}\lambda \alpha v_{2} \left( {1{\minus}v_{2} } \right)^{{\alpha {\minus}1}} } \right)}} \left[ {\left( {2\lambda \alpha (1{\minus}Q\left( {v_{1} ,\,v_{2} } \right)} \right)^{{\alpha {\minus}1}} {\plus}\lambda ^{2} \alpha ^{2} Q\left( {v_{1} ,v_{2} } \right) } \right. \cr & \left. {\left( {1{\minus}Q\left( {v_{1} ,\,v_{2} } \right)} \right)^{{2\alpha {\minus}2}} {\plus}\lambda \alpha Q\left( {v_{1} ,\,v_{2} } \right)\left( {1{\minus}Q\left( {v_{1} ,\,v_{2} } \right)} \right)^{{\alpha {\minus}2}} {\minus}\lambda \alpha ^{2} Q\left( {v_{1} ,v_{2} } \right)\left( {1{\minus}Q\left( {v_{1} ,\,v_{2} } \right)} \right)^{{\alpha {\minus}2}} } \right) \cr & \left. {{\partial Q\left( {v_{1} ,\,v_{2} } \right)} \over {\partial v_{1} }}{{\partial Q\left( {v_{1} ,\,v_{2} } \right)} \over {\partial v_{2} }}{{\plus}\left( {1{\plus}\lambda \alpha Q\left( {v_{1} ,\,v_{2} } \right)\left( {1{\minus}Q\left( {v_{1} ,\,v_{2} } \right)} \right)^{{\alpha {\minus}1}} } \right){{\partial ^{2} Q\left( {v_{1} ,v_{2} } \right)} \over {\partial v_{1} \partial v_{2} }}} \right] \cr & \, {\equals}\, {{e^{{\lambda \left[ {\left( {1{\minus}v_{1} } \right)^{\alpha } {\plus}\left( {1{\minus}v_{2} } \right)^{\alpha } {\minus}\left( {1{\minus}Q\left( {v_{1} ,\,v_{2} } \right)} \right)^{\alpha } } \right]}} } \over {\left( {1{\plus}\lambda \alpha v_{1} \left( {1{\minus}v_{1} } \right)^{{\alpha {\minus}1}} } \right)\left( {1{\plus}\lambda \alpha v_{2} \left( {1{\minus}v_{2} } \right)^{{\alpha {\minus}1}} } \right)}}\left[ {\lambda \alpha \left( {1{\minus}Q\left( {v_{1} ,\,v_{2} } \right)} \right)^{{\alpha {\minus}2}} \left( {2{\minus}\left( {\alpha {\plus}1} \right)Q\left( {v_{1} ,\,v_{2} } \right)} \right.} \right. \cr & \left. {\left. {{\plus}\lambda \alpha Q\left( {v_{1} ,\,v_{2} } \right)\left( {1{\minus}Q(v_{1} ,\,v_{2} )} \right)^{\alpha } } \right){{\partial Q\left( {v_{1} ,\,v_{2} } \right)} \over {\partial v_{1} }}{{\partial Q\left( {v_{1} ,\,v_{2} } \right)} \over {\partial v_{2} }}}\right \cr & {\plus}\left( {1{\plus}\lambda \alpha Q\left( {v_{1} ,\,v_{2} } \right)\left( {1{\minus}Q\left( {v_{1} ,\,v_{2} } \right)} \right)^{{\alpha {\minus}1}} } \right){{\partial ^{2} Q\left( {v_{1} ,\,v_{2} } \right)} \over {\partial v_{1} \partial v_{2} }} \Big ] $$
where for i=1, 2
 $$u_{i} \, {\equals}\, v_{i} e^{{{\minus}\lambda \left( {1{\minus}v_{i} } \right)^{\alpha } }} \,{\rm and}\,{{\partial v_{i} } \over {\partial u_{i} }}\, {\equals}\, {{e^{{\lambda \left( {1{\minus}v_{i} } \right)^{\alpha } }} } \over {1{\plus}\lambda \alpha v_{i} \left( {1{\minus}v_{i} } \right)^{{\alpha {\minus}1}} }}$$
Next, we show (17). Hereafter, Λ follows a truncated discrete-stable distribution. Its Laplace transform is defined in (13) and the corresponding first and second derivatives of (13) are given by
 $$\eqalignno{ & L_{{\rm \Lambda }}^{{\rm '}} \left( t \right)\, {\equals}\, {{{\minus}\lambda \alpha e^{{{\minus}\lambda \left( {1{\minus}e^{{{\minus}t}} } \right)^{\alpha } }} e^{{{\minus}t}} \left( {1{\minus}e^{{{\minus}t}} } \right)^{{\alpha {\minus}1}} } \over {1{\minus}e^{{{\minus}\lambda }} }}, \cr & L_{{\rm \Lambda }}^{{{\rm ''}}} \left( t \right)\, {\equals}\, {{\lambda \alpha e^{{{\minus}\lambda \left( {1{\minus}e^{{{\minus}t}} } \right)^{\alpha } }} e^{{{\minus}t}} \left( {1{\minus}e^{{{\minus}t}} } \right)^{{\alpha {\minus}2}} } \over {1{\minus}e^{{{\minus}\lambda }} }}\left( {1{\minus}\alpha e^{{{\minus}t}} {\plus}\lambda \alpha e^{{{\minus}t}} \left( {1{\minus}e^{{{\minus}t}} } \right)^{\alpha } } \right) $$
By replacing t in (20) with − lnQ(v 1, v 2), we show that (3) is given by
 $$\eqalignno{ c_{{\rm \Theta }} \left( {u_{1} ,\,u_{2} } \right) & \, {\equals}\, \left( {{{1{\minus}e^{{{\minus}\lambda }} } \over {\lambda \alpha }}} \right)^{2} {{e^{{\lambda \left[ {\left( {1{\minus}v_{1} } \right)^{\alpha } {\plus}\left( {1{\minus}v_{2} } \right)^{\alpha } } \right]}} } \over {\left( {1{\minus}v_{1} } \right)^{{\alpha {\minus}1}} \left( {1{\minus}v_{2} } \right)^{{\alpha {\minus}1}} }}\left( {{{\lambda \alpha } \over {1{\minus}e^{{{\minus}\lambda }} }}} \right)e^{{{\minus}\lambda \left( {1{\minus}Q\left( {v_{1} ,\,v_{2} } \right)} \right)^{\alpha } }} \left( {1{\minus}Q\left( {v_{1} ,\,v_{2} } \right)} \right)^{{\alpha {\minus}2}} \cr & {\times}\left[ {\left( {1{\minus}\alpha {\plus}\lambda \alpha \left( {1{\minus}Q\left( {v_{1} ,\,v_{2} } \right)} \right)^{\alpha } } \right){{\partial Q\left( {v_{1} ,\,v_{2} } \right)} \over {\partial v_{1} }}{{\partial Q\left( {v_{1} ,\,v_{2} } \right)} \over {\partial v_{2} }}{\plus}\left( {1{\minus}Q\left( {v_{1} ,\,v_{2} } \right)} \right){{\partial ^{2} Q\left( {v_{1} ,\,v_{2} } \right)} \over {\partial v_{1} \partial v_{2} }}} \right] \cr & \, {\equals}\, {{1{\minus}e^{{{\minus}\lambda }} } \over {\lambda \alpha }}{{e^{{\lambda \left[ {\left( {1{\minus}v_{1} } \right)^{\alpha } {\plus}\left( {1{\minus}v_{2} } \right)^{\alpha } {\minus}\left( {1{\minus}Q\left( {v_{1} ,\,v_{2} } \right)} \right)^{\alpha } } \right]}} } \over {\left( {1{\minus}v_{1} } \right)^{{\alpha {\minus}1}} \left( {1{\minus}v_{2} } \right)^{{\alpha {\minus}1}} }}\left( {1{\minus}Q\left( {v_{1} ,\,v_{2} } \right)} \right)^{{\alpha {\minus}2}} \cr & \left[ {\left( {1{\minus}\alpha {\plus}\lambda \alpha \left( {1{\minus}Q\left( {v_{1} ,\,v_{2} } \right)} \right)^{\alpha } } \right){{\partial Q\left( {v_{1} ,\,v_{2} } \right)} \over {\partial v_{1} }}{{\partial Q\left( {v_{1} ,\,v_{2} } \right)} \over {\partial v_{2} }}{\plus}\left( {1{\minus}Q\left( {v_{1} ,\,v_{2} } \right)} \right){{\partial ^{2} Q\left( {v_{1} ,\,v_{2} } \right)} \over {\partial v_{1} \partial v_{2} }}} \right] $$
where for i=1, 2
 $$v_{i} \, {\equals}\, 1{\minus}\left( {{{{\minus}{\rm ln}\left[ {e^{{{\minus}\lambda }} {\plus}u_{i} \left( {1{\minus}e^{{{\minus}\lambda }} } \right)} \right]} \over \lambda }} \right)^{{{1 \over \alpha }}} {\rm and}\,{{\partial v_{i} } \over {\partial u_{i} }}\, {\equals}\, {{1{\minus}e^{{{\minus}\lambda }} } \over {\lambda \alpha }}{{e^{{\lambda \left( {1{\minus}v_{i} } \right)^{\alpha } }} } \over {\left( {1{\minus}v_{i} } \right)^{{\alpha {\minus}1}} }}$$
Appendix
In light of section 4, we describe below some distributional properties of the original copula Q θ (v 1,v 2) that we considered for illustration purposes.
A.1 Gumbel copula
The Gumbel copula is an Archimedean copula with generator ψ θ (t)=(−lnt) θ and distribution function defined as follows:
 $$Q_{\theta } \left( {v_{1} ,\,v_{2} } \right)\, {\equals}\, e^{{{\minus}\left[ {\left( {{\minus}{\rm ln}\,v_{1} } \right)^{\theta } {\plus}\left( {{\minus}{\rm ln}\,v_{2} } \right)^{\theta } } \right]^{{{1 \over \theta }}} }} $$
where θ≥1 is the dependence parameter.
The partial derivative of Q θ with respect to v 1 is given by
 $${{\partial Q_{\theta } \left( {v_{1} ,\,v_{2} } \right)} \over {\partial v_{1} }}\, {\equals}\, {1 \over {v_{1} }}\left( {{\minus}{\rm ln}\,v_{1} } \right)^{{\theta {\minus}1}} \left[ {\left( {{\minus}{\rm ln}\,v_{1} } \right)^{\theta } {\plus}\left( {{\minus}{\rm ln}\,v_{2} } \right)^{\theta } } \right]^{{{1 \over {\theta {\minus}1}}}} e^{{{\minus}\left[ {\left( {{\minus}{\rm ln}\,v_{1} } \right)^{\theta } {\plus}\left( {{\minus}{\rm ln}\,v_{2} } \right)^{\theta } } \right]^{{{1 \over \theta }}} }} $$
By differentiating (21) with respect to v 2, we get the joint density copula q θ (v 1,v 2) defined below
 $$\eqalignno{ & q_{\theta } \left( {v_{1} ,\,v_{2} } \right)\, {\equals}\, {{\left( {{\minus}{\rm ln}\,v_{1} } \right)^{{\theta {\minus}1}} \left( {{\minus}{\rm ln}\,v_{2} } \right)^{{\theta {\minus}1}} } \over {v_{1} v_{2} }}{\times} \cr & \left( {\left[ {\left( {{\minus}{\rm ln}\,v_{1} } \right)^{\theta } {\plus}\left( {{\minus}{\rm ln}\,v_{2} } \right)^{\theta } } \right]^{{{2 \over \theta }{\minus}2}} {\plus}\left( {\theta {\minus}1} \right)\left[ {\left( {{\minus}{\rm ln}\,v_{1} } \right)^{\theta } {\plus}\left( {{\minus}{\rm ln}\,v_{2} } \right)^{\theta } } \right]^{{{1 \over \theta }{\minus}2}} } \right)e^{{{\minus}\left[ {\left( {{\minus}{\rm ln}\,v_{1} } \right)^{\theta } {\plus}\left( {{\minus}{\rm ln}\,v_{2} } \right)^{\theta } } \right]^{{{1 \over \theta }}} }} $$
A.2 Frank copula
The Frank copula is an Archimedean copula with generator
 $$\psi _{\theta } \left( t \right)\, {\equals}\, {\minus}ln\left( {{{e^{{{\minus}\theta t}} {\minus}1} \over {e^{{{\minus}\theta }} {\minus}1}}} \right)$$
and distribution function given by
 $$Q_{\theta } \left( {v_{1} ,\,v_{2} } \right)\, {\equals}\, {{{\minus}1} \over \theta }{\rm ln}\left( {1{\plus}{{\left( {e^{{{\minus}\theta v_{1} }} {\minus}1} \right)\left( {e^{{{\minus}\theta v_{2} }} {\minus}1} \right)} \over {e^{{{\minus}\theta }} {\minus}1}}} \right)$$
where θ≠1 is the dependence parameter.
The partial derivative of Q θ with respect to v 1 is defined as follows:
 $${{\partial Q_{\theta } \left( {v_{1} ,\,v_{2} } \right)} \over {\partial v_{1} }}\, {\equals}\, {{e^{{{\minus}\theta v_{1} }} \left( {e^{{{\minus}\theta v_{2} }} {\minus}1} \right)} \over {\left( {e^{{{\minus}\theta }} {\minus}1} \right){\plus}\left( {e^{{{\minus}\theta v_{1} }} {\minus}1} \right)\left( {e^{{{\minus}\theta v_{2} }} {\minus}1} \right)}}$$
By differentiating (22) with respect to v 2, the joint density copula q θ (v 1, v 2) can be expressed as follows:
 $$q_{\theta } \left( {v_{1} ,\,v_{2} } \right)\, {\equals}\, {{\theta \left( {1{\minus}e^{{{\minus}\theta }} } \right)e^{{{\minus}\theta \left( {v_{1} {\plus}v_{2} } \right)}} } \over {\left[ {\left( {1{\minus}e^{{{\minus}\theta }} } \right){\minus}\left( {1{\minus}e^{{{\minus}\theta v_{1} }} } \right)\left( {1{\minus}e^{{{\minus}\theta v_{2} }} } \right)} \right]^{2} }}$$
A.3 Joe copula
The Joe copula is an Archimedean copula with generator ψ θ (t)=−ln(1−(1−t) θ ) and distribution function defined as follows:
 $$Q_{\theta } \left( {v_{1} ,\,v_{2} } \right)\, {\equals}\, 1{\minus}\left[ {\left( {1{\minus}v_{1} } \right)^{\theta } {\plus}\left( {1{\minus}v_{2} } \right)^{\theta } {\minus}\left( {1{\minus}v_{1} } \right)^{\theta } \left( {1{\minus}v_{2} } \right)^{\theta } } \right]^{{{1 \over \theta }}} $$
where θ≥1 is the dependence parameter.
The partial derivative of Q θ with respect to v 1 is given by
 $${{\partial Q_{\theta } \left( {v_{1} ,v_{2} } \right)} \over {\partial v_{1} }}\, {\equals}\, \left( {1{\minus}v_{1} } \right)^{{\theta {\minus}1}} \left( {1{\minus}\left( {1{\minus}v_{2} } \right)^{\theta } } \right)\left( {\left( {1{\minus}v_{1} } \right)^{\theta } {\plus}\left( {1{\minus}v_{2} } \right)^{\theta } {\minus}\left( {1{\minus}v_{1} } \right)^{\theta } \left( {1{\minus}v_{2} } \right)^{\theta } } \right)^{{{1 \over \theta }{\minus}1}} $$
By differentiating (23) with respect to v 2, the joint density copula can be written as
 $$\eqalignno{ & q_{\theta } \left( {v_{1} ,\,v_{2} } \right)\, {\equals}\, \left( {1{\minus}v_{1} } \right)^{{\theta {\minus}1}} \left( {1{\minus}v_{2} } \right)^{{\theta {\minus}1}} \left( {\theta {\minus}1{\plus}\left( {1{\minus}v_{1} } \right)^{\theta } {\plus}\left( {1{\minus}v_{2} } \right)^{\theta } {\minus}\left( {1{\minus}v_{1} } \right)^{\theta } \left( {1{\minus}v_{2} } \right)^{\theta } } \right){\times} \cr & \left( {\left( {1{\minus}v_{1} } \right)^{\theta } {\plus}\left( {1{\minus}v_{2} } \right)^{\theta } {\minus}\left( {1{\minus}v_{1} } \right)^{\theta } \left( {1{\minus}v_{2} } \right)^{\theta } } \right)^{{{1 \over \theta }{\minus}2}} $$
A.4. Clayton copula
The Clayton copula is an Archimedean copula with generator
 $\psi _{\theta } \left( t \right)\, {\equals}\, {1 \over \theta }\left( {t^{{{\minus}\theta }} {\minus}1} \right)$
and distribution function defined as follows:
 $$\eqalignno{ Q_{\theta } \left( {v_{1} ,\,v_{2} } \right)\, {\equals}&\, \left[ {{\rm max}\left( {u^{{{\minus}\theta }} {\plus}v^{{{\minus}\theta }} {\minus}1;0} \right)} \right]^{{{\minus}{1 \over \theta }}} \cr & \,\colon\,\, {\equals}\, \left( {u^{{{\minus}\theta }} {\plus}v^{{{\minus}\theta }} {\minus}1;0} \right)^{{{\minus}{1 \over \theta }}} $$
where θ∈[−1, ∞)\{0} is the dependence parameter.
The partial derivative of Q θ with respect to v 1 is given by
 $${{\partial Q_{\theta } \left( {v_{1} ,\,v_{2} } \right)} \over {\partial v_{1} }}\, {\equals}\, v_{1}^{{{\minus}\left( {\theta {\plus}1} \right)}} \left( {v_{1}^{{{\minus}\theta }} {\plus}v_{2}^{{{\minus}\theta }} {\minus}1} \right)^{{{\minus}{1 \over \theta }{\minus}1}} $$
By differentiating (24) with respect to v 2, the joint density copula can be expressed as follows:
 $$q_{\theta } \left( {v_{1} ,v_{2} } \right)\, {\equals}\, \left( {\theta {\plus}1} \right)\left( {v_{1} \,v_{2} } \right)^{{{\minus}\left( {\theta {\plus}1} \right)}} \left( {v_{1}^{{{\minus}\theta }} {\plus}v_{2}^{{{\minus}\theta }} {\minus}1} \right)^{{{\minus}{1 \over \theta }{\minus}2}} $$
A.5. Student copula
The distribution function of the Student copula with dependence parameter θ∈(−1, 1) and m degrees of freedom is defined as follows:
 $$\eqalignno{ & Q_{{\theta ,m}} \left( {v_{1} ,v_{2} } \right)\, {\equals}\, t_{{\theta ,m}} \left( {t_{m}^{{{\minus}1}} \left( {v_{1} } \right),t_{m}^{{{\minus}1}} \left( {v_{2} } \right)} \right) \cr & \, {\equals}\,\int \limits_{{\minus}\infty}^{t_{m}^{{{\minus}1}} (v_{1} )} {\int}\limits_{{\minus}\infty}^{t_{m}^{{{\minus}1}} (v_{2} )} {{1 \over {2\pi \left( {1{\minus}\theta ^{2} } \right)^{{1\,/\,2}} }}\left[ {1{\plus}{{s^{2} {\minus}2\theta st{\plus}t^{2} } \over {m\left( {1{\minus}\theta ^{2} } \right)}}} \right]} ^{{{\minus}(m{\plus}2)\,/\,2}} {\rm }ds{\rm }dt $$
The partial derivative with respect to v 1 is given by
 $${{\partial Q_{{\theta ,m}} \left( {v_{1} ,\,v_{2} } \right)} \over {\partial v_{1} }}\, {\equals}\, t_{{m{\plus}1}} \left[ {\left( {t_{m}^{{{\minus}1}} \left( {v_{2} } \right){\minus}\theta t_{m}^{{{\minus}1}} \left( {v_{1} } \right)} \right)\,\left/\,\left( {\sqrt {{{\left( {m{\plus}(t_{m}^{{{\minus}1}} (v_{1} ))^{2} } \right)\left( {1{\minus}\theta ^{2} } \right)} \over {m{\plus}1}}} } \right)} \right]$$
By differentiating (25) with respect to v 2, we get the joint density copula q θ (v 1,v 2) defined below
 $$q_{{\theta ,m}} \left( {v_{1} ,v_{2} } \right)\, {\equals}\, {1 \over {2\pi \sqrt {1{\minus}\theta ^{2} } }}{1 \over {{\rm }dt\left( {t_{m}^{{{\minus}1}} \left( {v_{1} } \right)} \right){\rm }dt\left( {t_{m}^{{{\minus}1}} \left( {v_{2} } \right)} \right)}}\left( {1{\plus}{{t_{m}^{{{\minus}1}} \left( {v_{1} } \right)^{2} {\plus}t_{m}^{{{\minus}1}} \left( {v_{2} } \right)^{2} {\minus}2\theta t_{m}^{{{\minus}1}} \left( {v_{1} } \right)t_{m}^{{{\minus}1}} \left( {v_{2} } \right)} \over {m\left( {1{\minus}\theta ^{2} } \right)}}} \right)^{{{\minus}{{m{\plus}2} \over 2}}} $$
where
 $dt\left( {t_{m}^{{{\minus}1}} \left( {v_{i} } \right)} \right)\, {\equals}\, {{{\rm \Gamma }\left( {{{m{\plus}1} \over 2}} \right)} \over {{\rm \Gamma }\left( {{m \over 2}} \right)\sqrt {\pi m} }}\left( {1{\plus}{{t_{m}^{{{\minus}1}} \left( {v_{i} } \right)^{2} } \over m}} \right)^{{{\minus}{{m{\plus}1} \over 2}}} $
for i=1, 2.