Introduction
Primary carcinoma of the middle ear is a rare disease with a poor outcome.Reference Gurgel, Karnell and Hansen1 Its reported incidence varies from 1 per 4000 to 1 per 20000.Reference Yeung, Bridger, Smee, Baldwin and Bridger2, Reference Madsen, Gundgaard, Hoff, Maare, Holmboe and Knap3 Because of its rarity, there is a paucity of published data on primary middle-ear carcinoma. Previous studies have either reported middle-ear carcinoma data pooled with external auditory canal carcinomas, or focused on histological and clinical subsets of middle-ear tumours.Reference Gurgel, Karnell and Hansen1, Reference Madsen, Gundgaard, Hoff, Maare, Holmboe and Knap3–Reference Wang and Wang5 Furthermore, the current literature does little to characterise the computed tomography (CT) and magnetic resonance imaging (MRI) features of the disease. Because the middle ear is a cavity within the temporal bone, middle-ear carcinoma causes symptoms similar to those of chronic otitis media, making it difficult for clinicians to make an early diagnosis.
The purpose of this report is to review the CT and MRI findings of primary middle-ear carcinoma, in order to better understand the imaging features of this disease and to facilitate earlier diagnosis.
Materials and methods
The study protocol was approved by our hospital.
A retrospective, archival case review identified 13 cases of histologically confirmed, primary middle-ear carcinoma in adult patients managed between 2006 and 2011. These patients' CT and MRI scans were analysed to determine: (1) sites of bone erosion in the temporal bone and skull base; (2) sites of soft-tissue involvement, including the parotid gland, temporomandibular joint fossa and intracranial extension; and (3) vascular involvement of the jugular bulb, sigmoid sinus and internal carotid artery.
Computed tomography scans were performed on a Siemens Sensation 10 spiral CT scanner (Siemens, Munich, Germany). Eleven patients underwent high-resolution CT scanning of the temporal bone with 1- or 2-mm-thick, consecutive sections obtained in the axial and coronal planes, using a bone algorithm and an extended window of 4000 Hounsfield units. The section thickness of the soft-tissue CT windows was 3 mm. Two patients underwent contrast-enhanced CT scans with 3-mm-thick sections.
Magnetic resonance scans were performed on all 13 patients using a GE Signa 1.5-Tesla unit with a head coil (GE, Fairfield, Connecticut, USA). A T2-weighted sequence (repetition time, 3000 milliseconds; echo time, 86 milliseconds; matrix size, 256 × 160; and slice thickness, 3–4 mm) was performed in both the axial and coronal planes, followed by a T1-weighted sequence (repetition time, 360 milliseconds; echo time, 9.1 milliseconds; matrix size, 256 × 160; and slice thickness, 3–4 mm) in the axial plane. After the administration of gadopentetate dimeglumine (0.2 mmol/kg), fat-saturated T1-weighted sequences were obtained in both the axial and coronal planes.
Results
Of the 13 patients (6 men and 7 women) with primary middle-ear carcinoma, 12 had squamous cell carcinoma and one had adenocarcinoma. The mean patient age was 58.1 years (range, 42 to 73 years). The most common presenting symptoms were hearing loss (13 of the 13 patients) and a history of chronic ear discharge (12 of 13). Other symptoms included facial palsy (6 of 13 patients), tinnitus (5 of 13), otalgia (4 of 13) and headache (1 of 13). In addition, two patients had a history of tympanoplasty.
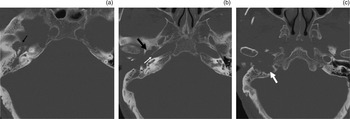
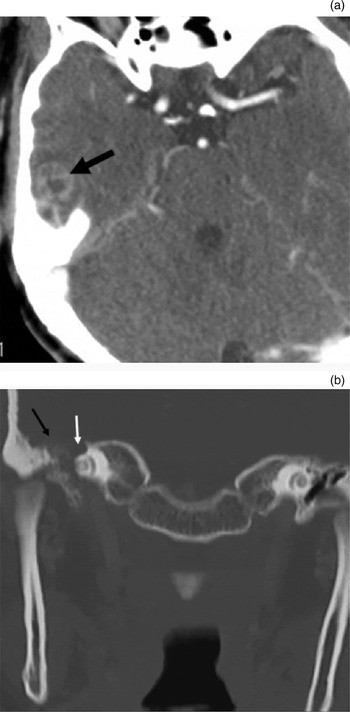
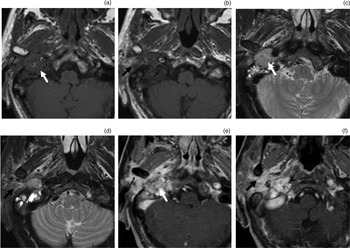
On CT and MRI scans, soft-tissue masses were identified mainly in the tympanum, tympanic sinus and deep in the external auditory canal, and involved the jugular fossa (9 of 13 patients), middle cranial fossa (5 of 13), parotid gland (2 of 13) and temporomandibular joint fossa (1 of 13) (Figures 1 to 3).
Axial, high-resolution computed tomography images from a 66-year-old man with primary middle-ear carcinoma, showing soft-tissue mass involvement of the tympanum, external auditory canal and jugular fossa. Images show destruction of (a) the floor of the middle cranial fossa (arrow), (b) the eustachian tube (thick black arrow) and carotid artery canal (thin white arrow), and (c) the jugular foramen (arrow).

Computed tomography images from a 42-year-old woman with primary middle-ear carcinoma involving the middle cranial fossa. (a) Axial, contrast-enhanced image showing tumour involvement of the right temporal lobe (arrow). (b) Coronal, bone window image showing bone destruction of the floor of the middle cranial fossa (black arrow) and the geniculi of the facial nerve canal (white arrow).

Axial magnetic resonance images of primary middle-ear carcinoma with infiltration of the jugular fossa (thick white arrow), parotid gland (thick black arrow) and temporomandibular joint fossa (thin black arrow). The mass appears as isointense on T1-weighted sequences (a & b) and slightly hyperintense on T2-weighted sequences (c & d). After contrast administration, the lesion enhances moderately and inhomogeneously (e & f).

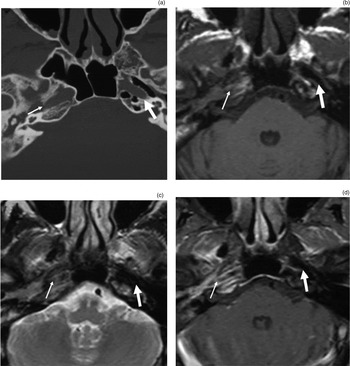
In the 11 cases undergoing conventional CT scanning, the soft-tissue masses were shown to be homogeneous in 7 cases (CT values of 30–55 Hounsfield units) and heterogeneous in 4 cases. In the latter four cases, small, high-density lesions were found. An irregular, ‘moth-eaten’ pattern of bone destruction was clearly shown on high-resolution CT. The most common sites of bone destruction seen on high-resolution CT were the eustachian tube (9 of 13 patients) (Figure 1b), jugular foramen (9 of 13) (Figure 1c) and facial nerve canal (7 of 13) (Figure 2b). Other sites of bone destruction were seen in smaller numbers of patients, and included the carotid artery canal (5 of 13 patients) (Figures 1b and 4a), floor of the middle cranial fossa (5 of 13) (Figures 1a and 2b), external auditory canal wall (3 of 13) and auditory ossicles (3 of 13). The contrast CT scans of two patients revealed moderate enhancement of the soft-tissue mass.
On MRI, the soft-tissue masses appeared isointense to slightly hypointense on T1-weighted sequences (Figure 3a and 3b) and isointense to slightly hyperintense on T2-weighted sequences (Figure 3c and 3d). The signal was homogeneous in seven cases and inhomogeneous in six cases, with small areas of hypointensity present in both T1-weighted and T2-weighted images. After contrast was added, the lesions were moderately and homogeneously enhanced in seven cases and inhomogeneously enhanced (i.e. containing small, non-enhanced areas) in six cases (Figure 3e and 3f).
Computed tomography and MRI scans showed vascular involvement of the jugular bulb in nine cases, and of the internal carotid artery in five cases. Bone destruction of the carotid canal and jugular fossa was best detected by CT (Figures 1b, 1c and 4a). Magnetic resonance images delineated involvement of the internal carotid artery and jugular bulb in the disease process, either by demonstrating an enhanced tumour adjacent to a signal flow void of the carotid artery, or by showing no flow enhancement at the jugular bulb or sigmoid sinus (Figure 4b to 4d). Magnetic resonance imaging was better than CT for the evaluation of patency, obstruction and encasement of the carotid, jugular and dural sinuses. Computed tomography was better for detecting bone erosion of the middle fossa in five cases, while soft-tissue mass extension into the middle fossa was best observed on post-contrast MR images. Parotid infiltration was present for 2 of the 13 patients (Figure 3), and was observed on axial and coronal MRI scans and on soft-tissue window CT scans of the parotid gland. In one patient, temporomandibular joint fossa erosion, without destruction of the mandibular condylar head, was seen on both CT and MR images. Soft-tissue tumour extension into the joint space was seen especially well on post-contrast MR images (Figure 3).
Imaging of a primary middle-ear carcinoma involving the internal carotid artery. (a) Axial, high-resolution computed tomography scan demonstrating bone destruction of the carotid artery canal (thin arrow), with intact bone cortex on the normal contralateral side (thick arrow). (b) & (c) Axial, T1-weighted and T2-weighted magnetic resonance imaging (MRI) scans, respectively, showing disappearance of the flow void signal for the right carotid artery (thin arrow), with a normal flow void on the contralateral side (thick arrow). (d) Axial, contrast-enhanced MRI scan showing the enhancing tumour adjacent to the signal flow void of the carotid artery (thin arrow), and the normal carotid artery on the contralateral side (thick arrow).

Discussion
Primary middle-ear carcinoma is rare and accounts for less than 0.2 per cent of all head and neck malignancies.Reference Moody, Hirsch and Myers6 Squamous cell carcinoma is the most common histological type of middle-ear carcinoma; other types include adenocarcinoma, basal cell carcinoma and adenoid cystic carcinoma.Reference Gurgel, Karnell and Hansen1 Patients in their fifth to seventh decade of life are most often affected. The classical clinical presentation is otalgia and persistent ear drainage (often bloody) in the setting of chronic ear infection, while late clinical manifestations include facial palsy, deafness, vertigo, tinnitus and trismus.Reference Gurgel, Karnell and Hansen1, Reference Cristalli, Manciocco, Pichi, Marucci, Arcangeli and Telera4, Reference Gidley, Roberts and Sturgis7
Chronic infectious processes are common in the middle ear, and this may be one cause of otogenic tumours. Golding-Wood et al. have reported 11 patients with histories of longstanding aural discharge of durations ranging from 5 to 80 years, prior to tumour presentation.Reference Golding-Wood, Quiney and Cheesman8 In Conley's review of 20 cases, 55 per cent had a history of chronic recurring discharge, of a duration ranging from 10 to 50 years.Reference Conley9 In our study, we found that 92.3 per cent of patients had a history of chronic otitis media, lasting for between 5 months to 40 years; this supports the hypothesis that persistent inflammation and stimulation can induce the development of middle-ear carcinoma.
Primary middle-ear carcinoma mainly spreads by direct extension, and distant metastases are rare.Reference Yin, Ishikawa, Honda, Arakawa, Harabuchi and Nagabashi10 Tumours may grow upward through the tegmen tympani into the middle cranial fossa, anteriorly into the glenoid fossa and infratemporal space, inferiorly into the hypotympanum and jugular foramen, posteriorly to involve the mastoid air cells, and medially to involve the carotid canal. Neoplastic cells can also spread along the facial planes of the eustachian tube and involve the lateral nasopharynx. Interestingly, the erosion of auditory ossicles is not common, and in our study only three such cases were found. Among our patients, the most common site of bone destruction was the eustachian tube (nine cases). Ussmüller and Sanchez-Hanke investigated 20 cases of middle-ear carcinoma, and found that when the tumour is confined to the middle-ear area it can spread into the eustachian tube and, via infiltration into adjacent bone structures, into the tensor tympani muscle and the sympathetic plexus of the internal carotid artery.Reference Ussmüller and Sanchez-Hanke11 This suggests that the erosion of the eustachian tube might be an important clinical sign of primary middle-ear carcinoma.
• Primary middle-ear carcinoma is rare
• It spreads mainly through direct extension
• It may involve the middle cranial fossa, glenoid fossa and infratemporal space, jugular foramen, carotid canal, and mastoid air cells
• This study assessed 13 patients' computed tomography and magnetic resonance images
• Eustachian tube erosion was closely related to tumour onset
In our study, erosion of the jugular fossa was also common (nine cases); thus, the differential diagnosis of primary middle-ear carcinoma should include glomus jugulo-tympanicum. Typical glomus jugulo-tympanicum appears hyperintense on T2-weighted images and shows a characteristic ‘salt and pepper’ pattern on MRI. After the addition of contrast, the lesion will become significantly enhanced and there will be a vessel flow void visible.Reference Paniagua Escudero, de la Mano González and Asensio Calle12, Reference van den Berg13 Primary middle-ear carcinoma exhibits a more uniform signal on T1- and T2-weighted images, and has more moderate homogeneous enhancement than glomus jugulo-tympanicum. In the current study, small areas of low-signal foci on T1- and T2-weighted images were seen in a small number of tumours, which could easily have been confused with the ‘salt and pepper’ sign. However, on CT scans these areas appeared as high-density (i.e. probably representing calcification or ossification); thus, we were able to distinguish these areas from blood vessel signal flow voids.
High-resolution CT of the temporal bone offers the most accurate method for evaluation of bone erosion due to primary middle-ear carcinoma. However, a reported limitation of CT is its difficulty in distinguishing between mucosal thickening and tumour in the absence of bone erosion. Magnetic resonance imaging can provide excellent differentiation between soft-tissue tumour margin, muscle and soft-tissue infiltration, and can help distinguish tumour from obstructive inflammatory changes. In addition, obstruction of the sigmoid sinus and encasement of the petrous internal carotid artery are better detected on MRI than CT, because of the vascular signal void seen on pre-contrast MRI and the flow enhancement of the sigmoid sinus seen on post-contrast MRI.