


1. INTRODUCTION
The Antarctic Peninsula (AP) and the sub-Antarctic islands around its northern tip represent a large glacierized area with numerous glaciers and ice caps outside the Antarctic ice sheet. Most of these glaciers are considered to be in retreat and losing mass, but available glaciological observations are sparse and regionally biased. Changes in length, area, volume or mass were determined only for fraction of the local glaciers, and the AP is ranked among poorly sampled regions (Mernild and others, Reference Mernild, Lipscomb, Bahr, Radić and Zemp2013; Zemp and others, Reference Zemp2015). Most regional studies of glacier volume/mass changes have used topographic elevation data derived from stereoscopic aerial photographs (Rivera and others, Reference Rivera2005b; Molina and others, Reference Molina, Navarro, Calvet, García-Sellés and Lapazaran2007; Engel and others, Reference Engel, Nývlt and Láska2012; Kunz and others, Reference Kunz2012; Osmanoğlu and others, Reference Osmanoğlu, Navarro, Hock, Braun and Corcuera2014; Pętlicki and others, Reference Pętlicki, Sziło, MacDonell, Vivero and Bialik2017) and satellite imagery (Rückamp and others, Reference Rückamp, Braun, Suckro and Blindow2011; Davies and others, Reference Davies, Carrivick, Glasser, Hambrey and Smellie2012; da Rosa and others, Reference da Rosa2015; Fieber and others, Reference Fieber2018), both of which have limited vertical resolution and time coverage. Since the beginning of 21st century, in situ glaciological monitoring programmes have been initiated to determine the mass balance of small ice caps and glaciers around the AP. In summer 1999–2000, mass-balance measurements started on Bahía del Diablo Glacier on Vega Island on the eastern side of the AP (Fig. 1), with data having been reported to the World Glacier Monitoring Service (WGMS). Additional monitoring programmes were initiated on Livingston Island (Navarro and others, Reference Navarro, Jonsell, Corcuera and Martín-Español2013) and King George Island (e.g., Sobota and others, Reference Sobota, Kejna and Araźny2015; Mavlyudov, Reference Mavlyudov and Kotlyakov2016), South Shetland Islands (SSI), ~130 km north-west of the northern tip of the AP. Recently, a surface mass-balance (SMB) record has been reported for small glaciers on James Ross Island (JRI) on the eastern side of the AP (Engel and others, Reference Engel, Láska, Nývlt and Stachoň2018). Nevertheless, the WGMS database contains mass-balance data only for three glaciers from the AP region.
Location of glaciers (medium grey) and investigated ice caps (dark grey) on Lachman Crags in the northern part of James Ross Island. The inset shows the location of the study area in the north-eastern part of the Antarctic Peninsula.

The AP belongs to the regions that experienced the largest atmospheric warming on Earth over the second half of 20th century. The mean annual air temperature increased by ~0.5°C/decade around the AP (Turner and others, Reference Turner2005), causing the collapse of ice shelves along its western and north-eastern coast (Cook and Vaughan, Reference Cook and Vaughan2010) and accelerating the retreat of glaciers (Davies and others, Reference Davies, Carrivick, Glasser, Hambrey and Smellie2012; Scambos and others, Reference Scambos2014) and ice sheets (Wouters and others, Reference Wouters2015). The temperature increase decelerated at the beginning of the new millennium as indicated by a significant decrease in the warming trends reported from the AP region (e.g., Turner and others, Reference Turner2016). Recent analyses of temperature records from JRI (Ambrožová and Láska, Reference Ambrožová, Láska and Nováček2016) and the northern AP (Oliva and others, Reference Oliva2017) have even shown that the regional warming trend turned to a cooling during 1999–2015. The response of glaciers to the change in the temperature trend has been observed in the northern part of the AP (Oliva and others, Reference Oliva2017 and references therein) but the timing of the shift from predominantly negative annual SMB to mass gains remains unclear. The first indication of the change in the mass-balance trends over the northern AP was reported by Navarro and others (Reference Navarro, Jonsell, Corcuera and Martín-Español2013) for Hurd and Johnsons glaciers on Livingston Island (SSI) for the mass-balance year 2008. A later onset of the net mass gain was observed subsequently in the glaciological record for Bellingshausen Ice Dome on King George Island (SSI), which experienced a positive annual SMB in 2010 (Mavlyudov, Reference Mavlyudov2014). The later timing of the shift was proved by the mass-balance dataset for Bahía del Diablo Glacier on Vega Island (Marinsek and Ermolin, Reference Marinsek and Ermolin2015), which represents the north-eastern part of the AP. The recently published data from Whisky or Lookalike Glacier (cf. CGS, 2009; SCAR, 2019) and Davies Dome on JRI (Fig. 1) have confirmed predominantly positive annual SMB since the mass-balance year 2010 (Engel and others, Reference Engel, Láska, Nývlt and Stachoň2018) but the time coverage of the data precludes the determination of a possible earlier shift in the mass-balance trend.
In order to determine the possible earlier initiation of the annual mass gain on JRI, we analyse the 1979 and 2006 digital elevation models (DEMs) and the Ice Cloud and Land Elevation Satellite (ICESat) data. The satellite altimetry data provide the information on the surface elevation changes of the IJR-41 ice cap on Lachman Crags (LC) plateau in the northern part of JRI (Fig. 1) over the period 2003–2008. The DEMs based on 1979 and 2006 aerial photographs collected by the British Antarctic Survey (BAS) allow us to analyse the surface elevation changes on this ice cap back to 1979. Moreover, we use the ICESat data, DEMs and static Differential Global Navigation Satellite System (DGNSS) measurement for ICESat ground tracks to access the recent trends in the surface elevation changes on the ice cap. Finally, we determine glacier ice thickness along ICESat tracks using the ground penetrating radar (GPR) and we estimate the time of complete ice decay based on the ice thickness data and observed the rate of glacier surface lowering.
2. STUDY AREA
JRI is situated on the eastern flank of the northern part of the AP. The island extends between 63°46′ and 64°27′S, and reaches 1600 m at the summit of Mount Haddington. The glacial cover of JRI consists of the Mount Haddington ice cap, minor ice caps and outlets at its periphery and small individual glaciers on the Ulu Peninsula in the northern part of the island. The surface of the peninsula is distinguished by cliff-bounded plateaux landforms rising up to ~600 m a.s.l. The prominent flat-topped forms (mesas) are controlled by the bedrock geology, with the late Neogene basalt lava flows forming resistant caps on a Cretaceous sedimentary strata (Hambrey and others, Reference Hambrey, Smellie, Nelson and Johnson2008). These mesas are interpreted as the remnants of voluminous lava-fed deltas sourced from a vent at Mount Haddington stratovolcano (Smellie and others, Reference Smellie2008). The LC consists of the thickest lava caprock of any delta on JRI (Smellie and others, Reference Smellie2008), and it dominates the landscape of the north-eastern part of the Ulu Peninsula (Figs 1, 2).
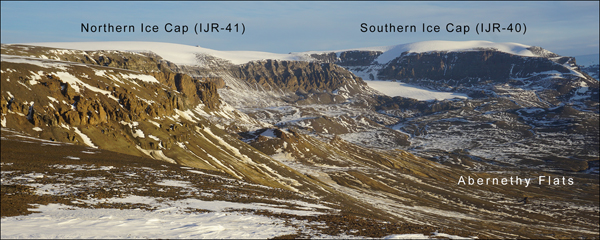
View of the western side of Lachman Crags from the north-west. Photograph taken on 10 March 2018 from the southern tip of Johnson Mesa.
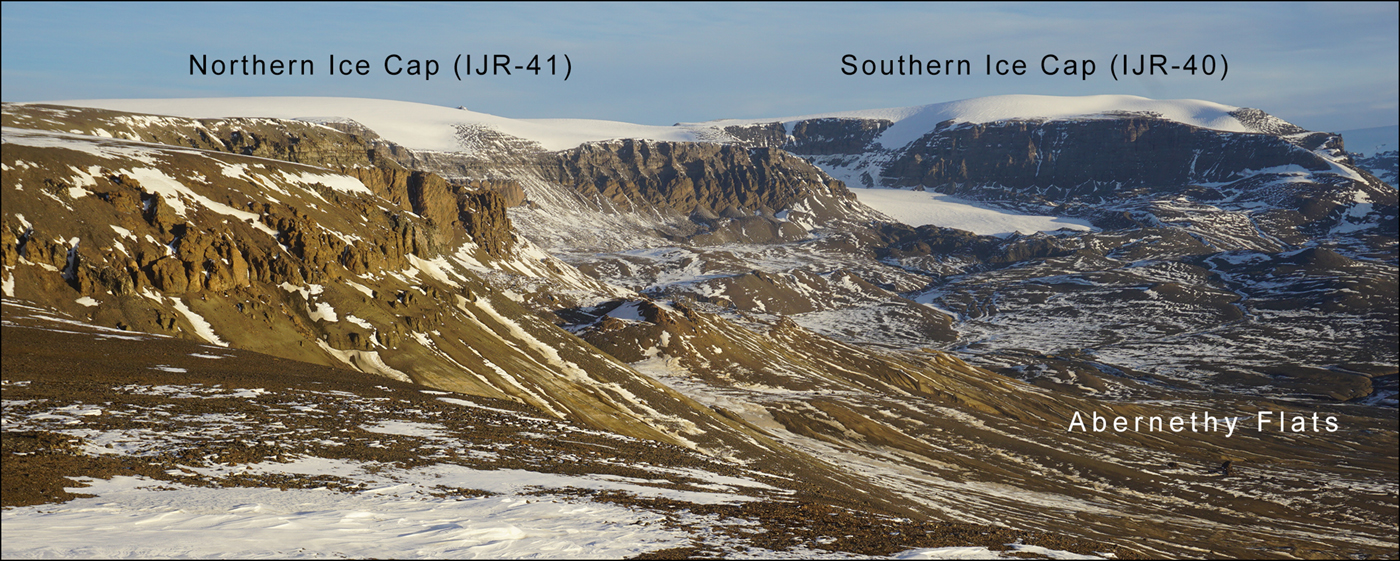
The western side of LC borders low-angle slopes to the Abernethy Flats rising from ~30 to 380–600 m a.s.l. (Fig. 2). This side is mantled with extensive scree and numerous protalus ramparts that are missing only in sections where two small glaciers descend from the steep cliffs of LC. Scree slopes and protalus ramparts are also formed along the north-western face of LC, east of two abandoned cirques with a steep headwall and overdeepened basins. The eastern and southern face of LC is distinctly different from the western slopes. The straight margin of the LC is sharply delimited by vertical cliffs, which increase in height towards the south from ~ 130 to 300 m. Perennial snow banks and protalus ramparts lie at the foot of a lower northern section of the face, while large mass movement blocks, glaciers and rock glaciers dominate along the higher part of LC. The mass movement blocks separated from the mesa form chaotic hummocky terrain that descends in steps to the seashore.
The surface of LC is inclined to the north, descending from 600 m a.s.l. at its southern tip to 380 m a.s.l. at the northern end. The northern part of the mesa (380–430 m a.s.l.) is ice-free and its flat surface is covered with blockfields and sorted polygon nets. Seasonal snow cover is effectively transported from its surface by the prevailing south-westerly winds (Hrbáček and others, Reference Hrbáček, Láska and Engel2016), feeding perennial snow fields and glaciers in the lee-side of the mesa. Two ice caps cover the southern part of LC (Fig. 2). A larger ice cap (referred as IJR-41 in the inventory by Rabassa and others, Reference Rabassa, Skvarca, Bertani and Mazzoni1982) is elongated in the NNE direction being 2.8 km long (63°51′34″–63°53′2″S, 57°49′17″–57°52′29″W) and having an area of 2.7 km2. A prominent south-west facing outlet drains the central part of the IJR-41 ice cap with a flat top at 571 m a.s.l. This outlet joins a small glacier snout, which forms a large cirque between the IJR-41 and IJR-40 ice caps. The snout flows towards north-west and terminates at the elevation of 196 m a.s.l. A smaller IJR-40 ice cap with an area of 0.9 km2 covers the southernmost part of LC (63°53′2″–63°53′31″S, 57°50′40″–57°52′50″W). It is located at the elevation of 470–649 m a.s.l. and its 2.3 km long axis has the ENE direction. Both ice caps represent an accumulation area of small stagnant glaciers, which are located below the eastern face of the mesa. These glaciers are detached from the ice caps and thus gain mass due to the snowdrift from the ice caps by winds. San José and Lachman (IJR-38) glaciers at the foot of the southern face of LC and Triangular glacier in its western slope are less influenced by the wind-driven snow redistribution.
The climate of JRI is influenced by the 1000–1800 m high orographic barrier of the AP (King and others, Reference King, Turner, Marshall, Connolley, Lachlan-Cope, Domack, Leventer, Burnett, Bindschadler, Convey and Kirby2003) and the Southern Annular Mode (Marshall and others, Reference Marshall, Orr, van Lipzig and King2006). A positive trend in this annular mode increases north-westerly air flow over the AP and amplifies warming on the eastern side of the AP due to the föhn effect (Grosvenor and others, Reference Grosvenor, King, Choularton and Lachlan-Cope2014). The mean annual air temperatures (2005–15) in the northern part of JRI range from −7.0°C at the sea level (Mendel Base, 10 m a.s.l.) to lower than −8.0°C (Bibby Hill, 375 m a.s.l.) in higher-elevated regions (Ambrožová and Láska, Reference Ambrožová, Láska and Nováček2016). Positive air temperatures over the short summer season (2–3 months) cause snow and ice to melt on glaciers, these effects vary strongly in response to cloudiness and solar radiation. The modelled annual precipitation is estimated between 200 and 500 mm w.e. (van Lipzig and others, Reference van Lipzig, King, Lachlan-Cope and van den Broeke2004). Since the mid-20th century, snowfall and summer melt intensity has significantly increased (Abram and others, Reference Abram2013; Medley and Thomas, Reference Medley and Thomas2019).
3. DATA AND METHODS
The BAS aerial photographs taken in 1979 and 2006 and WorldView-2 images from 2016 (Table 1) were used to extract information for an extent of investigated glaciers. The aerial photograph-based DEMs produced by the GEODIS company (the Czech Republic) were used to estimate ice elevations and thinning rates over the glacier surface between 1979 and 2006. The dataset has rms errors of 2.0 m in both the horizontal and vertical directions (1979) and 0.7 m horizontally and 0.8 m vertically (2006), respectively (Meixner, Reference Meixner2009). The accuracy of DEMs derived by stereo-processing over glaciers often suffers from a lack of surface patterns resulting in poor quality elevation information (Rivera and others, Reference Rivera, Casassa, Bamber and Kääb2005a). We checked the original aerial photographs and found sufficient surface-patterned textures on the glacier surface. We thus assume that the DEM quality over glaciers is not lower than over the rest of the dataset. Surface elevation changes and annual thinning rates after 2006 were calculated using the 2006 DEM and the Reference Elevation Model of Antarctica (REMA) created by the Polar Geospatial Center (PGC, 2018). REMA was constructed from high-resolution (~0.5 m) stereoscopic imagery collected by DigitalGlobe, Inc. constellation of optical imaging satellites (PGC, 2018). This model portrays first-return elevation values that reflect temporally variable conditions such as snow cover. Snow depth records and field observations on the Ulu Peninsula indicate irregular distribution of snow cover, with a maximum depth of fresh snow ranging from 0.3 m at the sea level (Hrbáček and others, Reference Hrbáček, Láska and Engel2016) to ~0.6 m on glaciers. The effect of variable snow depth on the accuracy of the DEMs cannot be excluded but it remains on the order of magnitude lower than vertical uncertainty of DEM-derived elevation values. Glacier-elevation changes on the flat top surface of IJR-41 ice cap were estimated in more detail using the available DEMs, ICESat data acquired during the period 2003–2008 and in situ DGNSS measurements from 2018.
Summary of remote-sensing data

The ground track of ICESat satellite crosses LC providing elevation measurements of land surface above the TOPEX-Poseidon ellipsoid along the satellite ground track each 172 m. Each point measurement corresponds to a footprint with 70 m in diameter. Due to energy management constraints, the laser was on during limited periods only, mainly in March, May and October. The ground tracks are fixed but single flyovers do not follow exactly the same line on the surface. In order to derive the change in ice surface elevation for small glaciers, ICESat elevations are related to a static elevation reference such as SRTM DEM (e.g., Gardner and others, Reference Gardner2013; Neckel and others, Reference Neckel, Kropáček, Bolch and Hochschild2014). We used the static DGNSS measurements at the ICESat footprints as a reference that increases the accuracy of the determined elevation compared with the DEM reference (Kropáček and others, Reference Kropáček, Neckel and Bauder2014). We used the geodetic records of GLA14 product release 34. The surface elevation was determined at 72 individual locations spread along six ICESat ground tracks over ~2 km on the ice dome. Erroneous measurements due to clouds were identified by the elevation threshold of 100 m and removed.
DGNSS technology was applied to determine the contemporary ice surface elevation for the ICESat ground tracks. The data for 72 points were collected during a field campaign in January 2018 using a Trimble Geo7X roving station (Trimble Navigation Limited, 2013). The reading lasted 3 min at each site to obtain centimetre accuracy after post-processing. The coordinate points were corrected in relation to the base station mounted on a stable surface near the J.G. Mendel Czech Antarctic Station (63°48′S; 57°53′W) and the correction data acquired by the German Antarctic Receiving Station at the Chilean station General Bernardo O'Higgins (63°19′S; 57°54′W). The data collected on LC ice cap were post-processed for differential correction using the Trimble GPS Pathfinder Office software.
GPR was used to determine the ice thickness for ground tracks (55 points) of ICESat on IJR-41 ice cap. The GPR data were collected in February 2017 along five parallel profiles on the dome (Fig. 3). GPR profiling was carried out using an unshielded 50 MHz Rough Terrain Antenna and RAMAC CU-II control unit (MALÅ GeoScience, 2005). The scan spacing was set to 0.1 s and the GPR was man-hauled at a mean speed of ~3 km h−1, yielding one radar trace every ~0.01 m. A Garmin GPSMAP 60CSx receiver (Garmin International, 2007) was used to determine the coordinates for the corresponding trace numbers with the horizontal position accuracy <5 m. The GPR data were processed and interpreted using the ReflexW software version 8.5 (Sandmeier, Reference Sandmeier2017). Two-way travel times to depths were converted assuming a radio-wave velocity of 168 m µs–1 reported by Narod and Clarke (Reference Narod and Clarke1994) for cold glacier ice. The raw GPR profiles were filtered using an automatic gain function (AGC-Gain), background removal and static (topographic) correction. The glacier bed was selected on radargrams by a phase follower tool in ReflexW. The automatic assignment of picks was controlled and eventually redirected to the desired phase at the glacier bed. The picks were collected only for the bed reflections that can be clearly identified in the radargrams.
Ground tracks of ICESat (red crosses) and GPR profiles (green lines) on the flat-topped surface of IJR- 41 ice cap superimposed on an aerial photography acquired in February 2006. Light and dark blue lines represent the glacierized area in 1979 and 2017, respectively.

The uncertainty of ice thickness determined for ICESat points was estimated following the approach proposed by Lapazaran and others (Reference Lapazaran, Otero, Martín-Español and Navarro2016), who describes the error in thickness (i) retrieved from the GPR measurement and (ii) due to the incorrect horizontal positioning of the measurement point. For the calculations of the first uncertainty component, we considered a conservative estimate of vertical resolution (a half of the signal's wavelength in ice, i.e. 1.68 m for the 50 MHz antenna) and a relative error in radio-wave velocity of 2.4%, which corresponds to a range of velocity values from 166 to 170 m µs–1. We chose this relatively narrow range since we anticipated only minor variations in ice and snow characteristics (density, water/air content) on the investigated part of LC ice cap (500–570 m a.s.l.). The positioning-related ice-thickness error was determined from the variability of ice thickness along and across the profiling direction. Taking into account that the radar traces were positioned using uncorrected GPS data, we evaluated the maximum absolute value of the differences between the value at the ICESat point and the neighbouring values within a circle with a radius of 5 m. The variability of ice thickness along and across the profiling direction was calculated from the values picked for radar traces and interpolated between GPR profiles, respectively.
4. RESULTS
The area and ice-surface elevation changes determined for the investigated glaciers are given in Table 2. A single ice cap with the area of 4.337 ± 0.037 km2 covered LC in 1979. Its surface decreased significantly before 2006, losing 17.4% of its area. Assuming a constant rate of change, the ice cap therefore lost 0.029 km2 a–1 during the period 1979–2006. Most of the measured areal loss occurred at the southern part of LC at 450–600 m a.s.l. (Fig. 3). As a result, ice cover on LC diverged on two separate ice caps with the area of 2.709 ± 0.009 and 0.872 ± 0.004 km2 on the central and southern parts of LC, respectively. From 2006 to 2016, the surface area of the larger of the two ice caps (IJR-41) remained almost the same. The glacier decreased to 2.674 ± 0.031 km2, losing only 1.3% of its area at a mean rate of 0.003 km2 a–1. By contrast, the surface area of IJR-40 increased to 0.922 ± 0.015 km2 over the same period, gaining 5.8% of its area at a mean rate of 0.005 km2 a–1.
Changes of surface area and elevation of ice caps on Lachman Crags since January 1979

* Mean elevation determined for 2015 (PGC, 2018).
The glacierized area on LC has experienced only minor surface elevation changes since 1979. The surface lowering observed along western margin of the glaciers was partly compensated by an increase in surface elevation above 560 m. Between 1979 and 2006, the mean surface elevation of IJR-41 ice cap decreased by 7.3 ± 2.2 m, at a mean rate of −0.28 m a–1 (Table 2). By contrast, the mean surface elevation of IJR-40 ice cap increased by 5.6 ± 2.2 m, with a mean rate of 0.21 m a–1. The discrepancy in surface elevation changes may be attributed to the recession of the lower-elevated periphery of IJR-40 ice cap and more prominent accumulation on its upper part that is situated ~70 m higher than the top of IJR-41. Both ice caps experienced an increase in surface elevation over the period 2006–2015. Mean surface elevations of IJR-41 and IJR-40 ice caps increased on average by 3.9 ± 0.8 and 1.2 ± 0.8 m, respectively. On average, mean surface elevations increased at a rate of 0.43 and 0.13 m a–1.
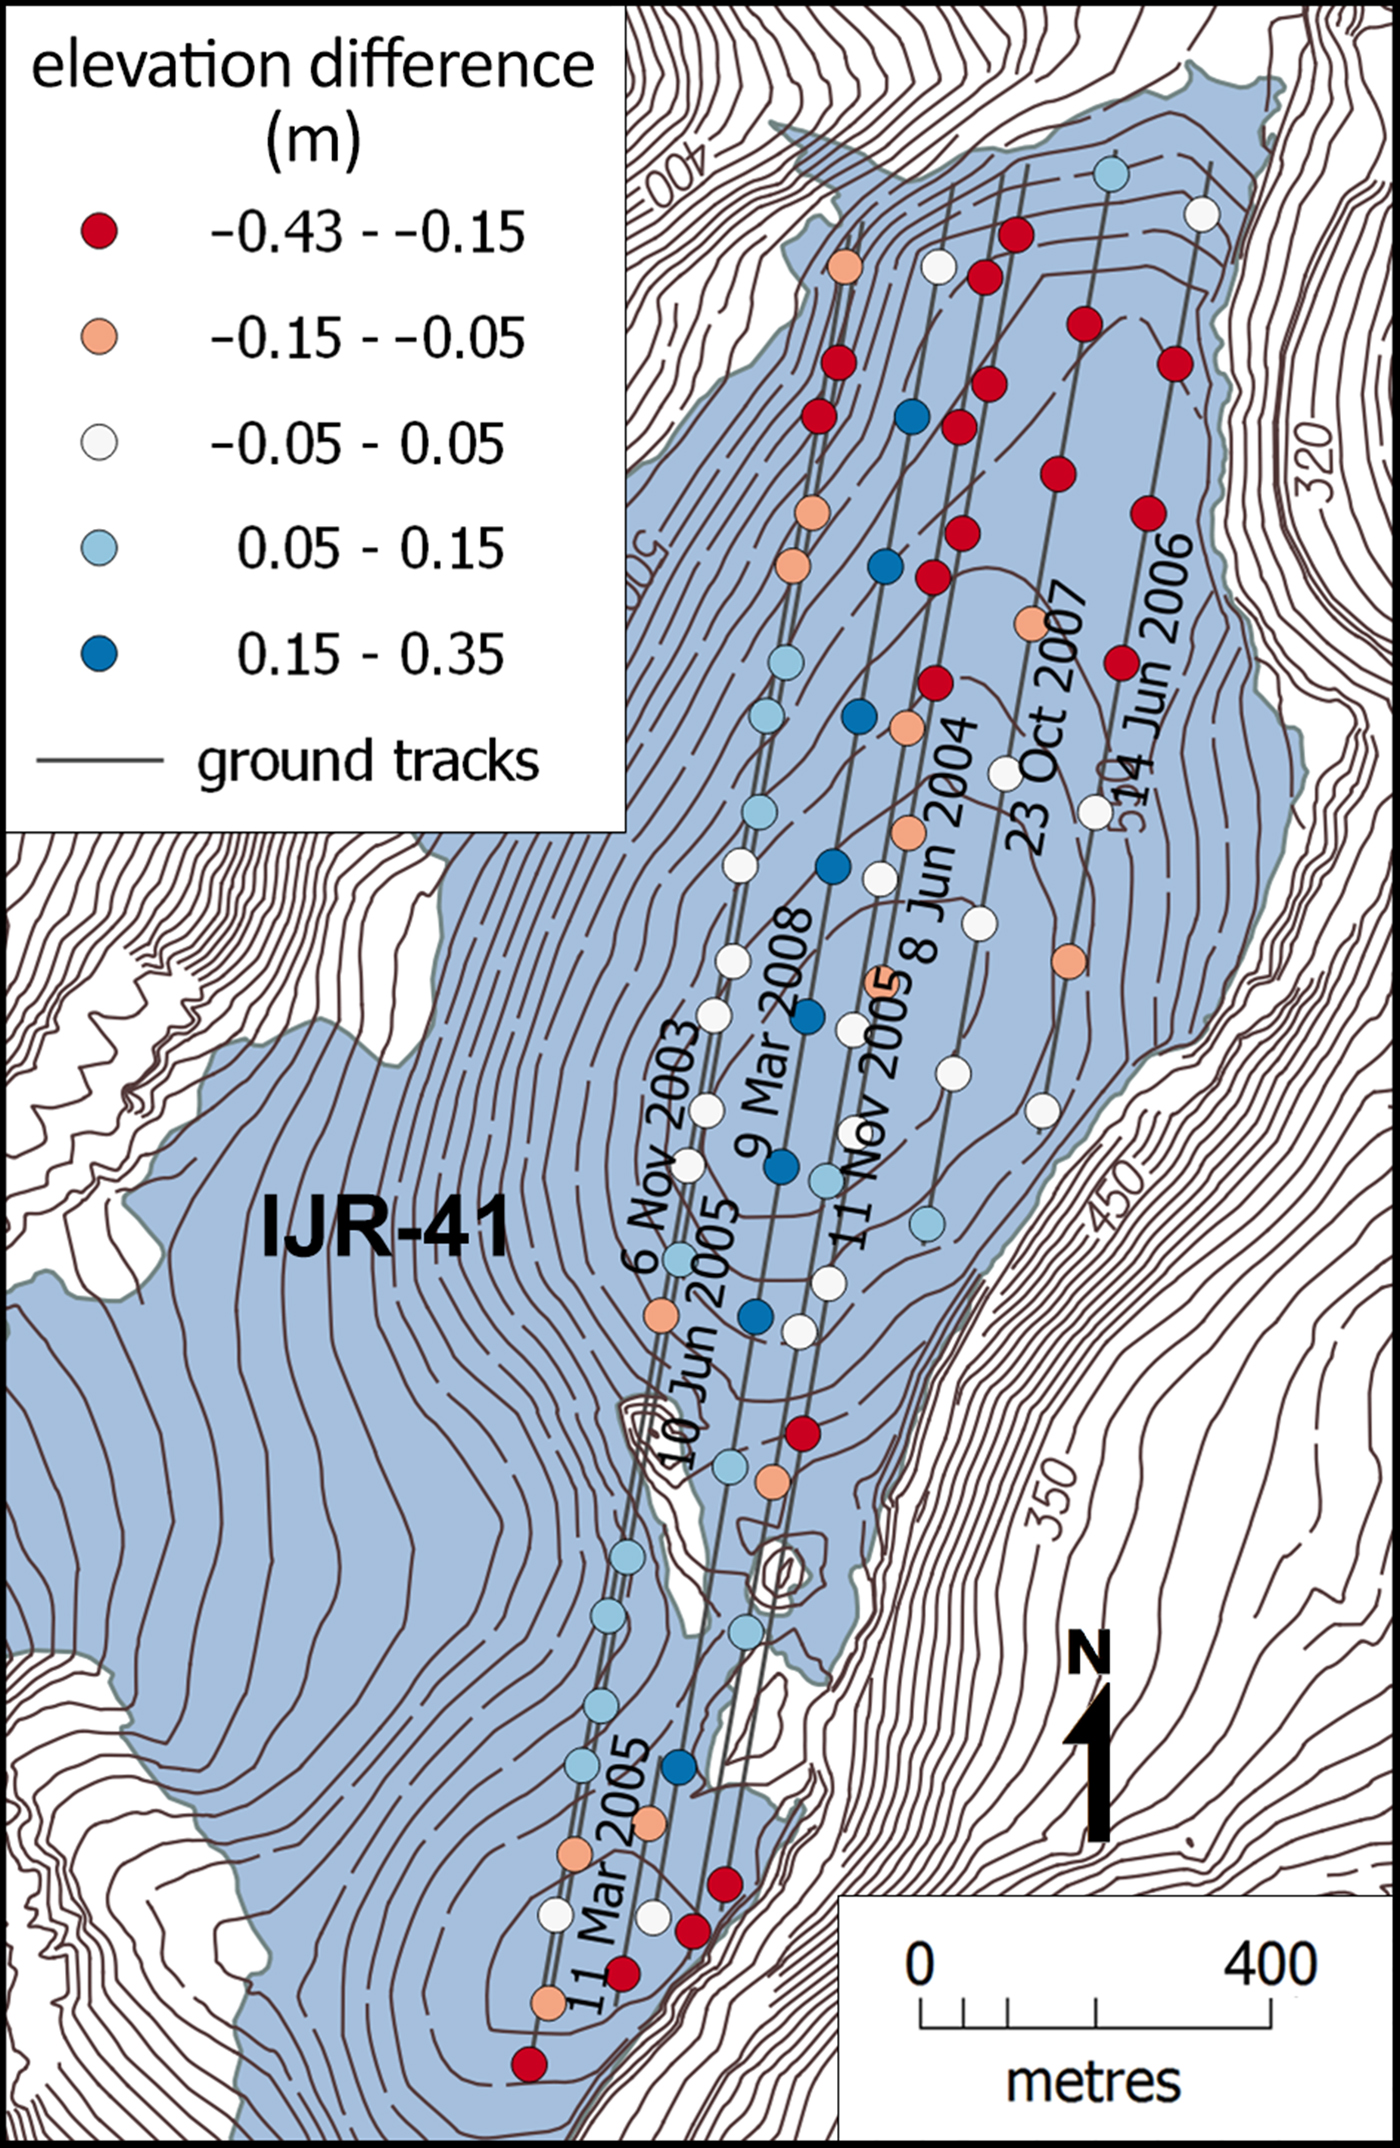
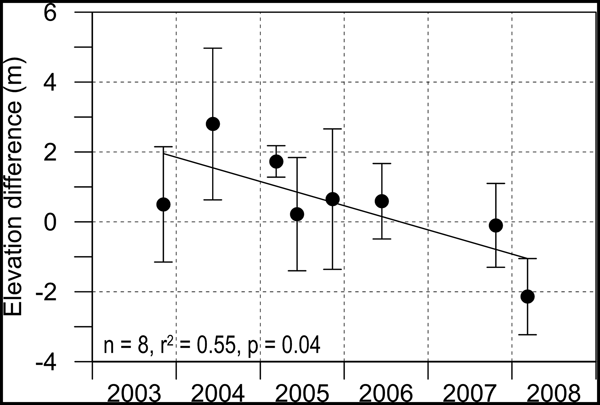
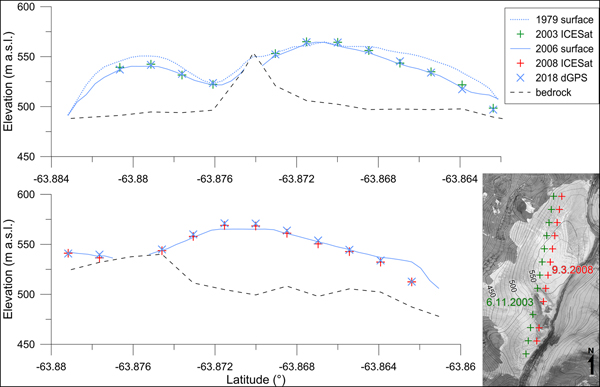
The elevation data determined at 72 individual ICESat points document surface elevation changes on the flat top part of IJR-41 ice cap over the period 1979–2018 (Table 3). The mean surface elevation of the dome decreased by 4.0 m between 1979 and 2006 at a mean lowering rate of −0.1 m a–1. Only the highest part of the dome (26 out of 72 ICESat points) experienced an increase in surface elevation by 3.7 m on average over this period. From 2006 to 2015, the surface elevation of the dome increased on average by 4.0 m (a mean rate of 0.4 m a–1) with an increase observed at 63 points. Since 2015, the dome surface has returned to the lowering trend, which is recorded at all points. From 2015 to 2018, the surface elevation of the dome decreased by 3.7 m at a mean rate of −1.2 m a–1. The surface lowering prevailed on the dome over most of the 1979–2018 as indicated by a net mean decrease value of 3.7 m and a mean lowering rate of −0.1 m a–1. The decreasing trend was also confirmed for the period 2003–2008 based on the ICESat data (Table 4 and Fig. 4). An overall increase in surface elevation was restricted only to the highest part of the dome (Fig. 5).
Median elevation difference of the ICESat tracks with respect to the DGNSS reference.

Median annual difference of ice surface elevation between the ICESat data (2003–2008) and DGNSS (2018) measurements.
Summary of elevation data and ice thickness at ICESat points. A dash indicates unknown ice thickness at points that were not covered with GPR survey. The decay time of ice is determined from the surface-lowering trend observed during the period 1979–2018 (Trend 1) and 2015–2018 (Trend 2)

List of ICESat ground tracks showing the difference of ICESat elevations with respect to the DGNSS measurements from 2018 as median value for each track

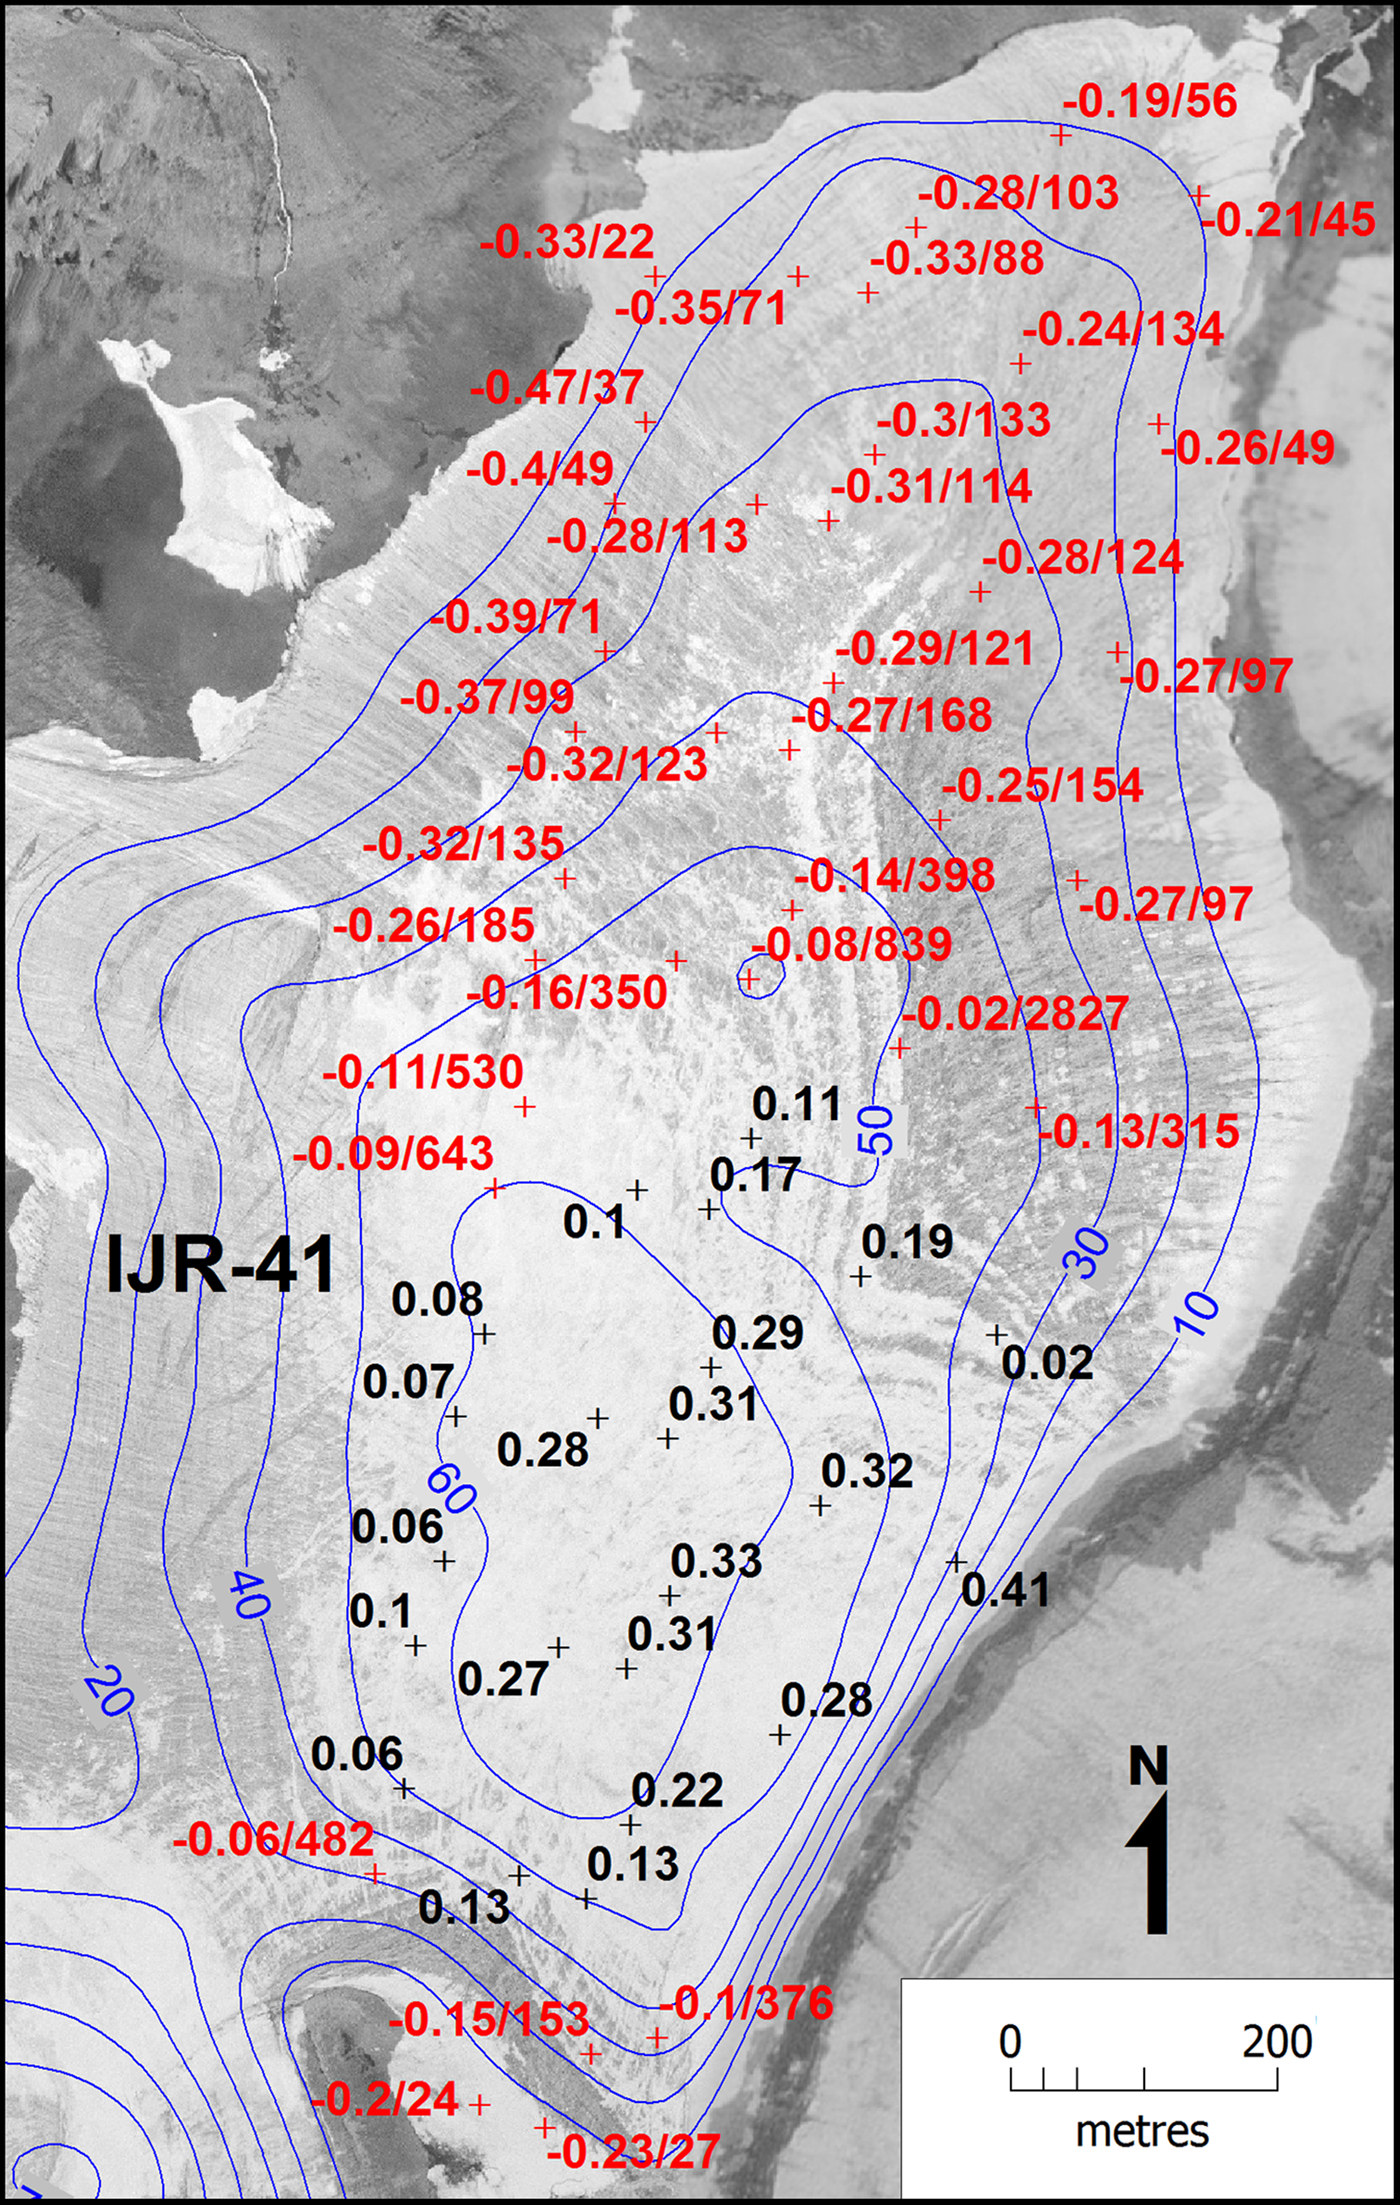
The mean glacier ice thickness for 55 points on the flat top surface of IJR-41 ice cap is 43.1 ± 1.7 m (Table 3). The greatest thickness was observed on the highest part of the dome, where the glacier ice was as much as 71.4 ± 2.1 m thick. The ice thickness decreases slowly towards the northern glacier margin, which terminates on the slightly inclined bedrock at the central part of the LC mesa (Figs 6, 7). The thickness decreases more abruptly in the southern part of the dome where steep bedrock outcrops protrude above ice surface (Fig. 6). In the west-east direction, greater ice thickness values (up to 60 m) were recorded along the western ICESat ground tracks. This part of the dome represents a source area for two lobes that descend towards the western margin of the ice cap. The ice thickness ranges from 10 to 40 m along the eastern margin of the dome, which forms an ice-cliff above the basalt and hyaloclastite eastern face of LC. The uncertainties in the ice-thickness values related to the GPR measurement and trace-positioning range from 0.22 to 1.70 m and from 0.42 to 2.84 m, respectively. The total uncertainties range between 0.93 and 2.89 m, with a mean value of 1.71 m and a std dev. of 0.44 m.
Glacier-surface elevation changes derived from the DEMs, ICESat data and DGNSS measurement on IJR-41 ice cap. The vertical axis is exaggerated by a factor of 4.

Ice thickness (blue lines) on the dome and glacier-surface elevation changes (m a–1) at ICESat points (red crosses) over the period 1979–2018. Black figures show the increase in surface elevation while red values indicate surface lowering and years to complete ice melt based on the averaged lowering rates over this period.
5. DISCUSSION
The decrease in the surface area of the ice caps on LC over the 1979–2006 period is within the range of values reported by Engel and others (Reference Engel, Nývlt and Láska2012) for small glaciers in the northern part of JRI. The areal loss of 21.9 and 15.9% observed on IJR-40 and IJR-41 ice caps, respectively, coincides with the 22.1% decrease of Davies Dome surface area (Engel and others, Reference Engel, Nývlt and Láska2012). These values are higher than the 10.6% loss reported by Engel and others (Reference Engel, Nývlt and Láska2012) for Whisky Glacier, which suggests a more rapid retreat of ice caps than cold-based valley glaciers in this region. This implies higher sensitivity of small ice caps to regional climate settings and local meteorological conditions (e.g., Nesje and others, Reference Nesje, Bakke, Dahl, Lie and Matthews2008; Zekollari and others, Reference Zekollari, Huybrechts, Noël, van de Berg and van den Broeke2017). The recession of the ice caps in the northern part of JRI is less prominent compared with Subantarctic (sensu Cogley and others, Reference Cogley, Berthier, Donoghue, Kargel, Leonard, Bishop, Kääb and Raup2014) ice caps and their outlets that experience up to an order of magnitude higher retreat and surface-lowering rates (Table 5).
Mean area and surface elevation changes of ice caps and outlet glaciers along the northern part of the Antarctic Peninsula
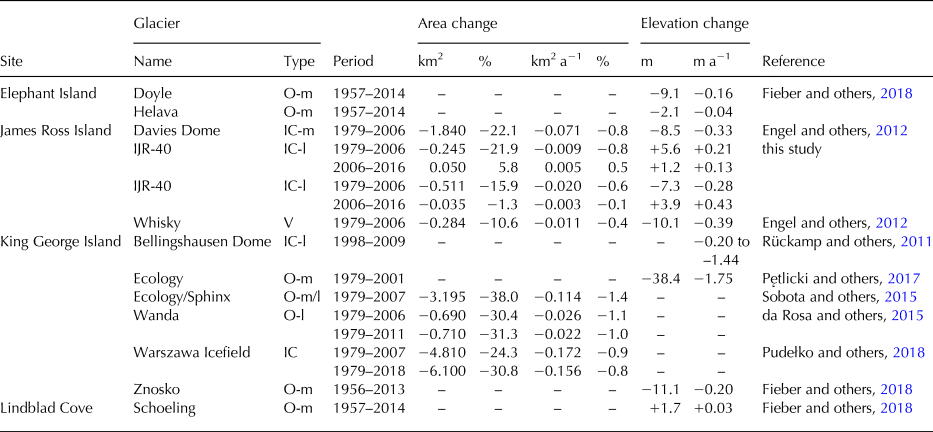
IC, ice cap; O, outlet; V, valley glacier; -l, land-terminating; -m, marine-terminating.
The deceleration of the retreat rate and the increase in surface elevation observed on the investigated ice caps during the 2006–2015 period correspond with the lowered glacier recession around the northern AP (Table 5). Positive mass-balance values recorded in this region since the glaciological year 2009/10 (Mavlyudov, Reference Mavlyudov and Kotlyakov2016; Engel and others, Reference Engel, Láska, Nývlt and Stachoň2018; WGMS, 2018) and the low rates of glacier recession in subsequent years (Pętlicki and others, Reference Pętlicki, Sziło, MacDonell, Vivero and Bialik2017; Pudełko and others, Reference Pudełko, Angiel, Potocki, Jędrejek and Kozak2018) have been attributed to the deceleration of the regional warming trend and the decrease in summer temperature (Navarro and others, Reference Navarro, Jonsell, Corcuera and Martín-Español2013; Lirio and others, Reference Lirio, Guaiquil, Leppe, Rojas and Canales2017; Oliva and others, Reference Oliva2017). The cooling trend in the northern AP has been recently confirmed by Ambrožová and Láska (Reference Ambrožová, Láska and Nováček2016), who found the most prominent decrease in air temperature (1.44°C/decade) over the period 2005–2015 in the northern part of JRI. Moreover, this re-assessment of the temperature records has revealed a significant decrease in summer temperature at AP meteorological stations including Mendel and Bibby Hill stations near LC.
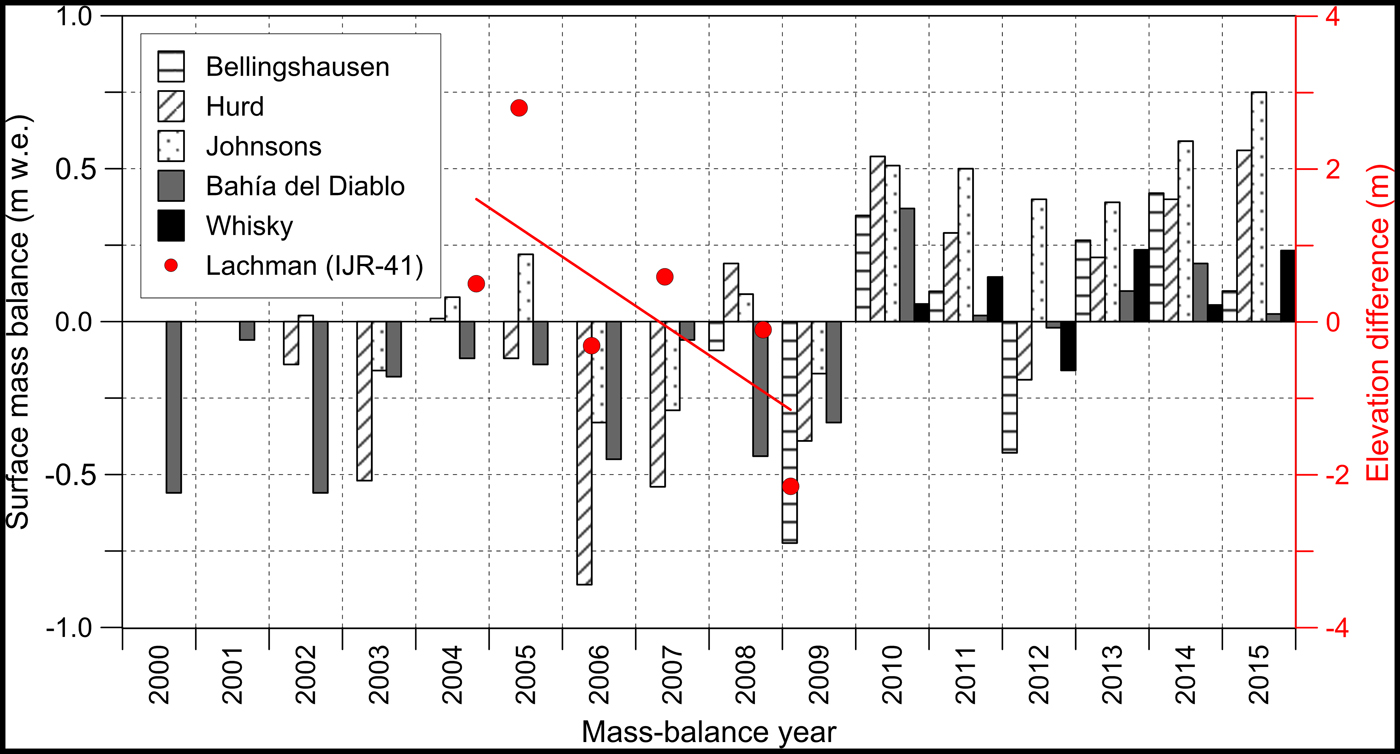
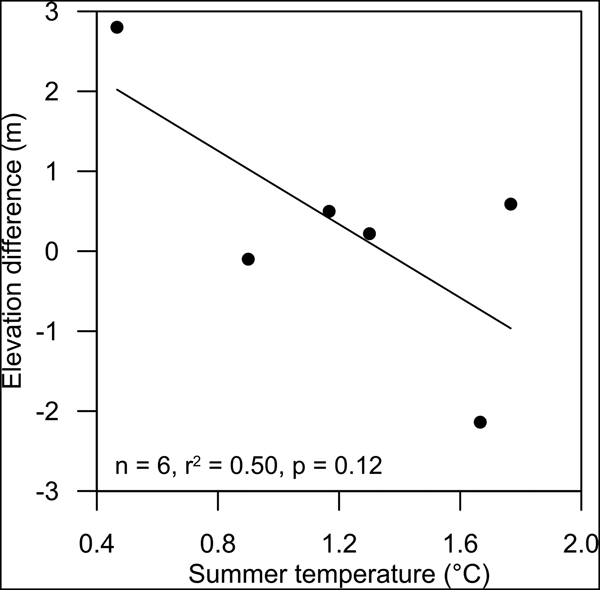
Although glaciers in the AP are influenced by a set of regional and local climatic conditions (e.g., Arigony-Neto and others, Reference Arigony-Neto, Kargel, Leonard, Bishop, Kääb and Raup2014), our results confirm the relationship between summer mean air temperatures and surface elevation changes reported by Skvarca and De Angelis (Reference Skvarca, De Angelis, Domack, Leventer, Burnett, Convey, Kirby and Bindschadler2003) for this region. Surface elevation changes on IJR-41 ice cap indicated by the ICESat data correlate with summer temperatures at Esperanza meteorological station during the period 2003–2008 (Fig. 8). The lowering trend observed on IJR-41 ice cap during the period 2003–2008 (Fig. 4) and surface elevation changes determined from the ICESat tracks measured in June 2006, October 2007 and March 2008 suggest that the glacier lost mass in the mass-balance year 2008. High temperatures recorded in the northern AP during the ablation season 2007/08, which has been the fifth warmest summer (with a mean summer air temperature of 1.7°C) on Esperanza since 1953 according to the Reference Antarctic Data for Environmental Research (READER) database (Turner and others, Reference Turner2004) supports this view. An increase in surface elevation on the dome in the mass-balance year 2009 cannot be excluded based on the ICESat data as the last available tracks represent the onset of this year. However, warm conditions during the ablation season 2008/09 (1.6°C on Esperanza; READER database) and negative SMB reported for the glaciers around the AP (Fig. 9) make this possibility improbable.
ICESat tracks/current glacier surface elevation difference vs mean summer (DJF) air temperature on Esperanza meteorological station during the period 2003–2008.

Surface lowering on IJR-41 ice cap (red dots) during the period 2003–2008 and a change from surface mass loss to mass gain after 2009 as indicated by the ICESat data and mass-balance records for glaciers in the northern part of the Antarctic Peninsula. The right axis indicates the elevation difference between ICESat tracks and current glacier surface. Data adopted from Mavlyudov (Reference Mavlyudov and Kotlyakov2016), Engel and others (Reference Engel, Láska, Nývlt and Stachoň2018), WGMS database (2018) and this study.
Based on the mean lowering rates and ice thickness determined for 55 points on IJR-41 ice cap, we calculate the time for the complete melting of glacier ice at these points. The melting time must be considered as a rough estimate because the approximation omits future changes in climate conditions and ice dynamics. In order to reflect recent temporal variability of the glacier evolution, we take into account the mean lowering rates for the periods 1979–2018 and 2015–2018. The surface elevation changes over a longer time span range from +0.41 m a–1 at the south-eastern part of the dome to −0.47 m a–1 near the north-western ice margin. The calculated ice decay times indicate that the periphery of the ice cap north of the small western outlet will disappear within decades (Fig. 7). The same evolution may be expected near the bedrock outcrops in the southern part of the dome. The melting time increases to centuries towards the central part of the dome that would gain mass under unchanged conditions. The accelerated lowering rates (−0.93 to −1.90 m a–1) observed over the period 2015–2018 reduce the time to complete ice decay roughly by an order of magnitude. If these rates are taken into account, even the highest part of the ice cap would disappear in 66 ± 19 years.
The future evolution of ice around the highest part of the dome approximately based on the mean lowering rate for the period 1979–2018 is consistent with the ice-decay estimates reported for glaciers of comparable area in the northern AP region. The estimated melting time of Whisky Glacier and Davies Dome on the Ulu Peninsula is 104 ± 5 and 228 ± 22 years, respectively (Engel and others, Reference Engel, Nývlt and Láska2012). Similarly, Bellingshausen Dome on SSI is predicted to disappear in 285 years if the present warming trend persists (Rückamp and others, Reference Rückamp, Braun, Suckro and Blindow2011). A total decay of IJR-41 ice cap within the next few decades estimated based on the accelerated lowering rate (2015–2018) seems to be unrealistic. A rapid ice-decay during this time span is predicted for small glaciers at low elevation that are located in regions affected by changes in regional atmospheric circulation. Simões and others (Reference Simões, Dani, Bremer, Aquino and Arigony-Neto2004) described these conditions on the SSI where small glaciers lost up to 83% of their area during the second half of the 20th century. Rapidly receding glaciers that are now close to decay were also reported from South Georgia (Gordon and others, Reference Gordon, Haynes and Hubbard2008) and the Kerguelen Islands (Berthier and others, Reference Berthier, Le Bris, Mabileau, Testut and Rémy2009).
6. CONCLUSIONS
The analyses of the DEMs, ICESat and DGNSS data revealed a predominant retreat of ice caps on LC since 1979. Between 1979 and 2006, the glacierized area decreased by 17.4% at a mean rate of 0.03 km2 a−1. The observed areal decrease, retreat rate and surface elevation change are in accordance with the values that represent glacier recession in the northern part of JRI, which are by an order of magnitude lower than the values reported for ice caps and outlets on the Subantarctic islands. The glacier retreat on LC decelerated during the period 2006–2016 when the area of IJR-41 ice cap decreased by 1.3% and IJR-40 experienced a 5.8% increase in the surface area. The reduced retreat is in line with the recent observations and mass-balance studies of glaciers around the northern AP that show a marked decrease in glacier recession and predominantly positive SMB since the mass-balance year 2009/10.
The ICESat data show that the surface lowering on the IJR-41 ice cap prevailed at least until March 2008. The lowering trend indicated by satellite altimetry over the period 2003–2008 correlates with the mean summer air temperature in the northern AP, implying the significance of surface ablation for annual mass changes of ice caps in this region. The shift from the lowering trend to an increase in glacier surface elevation probably occurred after the ablation season 2008/09, which ranks among the warmest summers in the north-eastern AP since the mid-20th century. The onset of the positive surface elevation changes in 2009/10 correlates with the period of surface mass gain that was reported from glaciers around the AP in the period 2009–2015. Since 2015, the IJR-41 ice cap has experienced enhanced lowering as indicated by the DGNSS data.
The observed aerial and surface elevation changes of the investigated glaciers indicate that the ice caps on LC are out of equilibrium with the current climate. If a continuation of the 1979–2018 surface-lowering trend is assumed, the IJR-41 ice cap will decay over the next decades to centuries except for the highest part of the dome. According to the 2015–2018 lowering scenario, glacier retreat would occur by an order of magnitude rapidly, and the whole glacier will disappear in 66 ± 19 years.
The combination of the historical ICESat data with the present DGNSS measurements has proved to be a valuable tool for improving the interpretation of the surface elevation and mass-balance changes on small ice caps in the AP region. Based on these data, the shift from surface mass loss to mass gain prior to the mass-balance year 2009/10 was excluded on the Ulu Peninsula. The satellite altimetry provides a proxy for surface mass changes on the glacier prior to the initiation of the direct field-based measurements in 2009.
The ICESat data records provide a high-accuracy estimate of glacier surface elevation over the first decade of 21st century. A combination of the ICESat dataset and ground-based DGNSS measurements excludes terrain information derived from an aerial survey which in polar areas suffers from the lack of an adequate ground control (Fox and Cziferszky, Reference Fox and Cziferszky2008). It thus offers an alternative and independent source of information on glacier thinning in the area of the AP. The approach applied in our study is limited to glaciers with low-relief topography, especially ice caps and ice domes, where laser altimetry is not biased by steep slopes and surface undulations (Hilbert and Schmullius, Reference Hilbert and Schmullius2012). Moreover, it is not realistic to couple the available ICESat measurements over large areas of the AP with DGNSS survey because fieldwork in the hardly accessible areas within this region can be extremely difficult and expensive. As soon as an accurate and homogeneous DEM will be available for the area, it will be possible to evaluate the ICESat measurements in an accurate way.
ACKNOWLEDGEMENTS
The authors acknowledge funding from the Czech Science Foundation project (GC16-14122J). Fieldwork was supported by the crew of the J.G. Mendel Station financed by the Ministry of Education, Youth and Sports of the Czech Republic (projects LM2015078 and CZ.02.1.01/0.0/0.0/16_013/0001708). We acknowledge the British Antarctic Survey for aerial photographs, the National Snow and Ice Data Center for ICESat data and the Polar Geospatial Center for the Reference Elevation Model of Antarctica. We thank for helpful comments from anonymous referees.









 Open access

