


Introduction
Carbon dioxide (CO2), methane (CH4) and nitrous oxide (N2O) are greenhouse gases (GHG) affecting the global environment and climate change (Solomon et al. Reference Solomon, Qin, Manning, Chen, Marquis, Averyt, Tignor and Miller2007). Since the pre-industrial era, atmospheric concentrations of CO2, CH4 and N2O have increased by 31 ± 4%, 151 ± 25%, and 17 ± 5%, respectively, contributing 49, 15–20, and 6% of GHGs to global warming, respectively (Solomon et al. Reference Solomon, Qin, Manning, Chen, Marquis, Averyt, Tignor and Miller2007). Increase in concentrations of these greenhouse gases and their possible contributions to the global warming are becoming a serious concern. Animals and their excreta are considered an important source of GHG production (Oenema et al. Reference Oenema, Velthof, Yamulki and Jarvis1997, Bertora et al. Reference Bertora, Alluvione, Zavattaro, Van Groenigen, Velthof and Grignani2008). At present, the emissions of GHGs have been extensively studied from livestock and their manure (Oenema et al. Reference Oenema, Velthof, Yamulki and Jarvis1997, Hynšt et al. Reference Hynšt, Šimek, Brůček and Petersen2007). However, very little work has been done to quantify GHG flux from wild animals and their excreta (Zhu et al. Reference Zhu, Liu, Xu, Ma, Gong and Zhao2008a, Reference Zhu, Liu, Xu, Ma, Zhao and Sun2008b).
In maritime Antarctica, the coastal ice free areas contain some of the largest marine animal colonies on a global scale. Marine animal colonies, tundra vegetation and the interactions between them form a special terrestrial ecosystem (Tatur & Myrcha Reference Tatur and Myrcha2002). Sea animals (including penguins, seals and other seabirds) play an important role in the nutrient cycling of the ecosystems by transferring carbon and nitrogen from the marine to the terrestrial environment (Tatur & Myrcha Reference Tatur and Myrcha2002, Sun et al. Reference Sun, Zhu, Yin, Liu, Xie and Wang2004b, Cannone et al. Reference Cannone, Wagner, Hubberten and Guglielmin2008). The deposition of a large amount of penguin guano strongly influences the physical and chemical properties of local soils, and produces a kind of special soil named ornithogenic soil (Ugolini Reference Ugolini1970, Tatur Reference Tatur1989, Michel et al. Reference Michel, Schaefer, Dias, Simas, Benites and Mendonça2006, Schaefer et al. Reference Schaefer, Simas, Gilkes, Mathison, Da Costa and Albuquerque2008). The ornithogenic soils on the Antarctic islands differ from continental ornithogenic soils due to increased liquid water content from rainfall and meltwater in maritime Antarctica (Myrcha & Tatur Reference Myrcha and Tatur1991). Ornithogenic soils on Antarctic islands have been closely studied especially near the Polish station on King George Island (Tatur & Myrcha Reference Tatur and Myrcha1984, Tatur Reference Tatur1989, Tscherko et al. Reference Tscherko, Boelter, Beyer, Chen, Elster, Kandeler, Kuhn and Blume2003, Zdanowski et al. Reference Zdanowski, Zmunda and Zwolska2005). Continental ornithogenic soils have been studied mostly on and around Ross Island (Speir & Cowling Reference Speir and Cowling1984, Ramsay & Stannard Reference Ramsay and Stannard1986, Heine & Speir Reference Heine and Speir1989, Porazinska et al. Reference Porazinska, Wall and Virginia2002) with some research conducted along the northern Victoria Land coast, including Cape Hallett (Hofstee et al. Reference Hofstee, Balks, Petchey and Campbell2006) and also near Casey Station (Roser et al. Reference Roser, Seppelt and Ashbolt1993, Beyer & Bölter Reference Beyer and Bölter2000). Penguin guano and ornithogenic soils in all penguin colonies are generally high in organic carbon (C), total nitrogen (N) and total phosphorus (P) with large variations in pH (Speir & Cowling Reference Speir and Cowling1984, Tatur & Myrcha Reference Tatur and Myrcha1984, Heine & Speir Reference Heine and Speir1989, Tatur Reference Tatur1989, Schaefer et al. Reference Schaefer, Simas, Gilkes, Mathison, Da Costa and Albuquerque2008, Simas et al. Reference Simas, Schaefer, Filho, Francelino, Filho and Da Costa2007, Reference Simas, Schaefer, Melo, De Albuquerque-Filho, Michel, Pereira, Gomes and Da Costa2008). Despite the limited geographical distribution, ornithogenic soils are the most important organic C and N reservoirs in Antarctic terrestrial ecosystems (Simas et al. Reference Simas, Schaefer, Melo, De Albuquerque-Filho, Michel, Pereira, Gomes and Da Costa2007). In addition, microbiological activity is higher in ornithogenic soils than in non-ornithogenic soils (Roser et al. Reference Roser, Seppelt and Ashbolt1993, Tscherko et al. Reference Tscherko, Boelter, Beyer, Chen, Elster, Kandeler, Kuhn and Blume2003, Zdanowski et al. Reference Zdanowski, Zmunda and Zwolska2005). Increased microbial activity may be expected to increase the decomposition of soil organic matter and GHG emissions from the ornithogenic soils.
With little known about the emission of GHGs (CO2, CH4 and N2O) from Antarctic soils and their role in global C and N cycles, compared with soils from other parts of the globe an understanding of their production in the ornithogenic soils is important for understanding C and N cycles in the coastal Antarctic environment (Sun et al. Reference Sun, Zhu, Xie and Xing2002, Gregorich et al. Reference Gregorich, Hopkins, Elberling, Sparrow, Novis, Greenfield and Rochette2006, Michel et al. Reference Michel, Schaefer, Dias, Simas, Benites and Mendonça2006, Park et al. Reference Park, Day, Strauss and Ruhland2007). Recently, a preliminary field observation has indicated that penguin or seal colonies are a significant source for atmospheric N2O and CH4 in maritime Antarctica (Zhu et al. Reference Zhu, Liu, Xu, Ma, Gong and Zhao2008a, Reference Zhu, Liu, Xu, Ma, Zhao and Sun2008b). Nevertheless, the emissions of GHGs from marine animal excreta and the soils of their colonies are still poorly understood in coastal Antarctica due to difficulties with access to the remote field sites.
In this study, we collected five penguin guano and ornithogenic soil profiles or cores from four penguin colonies, and two soil cores from one seal colony in coastal Antarctica for laboratory incubation experiments to examine potential fluxes of CO2, CH4 and N2O. The objectives were 1) to investigate nutrient compositions in penguin guano, ornithogenic soils and seal colony soils, 2) to determine GHG potential fluxes from penguin guano and soils, 3) to compare the differences of GHG emissions under aerobic and anaerobic conditions, and 4) to characterize the bioavailability of organic carbon (OC) in these guano or soils.
Materials and methods
Study sites and microcosm sampling
Penguin guano, ornithogenic soils and seal colony soils were collected at the following five study sites during the 22nd Chinese Antarctic Research Expedition (CHINARE–22):
The first site is located in an emperor penguin colony at Prydz Bay, East Antarctica (69°22′S, 76°24′E). This colony is about 10 km from the Chinese Zhongshan Station. This area has the cold, dry characteristics of a typical polar continental climate (Zhu et al. Reference Zhu, Liu, Sun and Xu2007) and is one of the most important emperor penguin colonies in coastal Antarctica with about 10 000 emperor penguins breeding here every year. One deposited emperor penguin guano profile (named Eg, about 20 cm depth) and one ornithogenic soil profile (Es, about 25 cm depth) were collected from the colony edge. Only some algae were present on the surface of the ornithogenic soils at the sampling sites.
The second site is located on Gardner Island (68°34′S, 77°52′E) and the third site is located on Magnetic Island (68°32′S, 77°54′E), both in East Antarctica. These two islands are important Adélie penguin colonies. Two deposited Adélie penguin guano profiles (Ag1 and Ag2, about 20 cm depth) with no underlying soil were sampled from the penguin colonies on Gardiner Island and Magnetic Island, respectively. Sparse algae grew on these deposits.
The fourth site is located on Ardley Island, West Antarctica (62°13′S, 58°56′W), with 2.0 km length and 1.5 km width. It has one of the largest penguin colonies in the maritime Antarctic (Sun et al. Reference Sun, Zhu, Yin, Liu, Xie and Wang2004b). Recently, CH4 and N2O emissions from this penguin colony have been measured in situ by Zhu et al. (Reference Zhu, Liu, Xu, Ma, Gong and Zhao2008a, Reference Zhu, Liu, Xu, Ma, Zhao and Sun2008b). In the active colony, continuous deposition of fresh guano and penguin trampling inhibits vegetation establishment, and soils are covered by layers of guano (Sun et al. Reference Sun, Zhu, Yin, Liu, Xie and Wang2004b). One ornithogenic soil core (As) with a depth of 30 cm was collected at a poorly drained area about 100 m from the active penguin colony. The ornithogenic soils had well expressed O and A horizons, and were covered by thick continuous moss cover.
The fifth site is located on Fildes Peninsula (61°51′–62°15′S, 57°30′–59°00′W), in the south-western part of King George Island, with an area of about 30 km2 (Fig. 1). On the western coast there are some established seal colonies. The seals include Weddell seal (Leptonychotes weddellii), elephant seal (Mirounga leonina), leopard seal (Hudrurga leptonyx), fur seal (Arctocephalus gazella) and crabeater (Lobodon carcinophagus). The elephant seal is the most abundant (71% of total seal populations). Two soil cores influenced by seal excreta (Ss1 and Ss2) were collected adjacent to the elephant seal colony. The soils had well-developed A horizons and were well-drained with sparse vegetation cover of mosses and lichens. All sampling sites are shown in Fig. 1. For a more detailed description of some study sites see Sun et al. (Reference Sun, Liu, Yin, Zhu, Xie and Wang2004a, Reference Sun, Zhu, Yin, Liu, Xie and Wang2004b) and Zhu et al. (Reference Zhu, Liu, Xu, Ma, Gong and Zhao2008a, Reference Zhu, Liu, Xu, Ma, Zhao and Sun2008b).
Sampling sites for penguin guano, ornithogenic soils and seal colony soils in coastal Antarctica. In western Antarctica: As = the site for ornithogenic soils of penguin colony, Ss1 and Ss2 = sites for seal colony soils. In eastern Antarctica: Eg and Es = sites for emperor penguin guano and ornithogenic soils, Ag1 and Ag2 = sites for Adélie penguin guano.

All penguin guano profiles (about 20 cm depth) were collected from the different penguin colonies by in situ sectioning of the accumulated guano layer from top to bottom using a bamboo scoop during January and February 2006. Intact soil cores (6 cm inner diameter, about 30 cm depth) were obtained from penguin or seal colonies by hammering 30 cm long PVC tubes into the soils and carefully digging the tubes up (Sun et al. Reference Sun, Liu, Yin, Zhu, Xie and Wang2004a, Reference Sun, Zhu, Yin, Liu, Xie and Wang2004b). These samples were kept at -10°C and transported to China for the incubation experiment.
General analyses of penguin guano and the soils
The soils or penguin guano were separated from soil cores or profiles and mixed homogeneously for the general analyses. The pH was determined in distilled water and in a 1 M KCl solution (soil: solution ratio 1:3). Total organic carbon (TOC) was analysed from the dry soil/guano by the potassium dichromate volumetric method with an analytic error of 2.5% (Sun et al. Reference Sun, Liu, Yin, Zhu, Xie and Wang2004a). Total nitrogen (TN), NH4+-N and NO3--N were determined by an ion-selective electrode method with an analytical error of < 5.0% (Zhu et al. Reference Zhu, Liu, Xu, Ma, Zhao and Sun2008b). Total phosphorus (TP) content was determined by ultraviolet visible spectrometry (UVS) with an analytical error of < 2.0%. Sulphur (S) was analysed by the KI volume method after combustion in SRJK-2 high-temperature furnace with an analytical error of < 5.0% (Sun et al. Reference Sun, Zhu, Yin, Liu, Xie and Wang2004b). Soil gravimetric moisture content (MC) was determined by drying the soil at 105°C for 12 h. MC was calculated as: MC = the weight of the lost water/dry soil weight x 100%. The precision and accuracy of our results were monitored using reference materials (GBW07) in every batch of analysis. The measured values of the reference materials were in good agreement with the reference values, and the differences were within ± 5%. These samples were run in triplicate. In addition, the samples were acidified with 50% HCl to remove carbonates for the measurement of the δ13C in organic carbon (δ13Corg). The δ13Corg and δ15N values of TN, NO3- and NH4+ were determined using MAT-251 precision isotope mass spectrometer. The δ notations were calculated from the equation:

where δ value (‰) represents the δ13Corg or the δ15N value, Rsam = 13C/12C ratio or 15N/14N ratio for the sample, and Rstd = 13C/12C ratio of the carbon reference standard (PDB) or the 15N/14N ratio of the nitrogen reference standard (Air N2). They have an analytical error of 0.2‰.
Incubation experiment and GHG fluxes
In the laboratory, all soil cores and penguin guano profiles were sectioned into three parts, and then mixed homogeneously. About 100 g (fresh weight) of soils or penguin guano were put into glass vessels (500 ml) for the incubation experiments. To investigate the potential flux of GHGs in the field, we added 1 ml water to make up for water loss during the experiment in order to maintain their field moistures. Additionally, to avoid the disturbance associated with thawing, which may lead to unusually high trace gas fluxes, the samples were completely thawed and then incubated in the dark at 4°C, which is very close to local mean air temperature in the austral summer. These glass vessels with the samples were divided into two groups: the first group was incubated in aerobic conditions, to simulate the potential GHG fluxes from penguin guano or soils under local natural conditions. The second group was incubated in N2 to establish anaerobic conditions, which was used to simulate the potential GHG fluxes under waterlogged (anaerobic) conditions due to the effect of snowmelt water on penguin guano or soils. During the incubation, the headspace gases were collected every two hours and stored in 18 ml evacuated vials before analysis. After each gas sampling, the headspace gas was renewed by blowing with ambient air repeatedly or re-evacuating and re-flushing the glass vessel with N2 five times to avoid CO2, CH4 and N2O build-up in the headspace (Zhu et al. Reference Zhu, Liu, Li, Sun, Xu and Sun2008c). The CO2, CH4 and N2O emission rates were investigated within 48 hours. Two repetitions were made for each sample. A flow diagram of the experimental treatments is in Fig. 2.
Flow diagram of experimental treatments for two incubation groups (A & B), each consisting of seven cores or profiles.

N2O concentrations in gas samples were measured with HP5890 II GC using a 63Ni electron capture detector (ECD) (Sun et al. Reference Sun, Zhu, Xie and Xing2002, Zhu et al. Reference Zhu, Sun and Ding2005). GC-ECD was equipped with back flush system with 10-port valves. A pre-column (2 m) and a main-column (Porapak Q, 100 mesh) were used with an argon-methane (95%:5%) mixture as the carrier gas at a flow rate of 30 ml min-1. The detector and column temperatures were 330°C and 85°C, respectively. Compressed air was used as standard gas with N2O concentration of 303 ppbv. The response of GC was linear within N2O concentrations of 200–5000 ppbv. The variance coefficient for standard samples was within 0.1–0.3% in 10 h. CH4 concentrations were determined by GC (Shimadzu GC-12A, Japan) equipped with a flame ionization detector (FID) and a molecular sieve 5A column (2.6 mm i.d. x 2.0 m) under N2 (40 ml min-1) as a carrier gas at 80°C (Sun et al. Reference Sun, Zhu, Xie and Xing2002, Zhu et al. Reference Zhu, Liu, Sun and Xu2007). The standard gas for CH4 is 8 ppmv. The variance coefficient for standard samples was within 0.1–0.6% in 24 h. CO2 concentrations were measured by GC (Shimadzu GC-14B, Japan) equipped with a thermal conductivity detector (TCD) and a 80/100 mesh Chromosorb 102 column. The oven, injector and detector temperatures were 60, 100 and 60°C, respectively. The carrier gas (H2) had a rate of 80 ml min-1. Flux rates were estimated from the changing rate of headspace concentrations. The incubation time intervals were 30 h for the experimental samples Ag1, Ag2, Es, Ss1 and Ss2. The time intervals for Eg and As were 46 h and 39 h, respectively. The cumulative flux was calculated by integrating the fluxes over the incubation period.
Statistical analysis
Statistical analysis was completed using the SPSS software package for Windows 2000. Statistically significant differences in potential fluxes of GHGs between incubation groups over each incubation period were assessed using analysis of variance (ANOVA). For the statistical analysis of the relationships between GHG flux and TOC, the best-fit regressions were obtained using simple exponential equation. In all analyses where P < 0.05, the factor tested and the relationship were considered statistically significant.
Results
Nutrient compositions of penguin guano and the soils
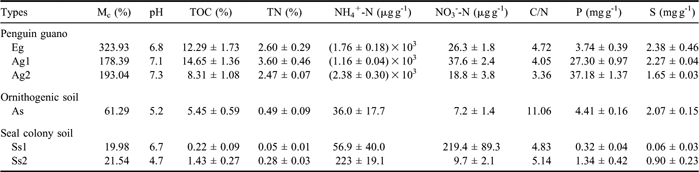
As summarized in Table I, the pH values of penguin guano and the soil samples ranged between 4.7 and 7.3, and the pH values of penguin guano were generally higher than those of ornithogenic soils and seal colony soils. TOC and TN contents in these samples were highly variable, ranging from 0.2–14.7% for TOC and from 0.05–3.60% for TN. TOC and TN contents in penguin guano were one or two orders of magnitude higher than those in the soils. The highest NH4+-N concentration in penguin guano was that of Ag2, followed by Eg; the lowest was Ag1. The NH4+-N concentrations in the soils were one or two magnitudes lower than those in penguin guano. There was no great difference in NO3--N concentrations between penguin guano and the soils. Penguin guano also had particularly high P (3.74–37.18 mg g-1) and S (1.65–2.38 mg g-1) contents compared with the soils (Table I).
Chemical and physical properties of penguin guano, ornithogenic soils and seal colony soils sampled from different sea animal colonies of coastal Antarctica (n = 3).
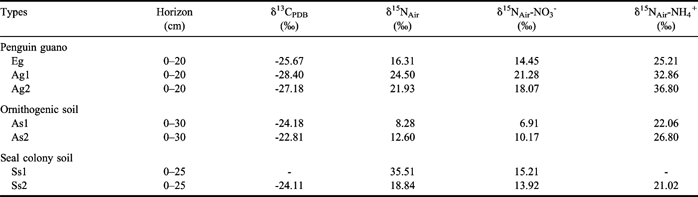
The δ13Corg ranged from -28.4‰ to -25.7‰ in penguin guano (Table II). The δ13Corg values (-24.2‰ to -22.8‰) in ornithogenic soils and seal colony soils were close to or slightly larger than those in penguin guano, confirming that penguin guano was the predominant source of TOC for ornithogenic soils. The δ15N values of TN in penguin guano and the soils varied between 8.28‰ and 35.51‰. The δ15N-NO3 and δ15N-NH4 values ranged from 6.91–21.28‰ and from 21.02–36.80‰, respectively.
The δ13Corg and δ15N values of total organic carbon (TOC) and total nitrogen (TN) measured in penguin guano, ornithogenic soils and seal colony soils of coastal Antarctica.
CO2 flux
The mean CO2 emission rates from penguin guano varied from 17.95–36.67 mg CO2-C kg-1 h-1 under aerobic conditions, and from 4.90–11.82 mg CO2-C kg-1 h-1 under anaerobic conditions (Table III). However, the CO2 emissions from ornithogenic soils and seal colony soils were very low (Figs 3–5), and the mean emission rates varied from 0.35–2.63 mg CO2-C kg-1 h-1 under aerobic conditions, and from 0.20–1.26 mg CO2-C kg-1 h-1 under anaerobic conditions. In all cases CO2 emissions from penguin guano or soils were significantly higher under aerobic conditions than under anaerobic conditions (Figs 3–5, Table III), suggesting that the aerobic respiration rates were evidently higher than anaerobic ones.
The mean three GHG emission rate and calculated specific CO2-C release (CO2-C/SOC) during the incubation (n = 13).
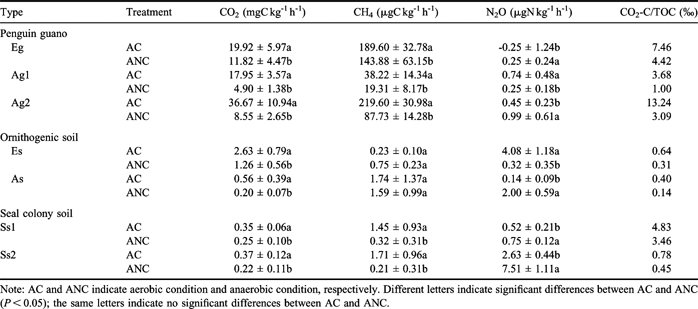
Note: AC and ANC indicate aerobic condition and anaerobic condition, respectively. Different letters indicate significant differences between AC and ANC (P < 0.05); the same letters indicate no significant differences between AC and ANC.
CO2, CH4 and N2O fluxes from a. emperor penguin guano Eg, and b. ornithogenic soil Es during the laboratory incubation. Note: the scales of the vertical axes differ in a & b.

CO2, CH4 and N2O fluxes from Adélie penguin guano a. Ag1, and b. Ag2 during the laboratory incubation. Note: the scales of the vertical axes differ in a & b.

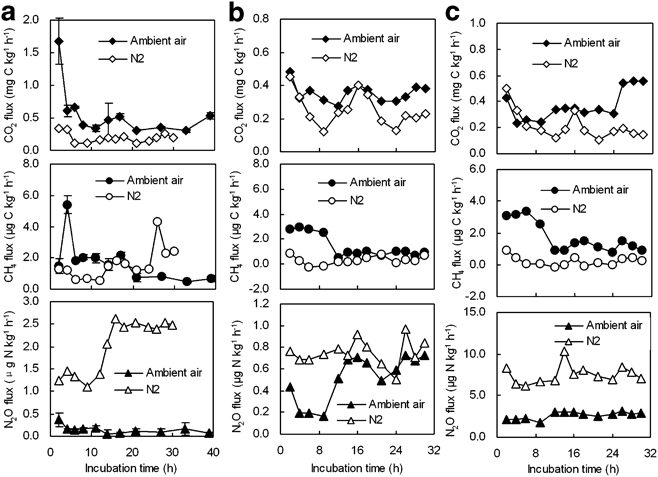
CO2, CH4 and N2O fluxes from a. ornithogenic soil As, b. seal colony soils Ss1, and c. Ss2 during the laboratory incubation. Note: the ranges of the vertical axes differ in a, b & c.
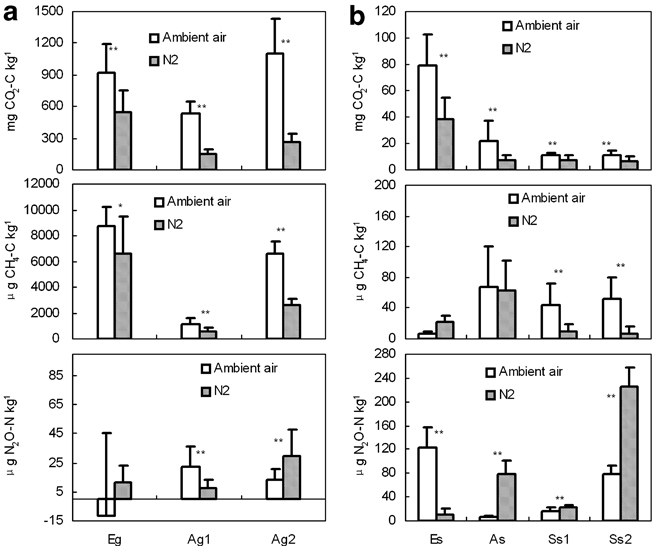
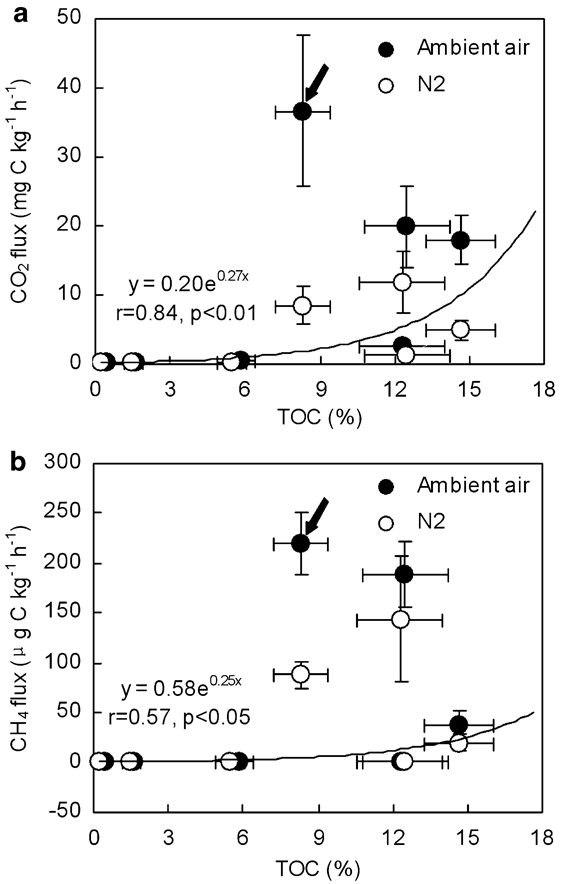
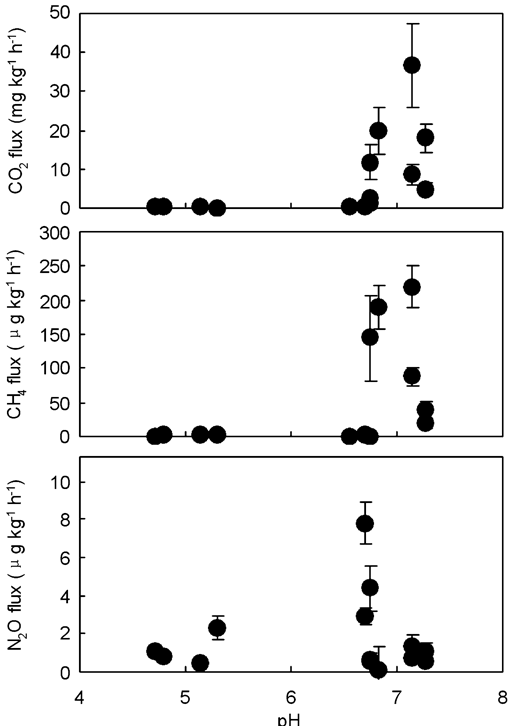
The CO2 emission may be regarded as an indicator of microbial activity. In some penguin guano or soils, CO2 emission rates showed a significant and linear correlation with N2O emission rates, indicating a linear relationship between microbial activity and N2O formation (Table IV). Although the incubation time intervals were slightly different for some samples, cumulative CO2 emission from penguin guano was generally one order of magnitude higher than those from the soils (Fig. 6). The highest cumulative CO2 emission (1.10 g CO2-C kg-1) occurred in Adélie penguin guano (Ag2). The specific CO2-C production rate (CO2-C/TOC) from penguin guano ranged from 3.68–13.24‰ under aerobic conditions, and from 1.00–4.42‰ under anaerobic conditions. The CO2-C/TOC from the soils varied from 0.40–4.83‰ under aerobic conditions, and from 0.14–3.46‰ under anaerobic conditions (Table III). These results indicated that bioavailability of organic carbon is markedly higher in penguin guano than in the soils. The correlations showed that CO2 fluxes had an exponential correlation with TOC in penguin guano and the soils (Fig. 7a), and the flux showed higher values when pH was close to 7 (Fig. 8a). Both TOC and pH had an important effect on CO2 fluxes from penguin guano, ornithogenic soils and seal colony soils.
Correlations between the fluxes of three GHGs from penguin guano, ornithogenic soils and seal colony soils during the incubation.
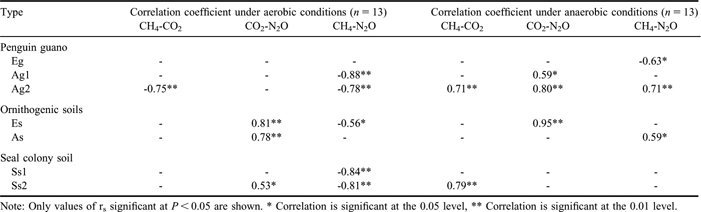
Note: Only values of rs significant at P < 0.05 are shown. * Correlation is significant at the 0.05 level, ** Correlation is significant at the 0.01 level.
Cumulative emissions of three GHGs from penguin guano, ornithogenic soils and seal colony soils during the incubation period, with standard errors. The solid column and the diagonal column indicate cumulative emissions under ambient air and N2 incubation, respectively. The asterisks indicate a significant difference at P < 0.05 (n = 13). Note: the cumulative flux was calculated by integrating the fluxes over the incubation period. The scales of the vertical axes differ in a, b & c.
Correlation between a. CO2, b. CH4 flux and TOC from Antarctic penguin guano, ornithogenic soils and seal colony soils. Note: The arrow indicates the outlier data, which exempts from correlation (n = 13).
Effects of pH on the fluxes of a. CO2, b. CH4, and c. N2O from Antarctic penguin guano, ornithogenic soils and seal colony soils (n = 14).
CH4 flux
The mean CH4 emissions from penguin guano varied from 38.22–219.60 μg CH4-C kg-1 h-1 under aerobic conditions, and from 19.31–143.88 μg CH4-C kg-1 h-1 under anaerobic conditions. However, the emission rates from ornithogenic soils and seal colony soils were very low (0–2 μg CH4-C kg-1 h-1) (Table III). CH4 emission rates from penguin guano or soils were significantly higher under aerobic conditions than under anaerobic conditions except Es (Table III), which was very similar to CO2 emission rates (Figs 3–5). Cumulative CH4 emissions from penguin guano Eg, Ag1 and Ag2 were 2–3 orders of magnitude higher than those from other experimental samples. The highest cumulative CH4 emission (8.72 mg CH4-C kg-1) occurred in emperor penguin guano Eg (Fig. 6). Overall, CH4 emission rates from penguin guano are greatly higher than those from the soils. CH4 emission rates also had an exponential correlation with TOC, and the flux showed higher values when pH was close to 7 (Figs 7b & 8b), which is very similar to CO2 flux.
N2O flux
During the incubation, the mean N2O emission rates from penguin guano varied from -0.25 to 0.74 μg N2O-N kg-1 h-1 under aerobic conditions, and from 0.25–0.99 μg N2O-N kg-1 h-1under an aerobic condition (Table III). The emission rates from emperor penguin guano Eg were close to each other under aerobic or anaerobic conditions with very low and even negative values (Fig. 3a). The emission rates from Adélie penguin guano Ag1 were significantly higher under aerobic conditions than under anaerobic conditions. However, the emission rates from Ag2 were significantly lower under aerobic conditions than under anaerobic conditions (Fig. 4).
The ornithogenic soils and seal colony soils had higher N2O emission rates under anaerobic conditions than under aerobic conditions except Es (Table III) (Fig. 5). The mean emission rates from the soils ranged from 0.14–4.08 μg N2O-N kg-1 h-1 under aerobic conditions, and from 0.32–7.51 μg N2O-N kg-1 h-1 under anaerobic conditions (Table III). Additionally, N2O emission rates from the soils were generally higher than those from penguin guano (Figs 3–5). Cumulative N2O emission from the soils was also higher than those from penguin guano (Fig. 6). For penguin guano, the highest N2O cumulative emission of 29.80 μg N2O-N kg-1 was obtained from Ag2. For the soils, the highest N2O emission (225.28 μg N2O-N kg-1) was from Ss2 (Fig. 6). N2O emission rates had a significantly negative correlation with CH4 emission rates in penguin guano (Table III). Although these samples were from different sites, the highest N2O fluxes were at about pH 7.0 with the lowest fluxes at about pH 5.0 (Fig. 8c), suggesting that pH has an important effect on N2O emissions from penguin guano and the soils.
Discussion
Effects of penguin guano and seal excreta on soil nutrients
Marine animal excreta are an important source of nutrients for Antarctic terrestrial ecosystems (Sun et al. Reference Sun, Liu, Yin, Zhu, Xie and Wang2004a, Reference Sun, Zhu, Yin, Liu, Xie and Wang2004b). Penguins had the greatest influence on soil properties in initiating the development of ornithogenic soils (Cannone et al. Reference Cannone, Wagner, Hubberten and Guglielmin2008, Schaefer et al. Reference Schaefer, Simas, Gilkes, Mathison, Da Costa and Albuquerque2008, Simas et al. Reference Simas, Schaefer, Filho, Francelino, Filho and Da Costa2008). The N and P are highly enriched in penguin guano (Table I), and guano accumulation in penguin colonies represents the most abundant source of soil organic matter (Hofstee et al. Reference Hofstee, Balks, Petchey and Campbell2006, Michel et al. Reference Michel, Schaefer, Dias, Simas, Benites and Mendonça2006, Simas et al. Reference Simas, Schaefer, Melo, De Albuquerque-Filho, Michel, Pereira, Gomes and Da Costa2007). In this study, TOC, TN and P contents in penguin and seal colony soils were comparable to those in ornithogenic soils (0.1–4.8% for TOC, 0.08–2.00% for TN and 0.36–1.36 mg g-1 for P) reported by Simas et al. (Reference Simas, Schaefer, Filho, Francelino, Filho and Da Costa2007, Reference Simas, Schaefer, Melo, De Albuquerque-Filho, Michel, Pereira, Gomes and Da Costa2008) and Schaefer et al. (Reference Schaefer, Simas, Gilkes, Mathison, Da Costa and Albuquerque2008). Furthermore TOC and TN contents in these soils were also comparable to those in the tundra soils (1.4–6.0% for TOC and 0.14–0.51% for TN) of northern Siberia (Rodionow et al. Reference Rodionow, Flessa, Kazansky and Guggenberger2006), and in some pig slurries (0.23–6.74% for TOC and 0.32–0.62% for TN) (Bertora et al. Reference Bertora, Alluvione, Zavattaro, Van Groenigen, Velthof and Grignani2008), suggesting that penguin guano or these colony soils are the most important organic C and N reservoirs in Antarctic terrestrial ecosystems (Simas et al. Reference Simas, Schaefer, Melo, De Albuquerque-Filho, Michel, Pereira, Gomes and Da Costa2007) despite the limited geographical distribution of penguin guano and soils. Over the last half-century, Antarctica has been experiencing a particularly rapid regional warming (Smith et al. Reference Smith, Ainley, Baker, Domack, Emslie, Fraser, Kennett, Laventer, Mosely-Thompson, Stammerjohn and Vernet1999). Warmer temperature and frequent precipitation may have accelerated the decomposition rates of accumulated organic matter in the soils around animal colonies, and thus increased the emissions of GHGs (Rodionow et al. Reference Rodionow, Flessa, Kazansky and Guggenberger2006, Park et al. Reference Park, Day, Strauss and Ruhland2007). A more detailed understanding of biogeochemical processes for C and N in these colonies is needed to predict the effects of rapidly changing climate on the terrestrial ecosystems in coastal Antarctica.
δ 13Corg and δ 15N in penguin guano and the soils
The δ13Corg in penguin guano (Table II) is similar to that of the surface soils in the boreal arctic zone of western Canada (Bird et al. Reference Bird, Santruckova, Lloyd and Lawson2002a) and boreal soils in Siberia (-26.3 to -28.0‰) (Bird et al. Reference Bird, Santruckova, Arneth, Grigoriev, Gleixner, Kalaschnikov, Lloyd and Schulze2002b), and the δ13Corg values of both penguin guano and the soils fit well within the ranges (δ13Corg = -15 to -32‰) for Victoria Land soils, Antarctica (Barrett et al. Reference Barrett, Virginia, Wall, Cary, Adams, Hacker and Aislabie2006, Hopkins et al. Reference Hopkins, Sparrow, Gregorich, Novis, Elberling and Greenfield2008). It is well established that sub-Antarctic and Antarctic ornithogenic ecosystems in close proximity to animal colonies have highly enriched δ15N values, and our results were in accordance with those reported in the literature (Wada et al. Reference Wada, Shibata and Torii1981, Mizutani & Wada Reference Mizutani and Wada1988, Erskine et al. Reference Erskine, Bergstrom, Schmidt, Stewart, Tweedie and Shaw1998, Huiskes et al. Reference Huiskes, Boschker, Lud and Moerdijk-Poortvliet2006, Liu et al. Reference Liu, Li, Sun, Yin, Zhao and Wang2006, Park et al. Reference Park, Day, Strauss and Ruhland2007). The δ15N-TN, δ15N-NO3 and δ15N-NH4 values in penguin guano and the soils were higher than those of total nitrogen (4.46–6.29‰) in the tundra soil of northern Siberia (Rodionow et al. Reference Rodionow, Flessa, Kazansky and Guggenberger2006). Recently, Amundson et al. (Reference Amundson, Austin, Schuur, Yoo, Matzek, Kendall, Uebersax, Brenner and Baisden2003) summarized the global patterns of the isotopic composition of soil. They concluded that high northern latitude ecosystems should have the most depleted soil 15N values (-2.0 to 2.1‰); whereas arid and tropical zones should have the most positive δ15N values (6.2–10.3‰). However, the δ15N values in Antarctic penguin guano, ornithogenic soils and seal colony soils were significantly higher than those in the regions reported by Amundson et al. (Reference Amundson, Austin, Schuur, Yoo, Matzek, Kendall, Uebersax, Brenner and Baisden2003) due to 15N discrimination during microbial N transformation (especially during nitrification and denitrification) and the loss of 15N-depleted nitrogen (e.g., by nitrate leaching, ammonia volatilization or denitrification) (Erskine et al. Reference Erskine, Bergstrom, Schmidt, Stewart, Tweedie and Shaw1998, Michalski et al. Reference Michalski, Bockheim, Kendall and Thiemens2005, Zhu et al. Reference Zhu, Liu, Li, Sun, Xu and Sun2008c). Therefore the high enrichment of 15N indicates a rapid N cycling in local ecosystems. Particularly high values of δ15N also suggested that the major pathway of N from penguin guano to terrestrial ecosystems might be meltwater runoff from penguin colonies or through penguins traversing the colony site, rather than atmospheric deposition of ammonia, since ammonia volatilized from penguin guano has low δ15N values of about -10‰ (Erskine et al. Reference Erskine, Bergstrom, Schmidt, Stewart, Tweedie and Shaw1998, Michalski et al. Reference Michalski, Bockheim, Kendall and Thiemens2005).
CO2 fluxes from penguin guano and the soils
Most of global ecosystems are net sinks for CO2 (-63.4∼-12.0 mg m-2 h-1) due to photosynthesis by vegetation (Dalal & Allen Reference Dalal and Allen2008). However, net CO2 emission might occur in the terrestrial ecosystems of coastal Antarctica due to the sparse vegetation and deposition of a large amount of penguin guano and seal excreta onto the land. Additionally, the CO2 fluxes from penguin guano (4.90–36.67 mg CO2-C kg-1 h-1) and the soils (0.20–2.63 mg CO2-C kg-1 h-1) observed in laboratory microcosms (Table III), are considerably higher than the values (0.001–0.065 mg CO2-C kg-1 h-1) for cold desert soil of the McMurdo Dry Valleys of Antarctica (Burkins et al. Reference Burkins, Virginia and Wall2001, Treonis et al. Reference Treonis, Wall and Virginia2002). The high CO2 emission from penguin guano or soils is predominantly derived from heterotrophic respiration which is derived from a wide variety of soil organisms that convert complex organic materials into simpler C compounds (Parsons et al. Reference Parsons, Barrett, Wall and Virginia2004, Barrett et al. Reference Barrett, Virginia, Wall, Cary, Adams, Hacker and Aislabie2006). The CO2 emissions may also be due to physical release and/or elevated microbial activity as a result of an extraordinarily large nutrient supply from penguin guano or seal excreta (Figs 3–7 and Table I).
On the other hand, higher microbial activity may result in higher oxygen consumption and higher mineralization/nitrification rates, which may further induce higher N2O emissions via higher denitrification activity (Dorland & Beauchamp Reference Dorland and Beauchamp1991, Zhu et al. Reference Zhu, Liu, Xu, Ma, Zhao and Sun2008b). The correlation between the levels of N2O and CO2 emissions from some penguin guano and soils also supported this hypothesis (Table IV). Additionally, the CO2 fluxes have a significant correlation with TOC concentrations excluding one outlier (Fig. 7a), and the specific CO2-C production rates (CO2-C/TOC, 0.14–13.24‰) were very high (Table III), indicating that the potential bioavailability of organic carbon was high in penguin guano or soils. Despite high CO2 emission rates under incubation (4°C), C turnover in the Antarctic field may be faster than the results of this study due to higher ground temperature in the summer and a rapidly cycling pool of soil organic matter in penguin or seal colonies (Treonis et al. Reference Treonis, Wall and Virginia2002, Parsons et al. Reference Parsons, Barrett, Wall and Virginia2004, Park et al. Reference Park, Day, Strauss and Ruhland2007). Furthermore high rates of C cycling may accelerate the recycling of N from penguin guano (Park et al. Reference Park, Day, Strauss and Ruhland2007).
N2O fluxes from penguin guano and the soils
The N2O emissions from penguin guano or soils are derived from denitrification and nitrification processes (Zhu et al. Reference Zhu, Liu, Xu, Ma, Zhao and Sun2008b, Reference Zhu, Liu, Li, Sun, Xu and Sun2008c). Nitrification is an oxidative process carried out by a select group of organisms that convert ammonium to nitrate, in which a small amount of nitrous oxide can result (Tortoso & Hutchinson Reference Tortoso and Hutchinson1990). Denitrification is a reductive process carried out by obligatory and facultative anaerobic bacteria that convert nitrate to either nitrous oxide. Nutrient-rich soils with abundant organic C under wet soil conditions would provide the most ideal conditions for denitrification to occur (Zhu et al. Reference Zhu, Liu, Xu, Ma, Zhao and Sun2008b). Under aerobic conditions, nitrification may be an important contributor for the N2O source from penguin guano due to high concentration of NH4+ present in the guano (Table I). Additionally, the soils As, Ss1 and Ss2 had higher N2O emission rates under anaerobic conditions than under aerobic conditions (Fig. 5), indicating that denitrification may be the major process in N2O emission. The high N2O emissions may be related to high concentration of NO3- present in these soils (Table I). Such high concentrations ensure that nitrate does not limit denitrification (Zhu et al. Reference Zhu, Liu, Li, Sun, Xu and Sun2008c). Furthermore, NO3- which was derived from marine animal excreta and accumulated in the water together with increased C availability might provide optimum conditions for denitrification, and anaerobiosis developing in the centres of soil or guano aggregates was most likely enhanced by high respiration rates (Christensen & Christensen Reference Christensen and Christensen1991). The increase in N2O emission potential during the incubation may also be due to NO3- and NH4+ immobilization by soil microbial biomass (Stark & Stephen Reference Stark and Stephen1997).
Recently, a preliminary field observation of N2O fluxes has been conducted in a penguin colony on Ardley Island, and in a seal colony on Fildes Peninsula in maritime Antarctica using a static chamber technique (Zhu et al. Reference Zhu, Liu, Xu, Ma, Zhao and Sun2008b). Mean N2O fluxes from the ornithogenic soils and seal colony soils were 43 and 12 μg N2O-N m-2 h-1, respectively (Zhu et al. Reference Zhu, Liu, Xu, Ma, Zhao and Sun2008b). However, mean N2O fluxes from soils that had no obvious influence from penguin guano or seal excreta were very low with the range of 0.6–1.4 μg N2O-N m-2 h-1 in maritime Antarctica. In this study, the fluxes from the incubated guano or soils were converted to μg m-2 h-1. The mean N2O fluxes from penguin guano and the soils were 1–33 μg N2O-N m-2 h-1 under aerobic conditions, and 1–86 μg N2O-N m-2 h-1 under anaerobic conditions. These fluxes are comparable to those measured from penguin and seal colonies. However, they were much higher than those from soils that had no obvious influence from guano or seal excreta. These fluxes were also comparable to those from Chinese paddy fields (15–53 μg N2O-N m-2 h-1) (Xing & Zhu Reference Xing and Zhu1997) and some farm yards used by livestock (8–18 μg N2O-N m-2 h-1) (Misselbrook et al. Reference Misselbrook, Webb, Chadwick, Ellis and Pain2001). Furthermore they were generally higher than those from forests (-1–2 μg N2O-N m-2 h-1) (Castro et al. Reference Castro, Steudler, Melillo, Aber and Millham1993), grasslands (2–7 μg N2O-N m-2 h-1) of USA (Mosier et al. Reference Mosier, Delgado, Cochran, Valentine and Parton1997), and boreal wetlands (0-8 μg N2O-N m-2 h-1) of the Northern Hemisphere (Schiller & Hastie Reference Schiller and Hastie1994). Therefore penguin guano, ornithogenic soils and seal colony soils are clearly important sources for N2O in coastal Antarctica.
CH4 fluxes from penguin guano and the soils
A notable phenomenon is that CH4 emission rates from most of the experimental samples were significantly higher under aerobic conditions than under anaerobic conditions (Figs 3–6), which was very similar to CO2 emission rates. One possible explanation could be the release of more microbially available C under aerobic conditions than under anaerobic conditions. Furthermore, wet penguin guano and ornithogenic soils have been used for laboratory incubation, and anaerobic microsites may exist within these experimental samples (Table I). Therefore higher CH4 emission rates under aerobic conditions may be due to more availability of organic substrates for methanogenic bacteria and high soil or guano water content.
Field observation showed that mean CH4 fluxes from ornithogenic soils and seal colony soils were 92.9 and 17.9 μg CH4-C m-2 h-1, respectively (Zhu et al. Reference Zhu, Liu, Xu, Ma, Gong and Zhao2008a), whereas local soils that had no obvious influence from penguins or seals were generally the sinks for CH4 with mean flux of -14.5 μg CH4-C m-2 h-1 in maritime Antarctica (Zhu & Sun Reference Zhu and Sun2005). In this study, the mean CH4 fluxes were 0.4–2.4 mg CH4-C m-2 h-1 for penguin guano and 2.4–17.7 μg CH4-C m-2 h-1 for the soils. The fluxes from penguin guano were two orders of magnitude higher than those from the colony soils. Of all global CH4 sources, natural wetlands are the single largest source of CH4 to the atmosphere. The patterns of wetland CH4 emissions are dominated by latitude with mean emissions for each latitudinal region ranging between 1.4 mg m-2 h-1 (boreal), 2.8 mg m-2 h-1 (sub-tropical) and 6.0 mg m-2 h-1 (tropical) (Dalal & Allen Reference Dalal and Allen2008). CH4 fluxes from penguin guano were comparable to the fluxes from these wetlands, indicating that penguin guano is an important source for CH4 in coastal Antarctica.
Effects of water content and pH on GHG fluxes
It should be emphasized that water content is an important factor in determining soil microbial activity in Antarctic environments (Kennedy Reference Kennedy1993). Therefore soil moisture is probably an important contributing factor to the higher flux rates of GHGs associated with penguin guano or soils in coastal Antarctica. In our assessments there was no need to saturate the soils or guano to produce slurries, as in the methods used by Harris & Tibbles (Reference Harris and Tibbles1997) and Cocks et al. (Reference Cocks, Newton and Stock1998), as our samples were at typical moisture contents for the different colonies, and thus our results reflect GHG-flux under moisture conditions present in the field.
In this study, penguin guano, ornithogenic soils and seal colony soils also showed large variations in pH (4.7–7.3, Table I), which is in accordance with previous reports (Speir & Cowling Reference Speir and Cowling1984, Tatur & Myrcha Reference Tatur and Myrcha1984, Tatur Reference Tatur1989, Beyer & Bölter Reference Beyer and Bölter2000, Hofstee et al. Reference Hofstee, Balks, Petchey and Campbell2006). Methanogenic activity occurs under a range of conditions with optimum pH ranging from 6.8–7.2 (Hynšt et al. Reference Hynšt, Šimek, Brůček and Petersen2007). Amaral et al. (Reference Amaral, Ren and Knowles1998) found that methanotrophs isolated from acidic soils (pH 4.5–5.2) showed no methane oxidizing activity at the ambient air CH4 concentration in the range of pH 6.8–7.0. The optimal pH for nitrification and denitrification is ∼7–8 (Dalal & Allen Reference Dalal and Allen2008). Therefore the GHG emission rates from penguin guano or soils showed higher values with a pH close to 7 (Fig. 8), indicating that pH may have an important effect on microbial activity and the optimal pH for GHG production is ∼7 in penguin guano and the soils, which is in accordance with previous data (Hynšt et al. Reference Hynšt, Šimek, Brůček and Petersen2007, Dalal & Allen Reference Dalal and Allen2008).
Conclusions
Our results show that marine animal excreta are an important factor determining storage and composition of TOC and TN in Antarctic terrestrial ecosystems, and that they may considerably affect current and future net fluxes of GHGs in this region. The CO2 and CH4 fluxes from penguin guano and soils have a significant correlation with TOC content. The potential CO2 and CH4 emissions from penguin guano were significantly higher than those from ornithogenic soils and seal colony soils under aerobic or anaerobic conditions. The specific CO2-C production rate (CO2-C/OC) indicated that the bioavailability of TOC was markedly higher in penguin guano than in ornithogenic soils and seal colony soils. However, these soils had higher N2O emission rates under anaerobic conditions than under aerobic conditions, indicating that denitrification may be the major process for N2O source.
Although the experiment was short-term and conducted at relatively stable temperature (4°C), our results showed that penguin guano, ornithogenic soils and seal colony soils do have high potential fluxes of GHGs, indicating the importance of the GHG emissions from these colonies on annual fluxes from Antarctic terrestrial ecosystems. On the other hand, it should be noted that GHG production and emission is probably limited to the area of the colonies during the short summer. In maritime Antarctica and the sub-Antarctic, the number of marine animals and their colonies is potentially large. At present, data on GHG emissions from these colonies are still very scarce. Much more work is needed in this region to characterize the fluxes of GHGs from sea animal colonies on a field and regional basis.
Acknowledgements
This work was funded by the National Natural Science Foundation of China (grant nos. 40676005 and 40730107). We thank Polar Office of National Ocean Bureau of China and the members of the 22nd Chinese Antarctic Research Expedition for their support.



