

Introduction
Apathy can be defined as a “simultaneous decrease in the behavioral, cognitive and emotional concomitants of goal-directed behavior due to loss of motivation” and, for clinical purposes, as a “lack of motivation that is not attributable to diminished level of consciousness, cognitive impairment, or emotional distress” (Marin, Reference Marin1991).
Apathy is a significant, if often overlooked, neuropsychiatric symptom. It can impair recovery from a disabling injury, both physical and neurocognitive, and is associated with longer hospital stay following stroke and lower likelihood of seeking out rehabilitation services (Galynker et al., Reference Galynker, Prikhojan, Phillips, Focseneanu, Ieronimo and Rosenthal1997; Resnick et al., Reference Resnick, Zimmerman, Magaziner and Adelman1998; Zawacki et al., Reference Zawacki2002; Lenze et al., Reference Lenze2007). Apathy also increases burden on caregivers who may misattribute the pathological loss of drive to laziness and defiance (Landes et al., Reference Landes, Sperry, Strauss and Geldmacher2001).
Studies of apathy range across clinical samples including stroke, Parkinson's disease, dementia, malnutrition and depression (e.g. Robinson et al., Reference Robinson, Kubos, Starr, Rao and Price1984; Rasmussen et al., Reference Rasmussen, Mortensen and Jensen1989; Robinson and Starkstein, Reference Robinson and Starkstein1990; Starkstein et al., Reference Starkstein, Federoff, Price, Leiguarda and Robinson1993; Marin et al., Reference Marin, Firinciogullari and Biedrzycki1993; Okada et al., Reference Okada, Kobayashi, Yamagata, Takahashi and Yamaguchi1997; Levy et al., Reference Levy1998; Andersson et al., Reference Andersson, Krogstad and Finset1999; Ghika-Schmid and Bogousslavsky, Reference Ghika-Schmid and Bogousslavsky2000; Lyketsos et al., Reference Lyketsos, Lopez, Jones, Fitzpatrick, Breitner and DeKosky2002; Lampe and Heeren, Reference Lampe and Heeren2004; Yamagata et al., Reference Yamagata, Yamaguchi and Kobayashi2004; Landes et al., Reference Landes, Sperry and Strauss2005; Brodaty et al., Reference Brodaty, Sachdev, Withall, Altendorf, Valenzuela and Lorentz2005; Bourre, Reference Bourre2006; Borek et al., Reference Borek, Chou and Friedman2007; Benoit et al., Reference Benoit2008; Clarke et al., Reference Clarke2008). Few studies, however, have attempted to describe apathy in healthy elderly persons. Adams (Reference Adams2001) studied members of a Health Maintenance Organization aged 65 or older using subscales of the Geriatric Depression Scale (GDS; Parmalee et al., Reference Parmalee, Lawton and Katz1989). Items representing apathy/withdrawal were more commonly endorsed (75.2%) than items representing depression/dysphoria (37.8%), anxiety (25.1%) or mental impairment (51.6%). In the Cache County population-based study (Onyike et al., Reference Onyike2007) involving individuals aged 65 and older, 2% of persons without cognitive impairment and 27.4% of those with dementia scored > 0 on the Neuropsychiatric Inventory apathy item (NPI; Cummings et al., Reference Cummings, Mega, Gray, Rosenberg-Thompson, Carusi and Gornbein1994). Similar results were obtained from a cohort aged 65 and older, randomly sampled from Medicare lists in four U.S. communities (Lyketsos et al., Reference Lyketsos, Lopez, Jones, Fitzpatrick, Breitner and DeKosky2002). Apathy, defined as a score of > 0 on the NPI apathy item, was present in 3.2% of cognitively intact persons, 14.7% of those with mild cognitive impairment (MCI) and 35.9% of those with dementia. Rates of “clinical apathy” were lower in a subsequent analysis of the Cache County sample using a higher threshold of ≥ 4: 1.4% for cognitively normal subjects, 3.1% for MCI and 17.3% for dementia (Onyike et al., Reference Onyike2007). Using a more detailed instrument, Marin et al.(Reference Marin1991) measured apathy with the Apathy Evaluation Scale (AES; Marin, Reference Marin1991) and reported differing scores for well elderly (26.3 ± 7.5), left hemisphere stroke (28.1 ± 6.9), right hemisphere stroke (35.4 ± 10.9), Alzheimer's disease (49.1 ± 9.9) and major depression (41.7 ± 15.0). All of the abovementioned studies used informant-rated scales.
Correlates of apathy
In clinical samples of stroke and dementia, apathy has been associated with advancing age, deficits in activities of daily living (ADLs), lower global cognitive function, poor verbal fluency, reduced attention and speed of information processing, and premorbid neuroticism (e.g. Starkstein et al., Reference Starkstein, Federoff, Price, Leiguarda and Robinson1993; Okada et al., Reference Okada, Kobayashi, Yamagata, Takahashi and Yamaguchi1997; Yamagata et al., Reference Yamagata, Yamaguchi and Kobayashi2004; Brodaty et al., Reference Brodaty, Sachdev, Withall, Altendorf, Valenzuela and Lorentz2005; Archer et al., Reference Archer2007). Neuroimaging results in stroke have been contradictory, with findings of left, right and bilateral dysfunction, and structural correlates have included posterior limb of the internal capsule pathology and thalamic infarction (e.g. Robinson et al., Reference Robinson, Kubos, Starr, Rao and Price1984; Helgason et al., Reference Helgason, Wilbur, Weiss, Redmond and Kingsbury1988; Bogousslavsky et al., Reference Bogousslavsky, Regli, Delaloye, Delaloye-Bischof, Assal and Uske1991; Robinson and Starkstein, Reference Robinson and Starkstein1990; Marin et al., Reference Marin, Firinciogullari and Biedrzycki1993; Starkstein et al., Reference Starkstein, Federoff, Price, Leiguarda and Robinson1993; Okada et al., Reference Okada, Kobayashi, Yamagata, Takahashi and Yamaguchi1997; Ghika-Schmid and Bogousslavsky, Reference Ghika-Schmid and Bogousslavsky2000; Brodaty et al., Reference Brodaty, Sachdev, Withall, Altendorf, Valenzuela and Lorentz2005). In nutritional studies, apathy has been associated with iron and magnesium deficiency and protein-calorie malnutrition (e.g. Rasmussen et al., Reference Rasmussen, Mortensen and Jensen1989; Bourre, Reference Bourre2006).
Reported correlates of apathy in healthy elderly subjects are advancing age, number of health conditions, lower instrumental activities of daily living (IADL) scores, lower income, current depression (Adams, Reference Adams2001) and cognitive and functional impairment (Onyike et al., Reference Onyike2007). Adams (Reference Adams2001) reported significant correlations between apathy/withdrawal and age, poor health and functioning, and mental impairment. This was cautiously interpreted as support for a disengagement condition that may be a normal part of aging. In participants with normal cognition, apathy has been associated with poorer performance on the Boston Naming Test, verbal fluency and constructional praxis (Onyike et al., Reference Onyike2007). Apathy in healthy older persons has also been associated with decreased gray matter volume in the right anterior cingulate (Lavretsky et al., Reference Lavretsky, Ballmaier, Pham, Toga and Kumar2007) and with decreased perfusion of the left anterior cingulate, right inferior and medial gyrus frontalis, left orbitofrontal gyrus and right gyrus lingualis (Benoit et al., Reference Benoit, Koulibaly, Migneco, Darcourt, Pringuey and Robert2002).
To our knowledge, no study has described the long-term progress of apathy in healthy elderly persons and the correlates of such progression. We aimed to examine the frequency and progression of apathy as well as its demographic, clinical and neuropsychological predictors in a cohort of healthy subjects over five years. Regarding neuropsychological predictors, we hypothesized that change of apathy would be associated with impaired speed of information processing, attention and executive function at baseline assessment. Regarding neuroimaging predictors, we hypothesized that change of apathy would be associated with total brain atrophy, deep white matter hyperintensities (DWMH) and right frontal subcortical circuit pathology at baseline assessment.
Methods
Subjects
Healthy elderly subjects were recruited by general advertisement and through local community groups and asked to participate as a control group for a longitudinal study of stroke patients (the Sydney Stroke Study). The following were criteria for exclusion: history of stroke; inability to give informed consent; insufficient fluency in English to complete testing; history of dementia or other neurological disease known to affect cognition, alcohol or drug abuse; a retrospective score on the Informant Questionnaire on Cognitive Decline in the Elderly (IQCODE; Jorm, Reference Jorm1994) of ≥ 3.31 (indicating possible dementia prior to baseline); DSM-IV (American Psychiatric Association; 1994) diagnosis of mental retardation; severe aphasia (< 3 on the Aphasia Severity Rating Scale of the Boston Diagnostic Aphasia Examination; Goodglass and Kaplan, Reference Goodglass and Kaplan1983); current major psychiatric illness or lack of an appropriate informant.
Of the 130 subjects who volunteered as potential controls and met eligibility criteria, 23 declined to continue prior to baseline assessment, leaving 107 subjects who were re-assessed 1, 3 and 5 years later. Between baseline and the 5-year assessment, 31 subjects were lost to follow-up (26 withdrew and 5 died). The 76 subjects who had AES data at the 5-year assessment constitute the sample for this study; results indicate when subjects had missing AES data at other time points.
The study had institutional ethics committee approval and subjects provided written informed consent after receiving a complete description of the study.
Clinical measures
Measures of functional ability included ADL (Katz and Akpom, Reference Katz and Akpom1976) and IADL (Lawton and Brody, Reference Lawton and Brody1969) scales, which were added (ADL + IADL) to produce a maximum combined total of 14. Cerebrovascular risk factors (history or presence of hypertension, diabetes, hypercholesterolemia, coronary artery disease, peripheral vascular disease and atrial fibrillation) and smoking and alcohol use data were recorded. We recorded the medications being taken and used the number of different types as a proxy measure of physical health (Agostini et al., Reference Agostini, Han and Tinetti2004).
Psychiatric measures
Apathy was evaluated using the informant-rated version of the AES (Marin, Reference Marin1991; Marin et al., Reference Marin, Biedrzycki and Firinciogullari1991). When reporting rates, scores on the AES were dichotomized at 36/37, calculated as being two standard deviations greater than the mean for the original control subjects at baseline (Brodaty et al., Reference Brodaty, Sachdev, Withall, Altendorf, Valenzuela and Lorentz2005) and consistent with other studies (Kant et al., Reference Kant, Duffy and Pivovarnik1998; Andersson et al., Reference Andersson, Krogstad and Finset1999). We also examined subscales of the AES as reported by Marin et al. (Reference Marin, Biedrzycki and Firinciogullari1991): cognitive (items 1 “interested in things”, 3 “get started what is important”, 4 “interested in new experiences”, 5 “learning new things”, 8 “seeing a job through”, 11 “less concerned about problems than should be”, 13 “getting together with friends”, 16 “getting things done is important”); emotional (items 7 “approaches life with intensity”, 14 “when something good happens gets excited”); behavioral (items 2 “get things done”, 6 “puts little effort into things”, 9 “spends time doing things that are of interest”, 10 “someone has to tell what to do each day”, 12 “has friends”); and other (items 15 “accurate understanding of problems”, 17 “has initiative”, 18 “has motivation”). Other measures of psychiatric disturbance were the 17-item Hamilton Rating Scale for Depression (HRSD; Hamilton, Reference Hamilton1960) and the 15-item Geriatric Depression Scale (GDS; Sheikh and Yesavage, Reference Sheikh, Yesavage and Brink1986).
Neuropsychological measures
Global cognitive function at baseline was assessed with the MMSE (Folstein et al., Reference Folstein, Folstein and McHugh1975) and premorbid intelligence with the National Adult Reading Test-Revised (NART-R; Nelson, Reference Nelson1983). The IQCODE (Jorm, Reference Jorm1994), an indicator of premorbid cognitive decline, was rated retrospectively in the five years prior to baseline.
A full neuropsychological assessment was conducted (see Brodaty et al., Reference Brodaty, Sachdev, Withall, Altendorf, Valenzuela and Lorentz2005). We limited the number of analyses by choosing three neuropsychological domains according to findings of our previous apathy study (see Brodaty et al., Reference Brodaty, Sachdev, Withall, Altendorf, Valenzuela and Lorentz2005):
(i) Attention and concentration – Wechsler Adult Intelligence Scale-Revised Digit Span-forwards and Wechsler Memory Scale-Revised Mental Control subtest;
(ii) Executive function – Color Form Sorting Test; Verbal Fluency phonemic (FAS) and semantic (animals) and Trail Making Test Part B; and
(iii) Speed of information processing – Trail Making Test Part A and oral Symbol Digit Modalities Test.
Trained psychologists performed all tests. Neuropsychological assessments of subjects judged to be significantly depressed at clinical interview were deferred until patients improved. This was defined as either a GDS score of less than 5, a reduction in self- or informant-reported symptoms and/or further psychiatric assessment of improvement. Subjects were tested at our center or in their own homes and given breaks during testing to minimize fatigue.
Neuroimaging
At baseline assessment, 63 subjects received an MRI scan performed on a 1.5 Tesla Signa GE scanner (GE Systems, Milwaukee, U.S.A.) using the following protocol: a scout mid-sagittal cut (2D, repetition time TR 300 msec, echo time TE 14 msec; 5 mm thick, number of excitations 1.5); 1.5 mm thick T1-weighted contiguous coronal sections through the whole brain using a FSPGR sequence (TR 14.3 msec, TE 5.4 msec); and 4 mm thick (0 skip) T2-weighted fluid attenuation inversion recovery (FLAIR) coronal slices through the whole brain (TR 8900, TE 145, TI 2200, FOV 25, 256×192). Trained staff scored these with good inter-rater (κ scores from 0.7 to 0.9 on various measures) and intra-rater (κ 0.8 to 0.9) reliability determined on five scans each. All ratings were carried out on a computer console using ANALYZE® (Mayo Foundation, Rochester MI, U.S.A.) software. Deep white matter (DWMH) hyperintensities were rated on a 0–3 scale, with a higher score representing more pathology (Fazekas et al., Reference Fazekas, Chawluk, Alavi, Hurtig and Zimmerman1987). For DWMH rating, the frontal, temporo-parietal and occipital white matter, and the internal capsules were rated separately, and the scores for both sides added to give a total DWMH score (max score = 24). A measure of right subcortical-frontal circuit white matter hyperintensities, computed by summing scores for right-sided frontal white matter, anterior capsule, basal ganglia and thalamus, was chosen according to previous results (Brodaty et al., Reference Brodaty, Sachdev, Withall, Altendorf, Valenzuela and Lorentz2005). Cortical atrophy was rated as the sum on a 0–2 scale of each of the frontal, temporal and mid-parietal regions (higher scores = more atrophy, max score = 6).
Statistical analyses
Data were analyzed using SAS, version 9 (SAS Institute Inc., Cary, NC) and SPSS, versions 15/17 (SPSS Inc., Chicago, IL). Two-sample t-tests were employed for between-group comparisons on continuous variables. Between-group comparisons on categorical variables were analyzed using χ2 with Yates’ continuity correction for 2×2 tables and Fisher's exact test when expected frequencies were lower than five in two or more cells. For all analyses, probability levels reported were two-tailed, and the level of significance was set at 0.05. Z-scores for neuropsychological domains were derived from raw scores, normed by control data.
Linear mixed models were used to describe the change of apathy across four assessments and to test which baseline variables were predictors of apathy levels. The model for change of apathy over time included the intercept and time (measured as a discrete variable coded as 0, 12, 36, 60 weeks). Because of the small sample size, predictors were tested in two stages. The first stage (“univariate model”) included the intercept, one baseline predictor (fixed effect), time and an interaction between predictor and time (see Table 2). The interaction was removed from the model if it was not significant. The second stage (“multivariate model”) included significant predictors from the univariate analyses, intercept, time and interactions between predictors, and interactions between time and predictors. Interaction terms were removed from the model if they were not significant. Fixed effects were tested using type 3 sums of squares, which adjusts lower-order terms for higher ones. The covariance structure type (compound symmetry [CS], unstructured; autoregressive [AR (1)], Toeplitz [TOEP], variance components, heterogeneous AR (1), heterogeneous CS, heterogeneous TOEP) (Kincaid, Reference Kincaid2005) was selected using goodness of fit criteria (Akaike's Information Criterion and Schwarz's Bayesian Criterion).
Results
The sample
Of the 107 subjects recruited at baseline, there were no significant differences between the 76 subjects with complete AES data at 5-year assessment and the 31 subjects without AES data at 5 years with respect to baseline MMSE scores (t = −0.48, df = 97.00, P = 0.63), ADL+IADL scores (t = 0.39, df = 99.00, P = 0.70) and baseline AES total scores (t = −1.30, df = 89.00, P = 0.20). However, completers were younger (mean ± standard deviation 69.9 years ± 5.8 vs 74.0 ± 5.4, t = 3.3, df = 104.00, P = 0.001), more highly educated (12.2 years ± 3.4 vs 10.3 ± 2.6; t = −2.8, df = 104.00, P = 0.006) and predominately male (60.5% vs 19.4%; χ2 = 14.9, df = 1, P < 0.001).
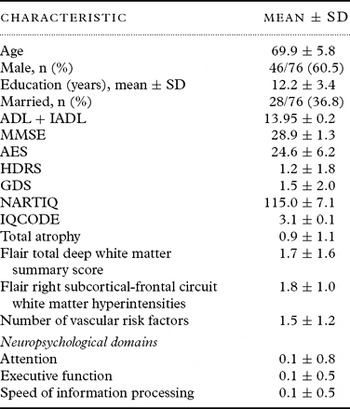
Details of the 76 subjects for this study, aged 58–85 years, are shown in Table 1. As regards vascular risk factors, 36.8% (28/76) had hypertension, 8.0% (6/75) diabetes, 23.2% (16/69) hypercholesterolemia, 14.5% (11/76) coronary artery disease, 1.4% (1/74) peripheral vascular disease, and 2.7% (2/75) atrial fibrillation; 44.0% (33/75) were smokers and 9.7% (7/72) had a diagnosis of previous alcohol abuse. At baseline, average scores were 28.9 ± 1.3 on the MMSE and 13.95 ± 0.23 on the ADL+IADL scale. One person (1.4%) was diagnosed as having major depression at baseline assessment. Males and females were similar for all variables with the exception that men smoked more (male vs female: 57.8% vs 23.3%, χ2 = 7.3, df = 1, P = 0.01), tended to have more coronary artery disease (21.7% vs 3.3%, χ2 = 3.6, df = 1, P = 0.06) and had significantly more total vascular risk factors (1.8 ±1.3 vs 0.9 ± 0.9, t = 3.04, df = 64.00, P = 0.003). One person had a stroke within the 5 years of follow-up, two had a transient ischemic attack (TIA) and three had a possible but unsure diagnosis of TIA.
Sample description at baseline assessment

SD = standard deviation; ADL = Activities of Daily Living; IADL = Instrumental Activities of Daily Living; MMSE = Mini-mental State Examination; AES = Apathy Evaluation Scale; HDRS = Hamilton Depression Rating Scale; GDS = Geriatric Depression Scale; NART-R IQ = National Adult Reading Test Intelligence Quotient; IQCODE = Informant Questionnaire on Cognitive Decline in the Elderly.
Change in apathy scores from baseline to 5-year assessment
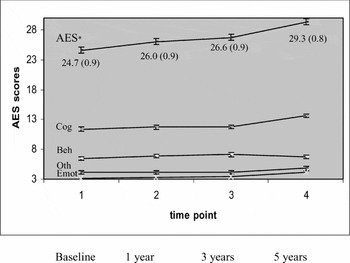
The mean AES score at baseline was 24.6 ± 6.2, with 6.0 % (4/67) having scores above the cut-off. Linear mixed models including intercept and time (four assessments) were used to test change in total AES score, as well as its subscales, from baseline to 5-year assessment (Figure 1). Total AES score (P < 0.001) as well as the emotional subscale (P < 0.001), cognitive subscale (P < 0.001), and subscale “other” (P = 0.003) changed significantly over time, but not the behavioral subscale (P = 0.07; see Figure 1). Rates of apathy rose steadily from baseline to 5-year follow up – 6.0%, 7.9%, 9.5% and 15.8%, respectively (see Figure 2).
Estimated marginal means (standard error) of AES total score and AES subscales from baseline to 5-year assessment.
* AES = Apathy Evaluation Scale total score; Cog = cognitive subscale; Beh = behavioral subscale; Emot = emotional subscale; Oth = subscale “other”.
NB: Observed mean ± standard deviation AES total: 24.6 ± 6.2, 26.0 ± 6.9, 26.7 ± 0.24, 29.3 ± 7.7.
Cognitive subscale: 11.4 ± 3.4, 11.7 ± 3.9, 11.8 ± 4.1, 13.6 ± 4.3.
Behavioral subscale: 6.4 ± 2.02, 6.9 ± 1.8, 7.1 ± 2.2, 6.7 ± 1.9.
Emotional subscale: 3.2 ± 1.4, 3.3 ± 1.1, 3.5 ± 1.3, 4.2 ± 1.3.
Subscale “other”: 4.1 ± 1.6, 4.2 ± 1.5, 4.2 ± 1.8, 4.8 ± 1.4.

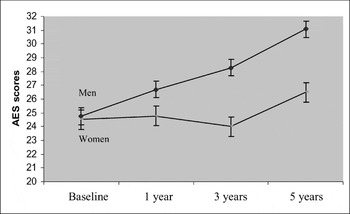
Estimated marginal means (SE) of AES scores for men and women over the 5-year assessment period.

Predictors
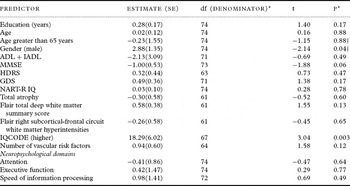
Predictors were tested in univariate mixed model analyses and significant predictors combined in a multivariate linear mixed model (see Table 2). Univariate significant predictors (fixed effects) for the AES total score were male gender and higher IQCODE.
Univariate fixed effects predictors

NB: The univariate model includes the intercept, one baseline predictor (fixed effect), time (all interactions between predictor and time were not significant and removed from the model, if not otherwise noted).
df = degrees of freedom; SE = standard error; ADL = Activities of Daily Living; IADL = Instrumental Activities of Daily Living; MMSE = Mini-mental State Examination; HDRS = Hamilton Depression Rating Scale; GDS = Geriatric Depression Scale; NART-R IQ = National Adult Reading Test Intelligence Quotient; IQCODE = Informant Questionnaire on Cognitive Decline in the Elderly
*Type III tests for fixed effects;
† significant time×gender interaction (df [denominator] = 198, F = 2.76, p = 0.04; gender (df[denominator] = 74, F = 4.19, p = 0.04);
significant time×age65+ interaction ((df [denominator] = 198, F = 3.23, p = 0.02); agegt65 (df[denominator] = 74, F = 0.00, p = 0.98).
The gender effect became non-significant when the significant time interaction was added. Additionally, there was a significant time×age > 65 interaction. Neither the baseline cognitive measures (MMSE or neuropsychological domains) nor the neuroimaging variables were significantly associated with change in apathy scores (Table 2). The significant fixed effect for higher IQCODE scores can be interpreted as suggesting that those with informant ratings of more cognitive decline prior to baseline assessment were more likely to demonstrate higher apathy scores over the following five years. There was no significant time×IQCODE interaction suggesting that change of apathy scores over time was not significantly associated with IQCODE at baseline assessment. The significant time×gender and time×age > 65 years interactions in the univariate model can be interpreted as a difference in change over time for men and women and for older versus younger study participants, with men and older participants having a greater change in apathy levels between time points.
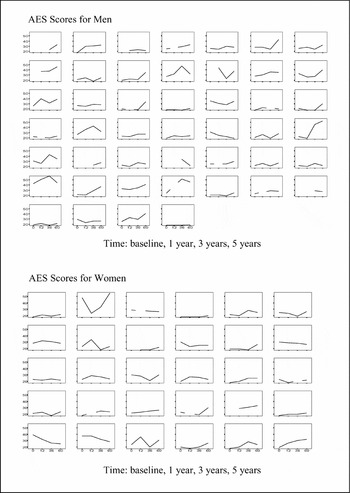
Using contrast estimates, apathy scores in men increased significantly from third to fourth assessment (t = −2.66, P = 0.01), but not from first to second or second to third assessment (t = −1.65, P = 0.10 and t = −1.38, P = 0.17, respectively; see Figures 2 and 3). In women, there was a tendency to increase from third to fourth assessment (t = −1.91, P = 0.06), but not between first and second and second and third assessments (t = −0.20, P = 0.84 and t = 0.58, P = 0.56, respectively; Figures 2 and 3).
Individual growth plots for men (upper panel) and women (lower panel).

Inspection of the individual growth plots for men and women suggest that a considerable amount of inter-individual variance cannot be explained by gender differences (see Figure 3). In the age group 65 and older, apathy scores increased from third to fourth assessment (t = −3.96, P < 0.001), but not between the other assessments (t = −1.49, P = 0.14 and t = −0.65, P = 0.52, respectively). There was no significant change between any time points for the younger age group (t = −0.23, P = 0.82; t = −0.24, P = 0.81 and t = 0.24, P = 0.81, respectively)
The multivariate model consisted of the intercept, time, gender, “age greater 65 years” (“age65+”), IQCODE, the interaction between time and gender and the interaction between time and age65+. The interactions between IQCODE and gender as well as the interactions between IQCODE and age65+ and gender and age65+ were not significant and therefore removed from the model. Time (degrees of freedom; df [denominator] = 181, F = 2.99, P = .03), IQCODE (df [denominator] = 65.34, F = 9.95, P = 0.002), the interaction between time and gender (df [denominator] = 181, F = 2.94, P = 0.04) and the interaction between time and age65+ (df [denominator] = 184.07, F = 3.26, P = 0.02) remained significant predictors.
We examined whether change in apathy was associated with change in cognition generally and with executive functioning, attention and speed of information processing specifically. The MMSE score changed significantly over the five years (F = 7.98, P< 0.001) however the change was not linear (estimated marginal means [standard error (SE)] for MMSE: 28.86 [0.12]; 29.53 [0.13]; 29.16 [0.12]; and 28.80 [0.12]). By comparison the estimated marginal means (SE) over time for apathy were: 24.72 (0.87); 25.97 (0.89); 26.59 (0.85); and 29.28 (0.84). There was no significant correlation between MMSE and apathy at any time point (r = −0.20, P = 0.11; r = −0.19, P = 0.17; r = −0.10, P = 0.40; r = −0.07 P = 0.57, respectively).
Over five years there was no significant change in executive functioning (F = 0.13, P = 0.94), attention (F = 0.06, P = 0.98) or speed of information processing (F = 0.46, P = 0.71). There was no significant correlation between any of these measures with apathy when testing bivariate correlations at each time point.
We also examined whether change in apathy was associated with change in functioning as measured by ADL+IADL scale score. These scores did not change significantly over time (P = 0.41; estimated marginal means [SE]: 13.95 [0.05]; 13.83 [0.05]; 13.85 [0.05]; and 13.86 [0.05]) indicating almost maximal functioning for this group over five years. Despite this there was a significant main effect of ADL+IADL score on AES levels, suggesting that overall people with lower ADL+IADL scores have higher apathy scores.
We considered the possibility that poor physical health could be a factor in increasing apathy scores. Cross-sectional analyses of the correlation between apathy scores at 5-year assessment and number of medications as a proxy for health status (Agostini et al., Reference Agostini, Han and Tinetti2004) was not significant (r = 0.04, P = 0.73).
The sample was too small to test the hypothesis that the process of retiring from working life is associated with increased apathy scores. Of 58 subjects who had information on occupational status at baseline and at 5 years, only five were working at baseline and retired at 5 years. Of these, three had increasing apathy scores (two males, one female) and two had stable scores (one male, one female). When these subjects were removed from the analysis, apathy still changed significantly over time.
Finally, we evaluated the associations between apathy and depression scores over time. Although GDS scores were low and did not change significantly over time (1.46 [0.23]; 0.95 [0.21]; 1.20 [0.16]; and 1.17 [0.17]; F = 1.67, P = 0.18), there were significant correlations between GDS and AES scores at baseline, at 3 years and at 5 years (r = 0.28, P = 0.03; r = 0.29, P = 0.01; r = 0.33, P = 0.004, respectively). There was also a fixed effect of GDS score on AES score (F = 13.38, P< 0.001) and a tendency for a time×GDS interaction (F = 2.44, P = .07).
We repeated the analyses after removing the potentially apathy-associated items of the GDS scale (items 2, 9, 13). The modified GDS scores were even lower and decreased significantly over time (0.83 [0.18]; 0.45 [0.15]; 0.45 [0.09]; and 0.41 [0.13]; F = , P = 0.03). There was a significant positive correlation between the modified GDS score and AES score at baseline (r = 0.28, P = 0.03), but not at 1, 3 or 5 years (r = −0.15, P = 0.29; r = 0.15, P = 0.20; r = 0.12, P = 0.31). There was a tendency for a fixed effect of modified GDS score on AES score (F = 3.78, P = 0.053) but no interaction effect.
We also calculated a regression for the difference between GDS baseline scores and GDS scores at 5 years (baseline minus follow-up) against the difference between AES baseline scores and AES scores at 5 years. There was a significant association between the scores (β = 0.27, t = 2.17, P = 0.03).
Discussion
This is the first longitudinal study reporting apathy over time in normal aging. The results indicate that apathy levels increase over a five-year period and that this change over time is more pronounced in males and persons aged over 65.
The mean level of apathy on the AES of 24.6 in this sample of healthy volunteers was similar to the 26.3 reported by Marin et al. (Reference Marin, Biedrzycki and Firinciogullari1991) in the only other study of healthy older persons using this scale. Even though these subjects were volunteers, 6.0% were defined as apathetic at baseline. If some subjects volunteered to be controls because of concern about stroke resulting from early symptoms or risk factors, we would have expected cerebrovascular risk factors to be associated with apathy; this was not the case. Studies that used the NPI apathy item reported lower rates in cognitively normal subjects, namely 2% using a cut-off greater than zero and 1.4% using a threshold of greater than four (Onyike et al., Reference Onyike2007), reflecting lack of agreement on what constitutes meaningful levels of apathy.
Apathy increased over five years with AES levels rising from 24.6 to 29.3 and rates from 6.0% to 15.8%. This increase was more apparent in men. Despite requiring a baseline IQCODE score below 3.31 to enter the study (to exclude pre-existing dementia), those with higher baseline IQCODE scores, reflecting cognitive decline in the five years beforehand, were more likely to demonstrate higher apathy scores over the following five years. The hypothesis that apathy was part of a process of decline was not supported as shown by the non-significant interaction between IQCODE and time and was not borne out by additional longitudinal analyses of general cognition, functional performance, neuropsychological performance or neuroimaging variables. Our hypotheses that change in apathy scores would be associated with impaired speed of information processing, attention and executive function and with total atrophy, deep white matter hyperintensities and right frontal subcortical circuit pathology were not supported. Nor could we demonstrate that the presence of apathy at baseline or its progression over five years was a harbinger of cognitive and functional decline as there was no significant change in either. Longer follow-up may demonstrate such associations.
Biopsychosocial factors may be determinants of increasing apathy. Could falling testosterone levels with age (Tenover, Reference Tenover1992) be responsible for the greater increase of apathy in men? No studies have directly examined the relationship between normal aging, testosterone and apathy. However, if the increase of apathy in men were due to decreasing testosterone levels we might have expected differences in mean AES scores between men and women at baseline, but they were almost identical (men 24.7 versus women 24.5). Could depression underpin the rise in apathy scores? This is unlikely as participants were not depressed and modified GDS scores actually decreased over time. A limitation to the findings, which may have been obviated by a clinician-rated depression rating scale, is that more apathetic patients may have under-rated depressive symptoms.
Could the disengagement hypothesis of aging (Cumming and Henry, Reference Cumming and Henry1961) explain the findings? Our data did not allow us to answer this. Finally, could the greater increase in men be related to retirement? Larger longitudinal studies starting before retirement would be required to test the hypothesis that apathy, especially for men, is either a consequence or a cause of retirement. Contrary to commonly held views, retirement does not categorically harm health and can even improve health in the years after retirement, despite increasing age, and can be liberating (Drentea, Reference Drentea2002; van Solinge, Reference van Solinge2007). Adverse health consequences can occur but these vary depending on the individual, whether the retirement is forced or age appropriate, how much control the worker has over his retirement, the abruptness and expectation of the change in work, personality and psychological factors, financial effects, marital support, availability of friendships outside work and health measures adopted (Palmore, et al., Reference Palmore, Fillenbaum and George1984; van Solinge, Reference van Solinge2007). Our numbers were too small to test this possibility but there did not seem to be a trend.
A limitation to this research is the lack of a gold standard against which to judge meaningfulness of apathy levels. Future research might investigate the meaning of increasing apathy scores with qualitative interviews and also interventions designed to engage people in activities and socialization and to motivate them (Verkaik et al., Reference Verkaik, Weert and Francke2005).
We also concede that the sample size is relatively small, which limits the power of the study to detect associations with neuropsychological or imaging variables, and that follow-up periods of longer than five years may yield different results. A further limitation may be that the AES was completed by informants rather than by subjects themselves. While informant ratings might provide a more valid measure of apathy levels, since by definition persons with apathy have poor insight into their own condition, this may introduce other biases (Marin, Reference Marin1990). For example, informants who are cognitively impaired, depressed or apathetic themselves may not be as sensitive to loss of signs of apathy in others. Perhaps other instruments could have better differentiated the affective, cognitive and behavioral dimensions of apathy which appeared to change at different rates over time (see Figure 1). Finally, as noted, participants were volunteers and so less likely to be apathetic at baseline and so not representative of the general population. This would have led to our findings being too conservative.
Based on his study, the first to examine change in apathy scores over time in healthy individuals, we can conclude that there was a steady increase in mean apathy levels over five years, particularly for men. By definition, apathy will be of little concern to those affected but can be distressing for other family members (McCallister, Reference McCallister2000). Whether apathy reduces quality of life for those affected or their loved ones has not been investigated and warrants further research. Research into this relatively neglected topic might consider the meaning of these changes and its burden on family members using qualitative interviews. Ways to mitigate apathy, with the goal of improving quality of life, should be pursued.
Conflict of interest
None.
Description of authors' roles
Henry Brodaty, Perminder Sachdev, Annette Altendorf and Adrienne Withall were responsible for the study concept, data analyses and preparation of the manuscript. Annette Altendorf was responsible for the statistical analyses. All authors contributed to the final version and discussion of the paper.
Acknowledgments
We would like to thank Dusan Hadzi-Pavlovic and Andrew Mackinnon for their statistical assistance. This study was performed with grants from the National Health and Medical Research Council of Australia (970922, 222842) and the Sir Vincent Fairfax Family Foundation.