


1. Introduction
The increasing exploitation of alpine regions by tourism, traffic and the power industry exposes human lives, buildings and roads to snow avalanches. Numerical simulations may be used to estimate avalanche hazard zones or to assess the efficiency of planned defence structures such as supporting constructions in potential avalanche-release areas or protective dams in run-out zones. In Austria, the equivalent of €350 million was spent on such measures between 1949 and 1989 (BMFL, 1989). Dry avalanches occur quite frequently in the Alps, and the catastrophic avalanches in Austria in 1984, 1988 and 1999 were of this type, so they have been the focus of simulation activities in Austria. The most widely used models, such as statistical run-out models (e.g. Reference Lied and BakkehøiLied and Bakkehøi, 1980), which are restricted to avalanche tracks that fit into certain categories, or one-dimensional centre-of-mass models (e.g. Reference VoellmyVoellmy, 1955), are highly simplified and cannot describe the deformation of the avalanche body. Moreover, the avalanche path has to be prescribed by the user. Therefore, more use has been made in recent years of two- and three-dimensional models based on fundamental fluid mechanics (see, e.g., Reference Gruber and MargrethGruber and Margreth, 2001). Two- (or higher-) dimensional models (two dimensions tangential to the terrain surface) can predict the avalanche track as well as lateral spreading and run-out distances and thus provide additional validation criteria.
Dry avalanches are assumed to consist of small, non-cohesive ice particles. Every avalanche starts as a dense-flow avalanche with flow densities of 100–400 kgm–3. Within this dense-flow layer, momentum is transferred by particle contacts and collisions. If the avalanche moves fast enough, particles at the surface of the dense flow are stirred up due to the shear stress induced by the velocity difference to the air above. Small particles may be kept in suspension by turbulence in the air, thus forming a powder-snow layer, which itself is accelerated by gravitation. Within the powder-snow layer, momentum is transferred by the viscosity and turbulence of the air. Direct particle interaction is assumed to be negligible since the snow volume fraction is small, of the order of 0.01 (corresponding to mixture densities up to 5 or 10 kgm–3). Since the two layers differ in the nature of their momentum transfer, separate models are used for them in SAMOS (Snow Avalanche MOdelling and Simulation). These separate models are coupled by relations describing the exchange of mass and momentum between the dense-flow and suspension layers (Fig. 1).
Dense-flow and powder-snow layers in a dry avalanche.

2. Dense-Flow Model
In the presented model, the dense-flow layer of the avalanche is assumed to behave like a quasi-statically deforming pile of granular material, sliding with velocity u on a thin shear layer at its bottom. This approach was developed by Reference Savage and HutterSavage and Hutter (1989). The shear layer is mathematically reduced to a boundary condition that relates the normal stress σ(b) to the tangential stress τ(b) at the bottom of the dense-flow layer. Within a wide range of strain rates, most granular materials show a constant, rate-independent relation between the exerted normal and tangential stresses (see, e.g., Reference StadlerStadler, 1986).This quasistatic regime is described by a dry Coulombian friction law  where δ denotes the static bed friction angle. On the other hand, the stresses caused by inter-particle collisions dominate in rapidly sheared granular flows, called the “graininertia” regime by Reference BagnoldBagnold (1954). The friction then shows a dependence upon the square of the strain rate and hence on the square of the velocity u. We combine these two limiting regimes in the boundary condition at the bottom by using the larger shear stress of both:

with ρS being the mean density in the shear layer and cdyn an empirically determined model constant. The expression tan δ can be related to the μ value and cdyn to the ξ value in the Voellmy model, for which a rich literature on empirical values exists (see, e.g., Reference Salm, Burkard and GublerSalm and others, 1990). However, the Voellmy model always adds both stress components. Physically, Equation (1) can be interpreted as an instant change between the two flow regimes at a certain threshold shear rate. The threshold increases with the quasi-static bottom pressure σ(b) which mainly results from the weight of the dense-flowlayer. As a consequence, shallow avalanches with low density will enter the grain-inertia regime at lower velocities than deep, channelled avalanches. Contrary to earlier numerical implementations of the Savage–Hutter model (e.g. Reference ZwingerZwinger, 1996), we apply a finite-volume scheme (see, e.g., Reference Gersten and HerwigGersten and Herwig, 1992, ch. 5.2.3). The conservation laws of mass and momentum are integrated over a material control volume V(t) that moves with the avalanche (Lagrangian formulation), yielding
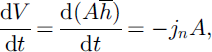

for a local coordinate system with direction i = 1 parallel to the velocity vector and direction i = 3 normal to the terrain surface (Fig. 2). In these relations ρD denotes the bulk density of the dense-flow layer, which is assumed to be constant, ū1; ū2 the velocity components tangential to the terrain surface, gi the acceleration due to gravity, A the base area, σij the stress tensor (neglecting σ12; see end of section), nj the lateral surface normal of a volume element V(t), h̄ the dense-flow layer height measured normal to the terrain surface, and δij the Kronecker delta (equal to 1 if i = j and 0 if i ≠ j). The mass flux from the dense layer to the powder layer is denoted by jn (see section 4). @A denotes the boundary line of the base area A of the control volume, and the integrals in the second term on the righthand side of Equation (3) sum up all the forces acting on the lateral boundaries of the volume over the avalanche depth and base area boundary line. dl is an element of the boundary line. b is the terrain surface coordinate in direction i = 3. Since the ratio of the height to the length of the dense-flow layer is very small, terms of order 3/2 or smaller were dropped after a dimensional analysis of the full equations, according to Reference Savage and HutterSavage and Hutter (1989). Equations (2) and (3) provide a system of three differential equations for the three volume-averaged variables: the tangential velocities  and the flow depth
 The hydrostatic pressure distribution
Lagrangian mass element in the dense-flow layer.

has to be modified for the centripetal acceleration due to the curvature  of the surface in flow direction (note that direction 1 is always locally chosen to coincide with the flow direction). The pressure at the bottom then reads

By applying the Mohr–Coulombian bed friction at the bottom, the normal components of the stress tensor at the bottom are related by earth pressure coefficients K(i):

The earth pressure coefficients are trigonometric functions of δ and of the internal friction angle ϕ of the granular material, depending on whether the volume element is stretched or compressed (see Reference ZwingerZwinger, 2000, for the detailed relations used in SAMOS; earth pressure coefficients have been used in snow avalanche simulations since 1966 (Reference SalmSalm, 1966)). The off-diagonal components are neglected except for  It is further assumed that the stresses linearly drop with increasing x3 to zero at the free surface. These assumptions are used to determine the integral in Equation (3).
3. Powder-Snow Model
The powder-snow layer of the avalanche is considered a suspension of ice particles in air. This suspension can attain velocities of up to 100ms–1and flow depths of tens of metres. Reynolds numbers are therefore very high and the flow of the suspension can be regarded as highly turbulent (see, e.g., Reference Scheiwiller and HutterScheiwiller and Hutter, 1982; Reference TescheTesche, 1987). To handle the turbulent flow, the fundamental mass and momentum balances are averaged, as usual in turbulent fluid dynamics: quantities are split into a mean part (indicated by overbars) and a fluctuating part (primed). Density-weighted averaging is applied (Favre averaging; cf. Reference Schlichting and GerstenSchlichting and Gersten, 1997). After averaging, only the mean variables remain in the linear terms. In the higher-order terms, fluctuation variables remain which are modelled as explained later. A fixed coordinate system is used (Eulerian approach). The averaged mixture density is given by

with ρA and ρP being the intrinsic densities of air and snow particles, respectively, and c̄ the particle volume fraction. Density variations in the air caused by compressibility are neglected. The particles are assumed to move with the same velocity as the air, except for a small, constant settling velocity uSi of the order of 1 ms–1, which is only considered in the particles mass balance to account for sedimentation. The mass balance for the mixture then reads

The snow-particles mass balance

includes turbulent dispersion and sedimentation of the particles on the righthand side. Note that the dispersion also accounts for air entrainment as the computational domain includes the air outside the powder cloud. The mixture momentum balance is given by

with the viscous stresses τij being very small compared to the apparent turbulent stresses  . The fluctuation terms containing the primed quantities are modelled according to the widely used k-ε model (Reference Launder and SpaldingLaunder and Spalding, 1972; Reference RodiRodi, 1980), written for the mixture (Reference ZwingerZwinger, 2000). Boundary conditions for velocity and turbulence quantities at the ground and at the interface with the dense-flow avalanche are prescribed by wall functions derived from boundary-layer theory. The interface to the dense-flow layer is assumed to be a rough wall moving with the velocity of the dense flow. Entrainment of snow from the resting snow cover is not considered.
4. Transition Model
In contrast to the Sl-1d model (Reference IsslerIssler, 1998), no detailed model is formulated for the re-suspension/saltation layer. Instead, this layer is collapsed to an interface, and a simple transition model is developed that couples the dense-flow and powder-snow layers by prescribing the transfer of snow mass between the two parts. In the case of neutrally buoyant fine dispersed particles, particle mass transport is approximately analogous to turbulent momentum transport in the boundary layer above the dense-flow surface (Reynolds analogy; Reference Gersten and HerwigGersten and Herwig, 1992). Reference Parker, Fukushima and PantinParker and others (1986) applied a similar concept to submarine turbidity currents. We adapt this analogy by adding the empirical turbulent Schmidt number σt to account for the buoyancy of the snow particles and the slip velocity between fluid and particles. Hence, for the particle mass flux normal to the dense-flow surface we write

with the differences between the wall and free stream values (in the sense of boundary-layer theory)  of velocity and
 of particle volume fraction. In the equation,
 is the shear stress between the dense-flow and powder-snow layers. We relate the Schmidt number to the size of the suspended snow particles, dp. We use the empirical relation

with a constant value for dref. This yields a mass flux inversely proportional to the particle size, and roughly accounts for the fact that large particles will not follow the air motion closely and are more difficult to re-suspend.
5. Numerical Implementation and Application
To solve the Lagrangian dense-flow layer equations (2) and (3), the snow mass is divided into small mass elements, typically 5000–20 000. The Voronoi cells (cf. Reference EdelsbrunnerEdelsbrunner, 1987, ch. 13) of the element centre points projected into the xy-plane define the geometrical shape of the elements. The Voronoi cells are constructed as a geometric dual of the well-known Delaunay triangulation. Each Voronoi cell is guaranteed to be convex and contains all points in space closer to the corresponding centre point than to any other element centre. A fixed mass is assigned to each moving element (except for the mass transferred to the powder layer), so that mass conservation is guaranteed. To satisfy Equation (2), the flow depth is obtained by dividing the element mass by density and the bottom area of the Voronoi cell. The dense-flow equations are integrated over each cell, and the resulting discretized equation system is solved for a given time-step, using an explicit integration scheme. The bottom wall shear for each element (Equation (1)) is computed with the velocity at the end of the time-step, however, to stabilize the numerical scheme. After that, the element centres are moved according to the calculated velocities. The Voronoi cells are recalculated at each time-step. To obtain a stable solution, the time-step must be chosen so that the moved centre points stay within their original Voronoi cell. (This corresponds to requesting a Courant number below 1in Eulerian schemes.) Whereas Eulerian schemes use a fixed grid covering the entire avalanche track from the release areas to the deposition areas, the Lagrangian scheme has the advantage that the cells are tied to the avalanche mass and no cells are “wasted” for the area not covered by avalanche mass at a given time-step.
To solve the three-dimensional powder-snow-layer equations (8–10) a standard computational fluid dynamics code (FIRE/SWIFT, developed by AVL Advanced Simulation Technologies; www.avl.com) was adopted. A fixed (Eulerian) grid formed by structured layers of hexahedral volume elements above the terrain surface is used. After discretization according to the finite-volume approach, which guarantees mass conservation, the equation system is iteratively linearized and solved numerically for each time-step by applying the SIMPLE algorithm (Reference PatankarPatankar, 1980). The SIMPLE scheme is fully implicit in time and hence is stable for arbitrarily large time-steps, unless the grid geometry is extremely distorted. For coupled real-scale simulations, a time-step of 0.05 s for the dense-flow model and of 0.1s for the powder model is typically applied, i.e. the dense-flow model performs two sub-steps for one powder step.
Since calculation of the dense-flow part is quasi-two-dimensional, the central processing unit (CPU) time required is mainly determined by the number of nodes in the three-dimensional powder avalanche grid. Typically a few hours of CPU time are required on a high-end personal computer. A graphical user interface for importing digital terrain models and specifying input data as well as for post-processing is part of SAMOS. As input for a simulation the following are needed:
a digital terrain model,
the outline of the release areas together with snow depths and densities,
optionally outlines and properties of areas with increased friction (vegetation, etc.),
the density of the flowing dense snow,
the characteristic size of the suspended snow particles, and
numerical parameter as time-steps and spacing for the dense-flow and powder-layer grids.
The same values for all the constants (δ = 16°, ϕ = 35°, cdyn = 0.022, dref = 10–4m) in the model are used for all simulation runs, and the user cannot change these values. The friction values are in good agreement with those reported in the Swiss Guidelines (Reference Salm, Burkard and GublerSalm and others, 1990).
6. Results
Validation of avalanche simulation models is difficult because high-quality field data are rare and, if available, are often restricted to run-out distances and snow fracture lines in the release area. For a simulation run, all the input data mentioned above must be specified. While a good-quality terrain model is often available, data on the release areas must be extrapolated from fracture lines. Specifically the lower boundaries of the release areas are determined based on estimation. For a validation, simulations of a few observed recent catastrophic avalanche events in Austria were conducted. Three different calculations are presented briefly.
6.1. Madlein avalanche, Ischgl, AustrianTyrol, 1984
In 1984 the Madlein avalanche killed one person in the village of Ischgl and caused considerable damage. A total snow mass of 76 kt was released at an altitude of 800–1400m above the village (the release areas were reconstructed from photographs after the event: Reference HufnaglHufnagl, 1988; Reference HagenHagen, 1997). Figure 3 shows the terrain model (contour lines all 10m) and the release areas. Different snow heights were prescribed for the different areas. Nearly half of the snow mass was suspended during the event, according to the simulation. Figure 4 shows the observed deposition area (bold line; Reference HufnaglHufnagl, 1988) and calculated deposition heights (shaded; 0–5m) of the dense-flow part, which agree fairly well. Raster lines are shown all 100m, contour lines all 10m. Figure 5 shows the calculated maximal powder-snow impact pressures 2.5 m above ground (0–5 kPa) together with the observed area of powder-snow impact (bold line; Reference HufnaglHufnagl, 1988). The agreement is not so good as for the dense-flow part. Differences may be due to simplifications in the model and uncertainties in the initial conditions, but one also has to remember that the observations, especially concerning the powder-snow part, are of a qualitative rather than quantitative character.
Madlein 1984: terrain model and release areas.
Madlein 1984: observed (bold line) and computed dense-flow deposition (depth 0–5 m); terrain contour line interval 10 m.
Madlein 1984: observed (bold line) and computed powder-snow impact area (pressure 0–15 kPa); terrain contour line interval 10 m.
6.2. Galtür, Austrian Tyrol, 1999
In February 1999 a large dry avalanche killed 37 people in the village of Galtür and caused considerable damage. The local snow precipitation during this month amounted to 245 mm (water value), which was 422% of the average value in the preceding years. The release area was estimated by the Austrian Federal Service for Torrent and Avalanche Control, Tyrol, based on observations. Including also the meteorological data reported above, an estimated total snow mass of 136 kt was released at an altitude of 300– 1300 m above the village. Figure 6 shows the terrain model (contour lines all 10 m) and the outline of the release areas (again with different prescribed snow heights) used for the simulation. The central part of the computed dense flow crosses a road and hits the village, as was observed in reality. The computed pressure at the position of actually destroyed buildings is of the order of 100 kPa. Figure 7 shows in detail the computed deposition depths of the dense-flowavalanche mass (scaling 0–5m) together with the outline of the observed deposition zone. The agreement is very satisfactory. Deviations in the vicinity of buildings are to some extent due to their very inaccurate representation in the terrain model. Figure 8 shows computed maximal pressures resulting from the powder-snow part of the avalanche at a height of 2.4 m above ground (scaling 0–25 kPa) together with the observed zone of powder-snow impact. Computed powder pressures are much lower than dense-flow pressures both in simulation and in reality, but the area affected may be much larger. According to the simulation, 36 t of the total 136 kt of snow released was transferred to the powder-snow part of the avalanche.
Galtür 1999: terrain model and release areas.
Galtür 1999: computed (depth 0–5 m) and observed deposition (observed deposition outline indicated by inner bold line; outer bold line indicates observed powder-snow impact area).
Galtür 1999: computed (pressure 0–25 kPa) and observed powder-snow impact area (observed deposition outline indicated by inner bold line; outer bold line indicates observed powder-snow impact area).
6.3. Evaluation of avalanche effects on a tunnel bridge
A specific application of the SAMOS model resulted from the need to assess the effect of the powder part of an avalanche on the statics of a tunnel bridge. The tunnel bridge was constructed 40 m above the bottom of the Gröber avalanche path to improve safety along the Bschlaber access road in Außerfern, Tyrol. The design of the bridge allowed a maximum static load of 20 kPa. The simulation was done as if the tunnel bridge had been absent. During the computed impact phase the powder part attained a maximum speed of 70 ms–1with a maximum dynamic pressure (ρu2) of 17.5 kPa at the bridge site, which was below the permissible limit. However, since no large avalanche has hit the tunnel bridge yet, a validation was not possible.
7. Conclusion
The results obtained with the coupled dense-flow–powder-snow model SAMOS show fairly good agreement with observations, if one takes into account the uncertainties in the input data and the simplicity of the transition model used. The model is clearly superior to statistical or one-dimensional centre-of-mass models for some uses since it predicts avalanche paths and impact pressures in two and three dimensions, respectively, and treats the dense-flow and powder-snow layers as separate parts. It also allows the assessment of protective constructions such as avalanche dams or retaining walls, as these enter the calculation by modifying boundary conditions (modified terrain model) or initial conditions (reduced release areas). However, simpler models also have their uses since their smaller resource requirements (CPU time, memory) permit extensive parameter studies, probabilistic modelling, etc. SAMOS is used routinely at the Austrian Federal Service for Torrent and Avalanche Control for hazard zoning and for designing defence structures.
The model can be improved by more detailed analysis of the re-suspension zone between the dense-flow and powder-snow layers. The current model does not account for all physical effects (e.g. saltation or hindered settling). A model for erosion of material directly from the resting snow cover has recently been incorporated into SAMOS but needs to be validated. Since a model can only be as good as the experimental or field data it is validated with, the availability of reliable and accurate data from laboratory experiments or real-scale field measurements puts a severe constraint on the development of more advanced avalanche-simulation models.
Acknowledgements
The avalanche simulation model SAMOS was developed for the Ministry for Agriculture and Forestry of Austria, in cooperation with the Austrian Federal Service for Torrent and Avalanche Control and the Institute for Avalanche Research, Innsbruck, Austria. Theoretical investigations and numerical implementations in cooperation with the Technical University of Vienna, Austria, were coordinated and supervised by A. Kluwick. Meteorological data were provided by R. Gabl, Zentralanstalt für Meteorologie und Geodynamik, Wetterdienststelle Innsbruck.



