

Introduction
The incidence of obesity has reached alarming proportions worldwide. In the United States in the period 2009–2010, ∼36% of adults and 17% of adolescents were determined to be obese (BMI > 30).Reference Flegal, Carroll, Ogden and Curtin1 With regard to the role of environmental factors in the development of obesity, epidemiological and animal studies have demonstrated that altered nutritional experiences during early periods of life (intrauterine and suckling periods) predispose to development of metabolic disorders in later life of the offspring.Reference Fernandez-Twinn and Ozanne2 The underlying basis for this phenomenon is the overlap of critical windows of development with the altered dietary experience. Developmental plasticity enables adaptive responses in target tissues (referred to as developmental origins of adult-onset diseases), which prove to be detrimental in the long run.
Catch-up growth imposed on low birth weight offspring due to malnourishment during fetal development has been linked to the development of adult-onset metabolic disorders such as obesity, type 2 diabetes and cardiovascular diseases.Reference Guilloteau, Zabielski, Hammon and Metges3 As development of organs continues into the immediate postnatal period, this period can also be subject to developmental/metabolic programming effects. Rats overnourished during the suckling period by reduction in litter size demonstrated increased growth rate, hyperinsulinemia and hyperleptinemia.Reference Plagemann, Davidowa, Harder and Dudenhausen4 Conversely, rat pups nursed by dams that were subject to calorie restriction during lactation are protected against development of obesity on a high-fat (HF) diet in later life.Reference Palou, Pico and McKay5 In our laboratory, we have shown that artificial rearing of newborn rat pups on a high-carbohydrate (HC) milk formula in their immediate postnatal life resulted in the immediate onset of hyperinsulinemia, which persisted in the post-weaning period. Weaning onto a standard laboratory rodent chow accompanied by hyperphagia increased body weight gains and adult-onset obesity.Reference Srinivasan and Patel6, Reference Patel and Srinivasan7
The hypothalamus is the primary relay center controlling feeding behavior and body weight homeostasis. In rodents, the maturation of the central nervous system begins in utero and continues into the suckling period.Reference Grove, Allen, Grayson and Smith8 Altered nutritional experiences during these periods have been shown to impact on the hypothalamic energy homeostasis circuitry. For example, adult offspring of mothers fed on a HC diet during gestation and lactation demonstrated an exaggerated response for Npy release to intraperitoneal injection of 2-deoxyglucose.Reference Kozak, Richy and Beck9 Rats overnourished in the suckling period (reduction of litter size) demonstrated several alterations in the hypothalamic regulation of appetite including development of leptin and insulin resistanceReference Davidowa and Plagemann10, Reference Davidowa and Plagemann11 and altered cellular development of neurons.Reference Plagemann, Harder and Rake12
Epigenetic modifications of key genes are being considered as plausible mechanisms for early life programming effects due to nutritional stimuli/insults.Reference Newell-Price, King and Clark13 Epigenetic modifications can potentially alter the state of chromatin structure, thereby determining the fate of its transcription ability without altering DNA sequences. Two important methods by which the chromatin structure can be epigenetically altered are histone tail modification (such as acetylation, methylation, etc.) and DNA methylation.Reference Ho and Tang14
In the HC rat model, the HC dietary modification overlaps with the period of postnatal neuronal development. In an earlier study, the impact of the HC dietary intervention on the hypothalamic energy homeostasis circuitry was shown by altered expression of specific genes (such as Npy and Pomc) involved in this pathway.Reference Srinivasan, Mitrani and Sadhanandan15 In order to investigate the mechanisms supporting such an observation, in the present study, we have investigated promoter methylation and histone tail modifications (acetylation and methylation) associated with the Npy and Pomc genes involved in the hypothalamic appetite-regulating pathway. Our results indicate that the HC dietary modulation in neonatal female rats could result in an altered epigenetic regulation of genes involved in the hypothalamic energy homeostatic mechanism and that such changes could contribute to the development of adult-onset obesity in the HC female rat.
Methods
Animal protocols
The University at Buffalo's Animal Care Program and the Laboratory Animal Facilities are fully accredited by the Association for Assessment and Accreditation of Laboratory Animal Care (AAALAC) International. The Institutional Animal Care and Use Committee at the University at Buffalo approved all animal protocols. Pregnant Sprague-Dawley rats obtained from Charles River Laboratories (Wilmington, MA, USA) were housed individually under controlled conditions of temperature, humidity and 12 h light/dark cycles with ad libitum access to a standard rodent laboratory chow (Harlan Teklad, Madison, WI, USA) and water. One day after birth, pups from several mothers were pooled and randomly distributed to nursing mothers (11 pups/dam). On postnatal day 4, rat pups were assigned to either the control or experimental group. The pups in the control group were nursed by their dams (mother-fed; MF). For the HC (experimental) group, female pups were artificially reared on the HC milk formula as described earlier.Reference Srinivasan and Patel6 Briefly, intragastric cannulas were introduced into female pups under mild anesthesia (isoflurane inhalation). Buprenorphine (0.02 mg/kg body weight) was administered as an analgesic. The pups were housed individually in Styrofoam cups floating in a 37°C water bath and were fed at the rate of 0.45 kcal/g body weight/day. The pups, cannulas and the cups were cleaned on a daily basis. The calorie composition of the HC milk formula was: carbohydrate 56%, fat 20% and protein 24%. The calorie composition of rat milk was: carbohydrate 8%, fat 68% and protein 24%. In several of our earlier studies, we have demonstrated that both female and male HC rats responded similarly to the HC dietary intervention during the suckling period.Reference Mitrani, Srinivasan, Dodds and Patel16–Reference Srinivasan, Dodds and Ghanim18 Both female and male HC rat pups demonstrated chronic hyperinsulinemia and adult-onset obesity. Further, we have shown that female HC rats transmitted the HC phenotype to their offspring and that this was due to fetal development in the HC intrauterine environment. In this study, we wanted to decipher mechanisms supporting development of obesity in the HC female rats so that in subsequent studies similar experiments could be conducted in the offspring to establish that such mechanisms are programmed in the offspring and support the development of obesity in them.
In our earlier studies on the HC rat model, an experimental control was investigated to establish that the artificial rearing protocol per se does not contribute to programming for the HC phenotype (chronic hyperinsulinemia and adult-onset obesity) by using a HF milk formula whose macronutrient composition was similar to that of rat milk.Reference Srinivasan, Mitrani and Sadhanandan15–Reference Vadlamudi, Kalhan and Patel17, Reference Hiremagalur, Vadlamudi, Johanning and Patel19, Reference Vadlamudi, Hiremagalur and Tao20 Intragastric cannulas were introduced into neonatal rats and these rat pups were artificially reared on the HF milk formula in a manner identical to that of the HC pups. The metabolic phenotypes of the HF pups were similar to that of MF (control) pups, thereby clearly establishing that the artificial rearing protocol observed in our studies does not induce any programming effects such as hyperinsulinemia, hyperphagia, adult-onset obesity, generational effect, etc.Reference Srinivasan, Mitrani and Sadhanandan15–Reference Vadlamudi, Kalhan and Patel17, Reference Hiremagalur, Vadlamudi, Johanning and Patel19, Reference Vadlamudi, Hiremagalur and Tao20 The programming effects observed in our model are primarily due to the high-carbohydrate content in the HC milk formula. As the metabolic phenotype of the MF and HF is similar, we used only MF rats as controls.
On postnatal day 24, the cannulas were cut close to the skin and the pups were weaned on to a standard rodent laboratory chow ad libitum. For some studies, MF and HC pups were anesthetized with ketamine/xylazine (75 mg and 10 mg/kg body weight) and sacrificed on postnatal day 16. We have used day 16, instead of day 24, as a time point for pups because on day 16 both HC and MF pups are on milk diets only (MF pups on mother's milk and HC pups on HC milk formula). During the period from the postnatal days 16–24, MF pups increasingly nibble on lab chow (available in a cage), resulting in a mixed meal-derived (milk plus chow) calories. In contrast, HC pups derive daily calories from HC milk formula only up to the postnatal day 24. To avoid this dietary change in MF pups and its possible effects, we used 16-day-old MF and HC rats. For other studies, MF and HC female pups were weaned onto a standard laboratory rodent chow on postnatal day 24 with ad libitum access to food and water and sacrificed on postnatal day 100, after being anesthetized with ketamine/xylazine. For both 16- and 100-day-old MF and HC rats, the hypothalamus was dissected and frozen in liquid nitrogen as described earlier.Reference Srinivasan, Mitrani and Sadhanandan15 Trunk blood was collected, serum separated and stored at −80°C for analysis of insulin and leptin. Serum insulin and leptin concentrations were measured by radioimmuno assays using commercially available kits as per the manufacturer's instructions (Linco Research, St Louis, MO, USA).
Gene expression and quantitative real-time polymerase chain reaction (PCR)
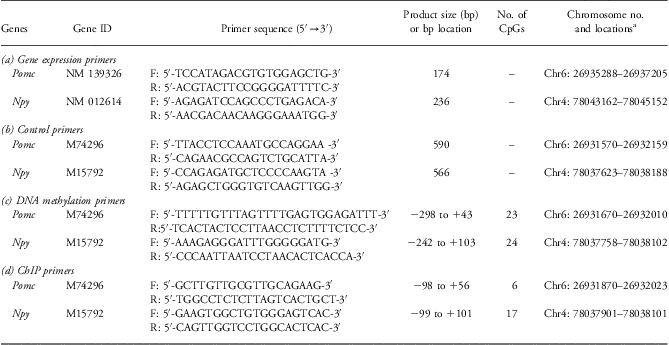
Total RNA was extracted from the tissue blocks with TRIzol Reagent (Invitrogen, Carlsbad, CA, USA). The iScript cDNA kit from Bio-Rad (Hercules, CA, USA) was used to make cDNAs according to the manufacturer's protocol. One micro gram of RNA was used for cDNA synthesis, and it was suspended in a final volume of 100 μl. Two microliters of each tissue cDNA preparation were used for quantitative PCR. PCR primers were designed to bridge the exon–intron boundaries within the genes of interest to exclude possible contamination by genomic DNA. SYBR Green primers were designed by the web program (Primer 3 input: http://frodo.wi.mit.edu/primer3/) and obtained from Integrated DNA Technologies (Coralville, IA, USA). Quantitative PCRs were run on a Bio-Rad MyiQ Cycler for SYBR Green according to the manufacturer's recommendations. The reverse transcription reactions were performed in triplicate with tissue RNA from eight animals and the results were normalized to the 18S mRNA levels by using the 2ΔΔCT method.Reference Livak and Schmittgen21 The sequences of the primers used are shown in Table 1a.
Primer sequences

aChromosome assembly: UCSC Genome Browser on Rat, November 2004 (Baylor 3.4/rn4)
Analysis of methylation of CpG residues proximal to the promoter region
Amplification and cloning of control regions
Tail genomic DNA, which is used as a control for methylation analysis, was extracted from one normal rat using DNeasy Blood and Tissue kit as per the manufacturer's instructions (Qiagen Sciences, Valencia, CA, USA), and the control regions for Pomc and Npy were amplified using control primers shown in Table 1b. Genomic fragments were amplified and purified with QIAquick Gel Extraction Kit (Qiagen Sciences). Amplified and purified DNA was ligated into the vector pCR2.1-TOPO and then transformed into chemically competent Escherichia coli TOP10F′ cells, using the TOPO TA Cloning Kit (Invitrogen). Transformants were assayed for the presence of recombinant inserts by the blue/white colony phenotype and plasmids were extracted with QIAprep Spin Miniprep Kit (Qiagen Sciences). Inserts were checked with the restriction enzyme EcoRI (Fermantas, Glen Burnie, MD, USA). Plasmid DNAs containing the promoter inserts were methylated with SssI (CpG) methylase (New England Biolabs, Ipswich, MA, USA) in the presence of S-adenosylmethionine and was considered as 100% methylated DNA. Serial dilutions of methylated DNA with unmethylated DNA were made in order to get 0–100% control DNA preparations. Control DNA preparations were separately spiked with 750 ng of human genomic DNA at a one genome equivalent level and treated with bisulphite. Bisulfite-treated modified primers used for PCR amplification are shown in Table 1c. PCR amplification conditions were according to the method mentioned in the quantitative methylation analysis section.
Sequenom MassARRAY quantitative methylation analysis
Sequenom MassARRAY quantitative methylation analysisReference Ehrich, Nelson and Stanssens22 was performed using the MassARRAY Compact System (www.sequenom.com). This system utilizes mass spectrometry (MS) for the detection and quantitative analysis of DNA methylation using homogeneous MassCLEAVE (hMC) base-specific cleavage and matrix-assisted laser desorption/ionization time-of-flight (MALDI-TOF) MS. The hypothalamic DNA sample (750 ng) obtained from 16- and 100-day-old MF and HC rats was treated with sodium bisulfite using the EZ DNA methylation kit (Zymo Research, Orange, CA, USA) according to the manufacturer's instructions. The primers were designed using Methprimer software.Reference Li and Dahiya23 Each reverse primer had a T7-promotor tag for in vitro transcription (5′- cagtaatacgactcactatagggagaaggct-3′) and the forward primer was tagged with a 10mer to balance TM (5′aggaagagag-3′). Amplification of 10 ng of bisulfite-treated DNA (one DNA sample from each animal) was performed using HotStar Taq Polymerase (Qiagen Sciences) in a 5 μl reaction volume using PCR primers at a 200 nM final concentration. The sequences of the primers used are shown in Table 1. PCR amplification was performed with the following parameters: 95°C for 15 min hot start, followed by denaturing at 94°C for 20 s, annealing at 58°C for 30 s, extension at 72°C for 1 min for 45 cycles and final incubation at 72°C for 3 min. After Shrimp Alkaline Phosphatase treatment, 2 μl of the PCR products was used as a template for in vitro transcription and RNase A cleavage for the T-reverse reaction as per the manufacturer's instructions (Sequenom hMC, San Diego, CA, USA). The samples were desalted and spotted on a 384-pad SpectroCHIP (Sequenom Inc.) using a MassARRAY nanodispenser (Sequenom), followed by spectral acquisition on a MassARRAY Analyzer Compact MALDI-TOF MS (Sequenom). The resultant methylation calls were performed by the EpiTyper software v1.0 (Sequenom) to generate quantitative results for each CpG dinucleotide or an aggregate of multiple CpG nucleotides.
Histone code modification: chromatin immunoprecipitation (ChIP) assay
ChIP assays were performed as per manufacturer's instructions (Millipore, Billerica, MA, USA). Briefly, frozen 16-day-old rat hypothalamic tissues (∼0.2 g) were chopped into small pieces and cross-linked for 15 min at room temperature with formaldehyde at a final concentration of 1% (w/v) in phosphate-buffered saline (PBS) containing protease inhibitor cocktail II (Millipore). The samples were subsequently washed twice with PBS containing protease inhibitors cocktail II, and the tissue samples were then homogenized using a Dounce homogenizer. After centrifugation, the pellets were resuspended in SDS lysis buffer (50 mM Tris–HCl at pH 8.1, 1% SDS, and 10 mM EDTA) containing protease inhibitors cocktail II and sonicated to generate 200–1000 bp DNA fragments using a Branson Sonifier (Branson Ultrasonics, Dunbury, CT, USA) 450 sonicator with 20 pulse for 15 sec and 1 min rest (output control set at 3, 30% duty cycle). Cleared lysates were split into three fractions: input fraction, positive antibody fraction and negative antibody fraction. Lysates were incubated overnight at 4°C with the following antibodies: histone H3 (acetyl K9) (ab10812, ABCAM, Cambridge, MA, USA), histone H3 (dimethyl K9) (ab1220, ABCAM) and rabbit control IgG (ab46540, ABCAM). DNA-protein complexes were washed, DNA was eluted and crosslinking was reversed by heating to 65°C overnight after addition of 10 μg of RNase A. The complex was then treated with proteinase K at 45°C for 2 h, extracted with phenol/chloroform/isoamyl alcohol and subsequently precipitated overnight at −80°C in the presence of 20 μg of glycogen. The DNA concentration in the complex was determined by Nanodrop at OD260 nm. The DNA sequence in the ‘input’ and immunoprecipitated (IP) samples were quantified relative to each other by quantitative real-time PCR using ChIP primers shown in Table 1d. ChIP results are reported as % input values, which were calculated as follows:  $$\[--><$>\% {\rm{Input:}}\,({{{\rm{2}}}^{ - \Delta {{C}_{\rm{t}}}{}\left[ {{\rm{Normalized}}\,{\rm{IP}}} \right]}} )\times {\rm{1}}00\% <$><!--$$
, normalized IP values were obtained by subtracting IP values from input values.
Statistical analysis
Results are expressed as means ± s.e.m. of eight animals in each group. Statistical analysis of the differences between the means of MF and HC groups was performed using Student's t-test (Sigma Plot 12.0, Systat Soft Ware Inc., San Jose, CA). This software also analyzes the data using normality test (Shapiro–Wilk) and equal variance test before performing Student's t-test. P < 0.05 was considered significant.
Results
Body weights and serum insulin and leptin levels of MF and HC rats
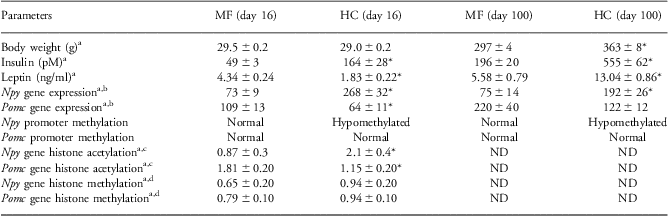
In the present study, no significant changes in body weights were observed for 16-day-old HC female pups as compared with MF pups (Table 2). However, the body weights of 100-day-old HC female rats were significantly higher compared with 100-day-old MF female rats (Table 2). A three-fold increase in serum insulin levels was seen in 16-day-old HC female rats compared with age-matched MF female rats (Table 2). Serum insulin levels were also significantly higher in 100-day-old HC female rats (Table 2). Serum leptin levels were significantly reduced in 16-day-old HC rats (Table 2) and increased significantly in adult HC rats (Table 2). All of the above observations are consistent with our previously reported results for HC rats.Reference Srinivasan, Mitrani and Sadhanandan15, Reference Srinivasan, Dodds and Ghanim18
Summary of body weights, hormonal levels, gene expression and DNA and histone modifications of MF and HC rats at two different ages
MF, mother-fed; HC, high-carbohydrate; ND, not determined.
aMean ± s.e.m. (n = 8).
bΔΔC t values.
cFold enrichment (at H3K9ac).
dFold enrichment (at H3K9dm).
*P < 0.05 compared to age-matched MF group.
Gene expression and analysis of methylation status of specific CpG residues in the proximal promoter regions of Npy and Pomc genes
Alterations in the mRNA levels in the enriched hypothalamic regions from 16- and 100-day-old MF and HC female rats were determined using real-time quantitative RT-PCR analysis. Npy mRNA levels in the hypothalami of 16- and 100-day-old HC rats were significantly increased by 3.66- and 2.57-fold, respectively (P < 0.05) as compared with age-matched MF rats (Fig. 1a and 1b). Pomc mRNA levels were reduced to 0.58-fold (P < 0.05) and 0.55-fold (ns, P = 0.057), respectively, in the hypothalami of 16- and 100-day-old HC rats compared with age-matched MF rats (Fig. 1c and 1d). On the basis of these observations, DNA methylation analysis of specific CpG dinucleotides in the promoter region of the Npy and Pomc genes was performed in order to determine whether this mechanism contributed to the altered expression of Npy and Pomc in 16-day-old and adult HC female rats. TRANSFAC, version 8.3,Reference Farre, Roset and Huerta24, Reference Messeguer, Escudero and Farre25 was used to identify putative transcription factor binding sites in the promoter regions that were analyzed for CpG methylation status for these two genes.
Expression of Npy and Pomc mRNAs in the hypothalami of 16- and 100-day-old HC and age-matched MF rats. Total RNA was used to quantify the mRNA expression level of the genes. Expression levels were normalized using 18S as an internal standard and fold difference was calculated using the comparative C t method (ΔΔC t). Individual samples were run in triplicate and data are means ± s.e.m. of eight animals. *P < 0.05 compared with MF. (a, b), expression of Npy in 16- and 100-day-old rats. (c, d), expression of Pomc in 16- and 100-day-old rats. The ranges of gene expression levels were as follows. Npy: 16-day-old MF: from 53 to 124; 16-day-old HC: from 100 to 395; 100-day-old MF: from 49 to 126; 100-day-old HC: 133 to 303. Pomc: 16-day-old MF: from 51 to 275; 16-day-old HC: from 29 to 134; 100-day-old MF: from 146 to 303; 100-day-old HC: from 100 to 155. MF, mother-fed; HC, high-carbohydrate.
Npy promoter methylation patterns in the hypothalamus of MF and HC rats
DNA methylation analysis was performed on a segment of the proximal Npy promoter (−242 to +103 bp) harboring 24 CpG dinucleotides (Fig. 2a). Analysis of CpG dinucleotides in this promoter segment indicated that overall methylation levels in both MF and HC were very low (highest level of methylation was ∼4%). The overall methylation of the Npy promoter ranged from 0% (CpG dinucleotides 5 and 7) to about 3.2% (CpG dinucleotides 1–2) in 16-day-old rats and 0.16% (CpG dinucleotide 5) to 4.33% (CpG dinucleotides 1–2) in 100-day-old rats (Fig. 2b and 2c). Although the degree of methylation observed in this study was low for the Npy promoter, which is consistent with the observations of others,Reference Plagemann, Harder and Brunn26 significant differences could be observed in the degree of methylation for specific CpG dinucleotides. In the case of 16-day-old rats, at CpG positions 1–2, the degree of methylation was reduced, although the observed differences did not reach statistical significance (P < 0.06) and at CpG 21 the degree of methylation was significantly increased (P < 0.05) in the HC hypothalamus (Fig. 2b). In contrast, in the hypothalamus of 100-day-old HC rats, CpG positions 1–2, 16–17, 20 and 24 showed a significant reduction (P < 0.05) and CpG position 21 showed a significant increase (P < 0.05) in methylation compared with corresponding CpG positions in the Npy promoter in the hypothalamus of age-matched MF rats. It was not possible to perform correlation analyses on the CpG methylation pattern of Npy promoter region vs mRNA levels as we used different rats for gene expression and DNA methylation analyses.
(a) Sequence map of the Npy promoter region showing the position of the CpG dinucleotides, the binding sites for the putative transcription factors and the location of the primers used. Black ovals indicate the CpG dinucleotides that were analyzed and open ovals indicate the CpG dinucleotides that were not analyzed. The number above the CpG dinucleotides indicates its position in the promoter sequence and the number below the CpG dinucleotides indicates its assigned number in the promoter region analyzed. The black bars indicate the approximate positions of transcription factor binding sites. Solid lines indicate the positions of modified primers for DNA methylation analysis and dashed lines indicate the positions of ChIP primers. (b, c) Methylation analyses for the Npy promoter in MF and HC hypothalami from 16- and 100-day-old rats, respectively. Data are means ± s.e.m. (n = 8). *P < 0.05 compared with MF. MF, mother-fed; HC, high-carbohydrate.
Pomc promoter methylation pattern in the hypothalamus of MF and HC rats
The CpG island of the Pomc promoter region was identified using Genome Browser (http://genome.UCSC.edu/cgi-bin/hgTracks?hgsid=331796361) [UCSC Genome Browser on Rat November 2004 (Baylor 3.4/rn4) Assembly; CpG Islands – Andy Law, masked sequence]. This analysis showed a region of 1416 bp CpG island that includes the proximal 5′ promoter region, exon 1 and a portion of the first intron. We focused on a 341 bp promoter region that ranged from +43 to –298 bp harboring 23 CpG dinucleotides (Fig. 3a). The methylation analyses were performed in DNA samples obtained from the hypothalami of 16- and 100-day-old MF and HC female rats. The degree of methylation ranged from 2% (CpG 16) to about 27% (CpG 17–18) in 16-day-old rats and 1% (CpG 16) to 36.2% (CpG 17–18) in 100-day-old rats (Fig. 3b and 3c). There were no significant differences in the levels of methylation in any CpG dinucleotide between the two groups of rats for both 16- and 100-day-old rats, indicating that the altered expression of the Pomc gene was not regulated by changes in the methylation status of any of the CpG dinucleotides in the region investigated in the HC rat.
(a) Sequence map of the Pomc promoter region showing the position of the CpG dinucleotides, the binding sites for the putative transcription factors and the location of the primers used. Black ovals indicate the CpG dinucleotides that were analyzed and open ovals indicate the CpG dinucleotides that were not analyzed. The number above the CpG dinucleotides indicates its position in the promoter sequence and the number below the CpG dinucleotides indicates its assigned number in the promoter region analyzed. The black bars indicate the approximate positions of transcription factor binding sites. Solid lines indicate the positions of modified primers for DNA methylation analysis and dashed lines indicate the positions of ChIP primers. (b, c) Methylation analyses for the Pomc promoter in MF and HC hypothalami from 16- and 100-day-old rats, respectively. Data are means ± s.e.m. (n = 8). *P < 0.05 compared with MF. MF, mother-fed; HC, high-carbohydrate.
Histone acetylation of Npy and Pomc genes
Histone modifications play a vital role in the overall state of gene expression or repression.Reference Portela and Esteller27 Histone acetylation is associated with active chromatin, whereas deacetylation results in repressed chromatin structure.Reference Jaskelioff and Peterson28 In order to determine the effect of HC diet on the acetylation status of core histone H3, ChIP analyses were performed in the hypothalami of 16-day-old MF and HC rats, with the Npy (200, −99 to +101 bp) and Pomc (154, −98 to +56 bp) promoter regions covering the regions of CpG islands. Figure 4 shows the H3K9 acetylation in the Npy and Pomc promoters. For Npy, histone acetylation was increased significantly (P < 0.05) in HC rats compared with MF rats. The fold enrichments were 0.87 and 2.09, respectively, in MF and HC rats (Fig. 4, upper panel). For Pomc, the histone acetylation was decreased significantly (P < 0.05) in 16-day-old HC rats compared with age-matched MF rats. The fold enrichments for this analysis were 1.81 and 1.15, respectively, in MF and HC rats (Fig. 4, lower panel).
Histone acetylation at the Npy and Pomc gene promoter regions. ChIP analysis of cross-linked chromatin from the hypothalami of 16-day-old MF and HC rats analyzed with antibody to histone H3 (acetyl K9). Input indicates PCR product of DNA that were not subject to immunoprecipitation with primary antibody. IgG indicates negligible PCR product in the absence of antibody to H3K9. The relative amounts of acetylated H3K9 bound Npy (upper panel, left) and Pomc (lower panel, left) promoters were measured by real-time PCR and normalized to input DNA. Data are means ± s.e.m. (n = 8). *P < 0.05 compared with MF. MF, mother-fed; HC, high-carbohydrate.
Histone methylation of Npy and Pomc genes
In contrast to histone acetylation, histone H3K9 methylation plays a crucial role in heterochromatin formation and transcriptional silencing.Reference Jenuwein29 The levels of dimethyl H3K9 for the Npy and Pomc genes were assessed by ChIP assays in the hypothalami of 16-day-old MF and HC rats. Unlike H3K9 acetylation, H3K9 methylation in both the Npy and Pomc genes was not significantly different between MF and HC rats (Fig. 5). The fold enrichments in the Npy gene were 0.64 and 0.94 in MF and HC rats (Fig. 5, upper panel), whereas in the Pomc gene the enrichments were 0.79 in MF and 0.94 in HC rats (Fig. 5, lower panel).
Histone methylation at the Npy and Pomc promoter regions. ChIP analysis of cross-linked chromatin from the hypothalami of 16-day-old MF and HC rats analyzed with antibody to histone H3 (dimethyl K9). Input indicates PCR product of DNA that were not subject to immunoprecipitation with primary antibody. IgG indicates negligible PCR product in the absence of antibody to H3K9. The relative amount of histone H3 (dimethyl K9) antibody bound to the Npy (upper panel, left) and Pomc (lower panel, left) promoters was measured by real-time PCR and normalized to input DNA. Data are means ± s.e.m. (n = 8). *P < 0.05 compared with MF. MF, mother-fed; HC, high-carbohydrate.
Discussion
In mammals, the major epigenetic mechanisms that play roles in the transcription of genes are alterations in DNA methylation and histone tail modifications. Recent evidence suggests that DNA methylation patterns in specific genes could be changed in response to an altered environment during early developmental periods (fetal and suckling).Reference Hanson, Godfrey, Lillycrop, Burdge and Gluckman30, Reference Lillycrop and Burdge31 For example, several reports have shown that the nature of the maternal diet causes alterations in the methylation of non-imprinted genes, which impinge on the development of the offspring. Consumption of a HF diet by mice during pregnancy resulted in hypomethylation of CpG dinucleotides in the promoter region of dopamine and opioid-related genes in the hypothalamus of the offspring. The increased expression of these genes induced preference of palatable foods in these mice.Reference Vucetic, Kimmel, Totoki, Hollenbeck and Reyes32 Maternal protein restriction in rats has been reported to cause hypomethylation of glucocorticoid receptor 110 and the peroxisome proliferator-activator receptor α promoter with enhanced expression of the corresponding genes in the liver of the offspring.Reference Lillycrop, Slater-Jefferies and Hanson33 Supplementation of the maternal diet with methyl donors in the agouti mouse has been shown to shift the coat color of the offspring from yellow (agouti) to brown (pseudoagouti) with protection from the obesity phenotype.Reference Dolinoy, Das, Weidman and Jirtle34, Reference Waterland and Jirtle35
In order to determine whether DNA methylation plays a role in the observed altered expression of Npy and Pomc genes in the HC female rat, the methylation status of CpG dinucleotides in the proximal promoter region of these genes was investigated. Such an analysis indicated that for the Npy gene there is an early response, which persisted into adulthood. In 16-day-old HC female rats, a decrease in the degree of methylation for CpG dinucleotides 1–2 was observed, although the difference did not reach statistical significance (Fig. 2b). Interestingly, this change persisted in the adult HC female hypothalamus (Fig. 2c). The significant increase in methylation of CpG dinucleotide 21 observed in the hypothalamus for 16-day-old HC rats for Npy gene persisted in the adult HC hypothalamus. The observed hypomethylation at CpG dinucleotides 16–17, 20 and 24 is consistent with the increased expression of Npy observed in the HC rat (Fig. 1). Our findings show that a change in CpG methylation occurs at the DNA level in HC female pups, and this change is retained in adult HC female rats. Additional changes observed at the DNA level in adult HC rats may be due to neuronal resistance developed toward insulin and/or leptin. It is of interest to note that although the observed levels of DNA methylation for the Npy gene are low, it appears that such changes could be functionally relevant in terms of expression of Npy in the HC hypothalamus. For example, Champagne et al.Reference Champagne, Weaver and Diorio36 showed that in the case of the central nervous estrogen receptor promoter CpG methylation levels below 1% were not only detectable but also functionally relevant. In another study, Bagot et al.Reference Bagot, Zhang and Wen37 reported that postnatal maternal care affected the expression of the hippocampal glutamate receptor 1 gene and that this was regulated by differences in the methylation of specific CpG residues in the proximal promoter region. The degree of methylation was below 7% for a majority of CpG residues investigated, but even within this range the authors derived a correlation between gene expression and DNA methylation status. The protective effect of leptin during the suckling period on the development of obesity in response to a HF diet in the post-weaning period has been attributed to changes in the promoter methylation of Pomc gene. Although the degree of change was modest, these authors suggested that changes in the methylation of specific CpG dinucleotides in the Pomc promoter showed a correlation to Pomc expression in the hypothalamus of these rats.Reference Palou, Pico and McKay5
An analysis of transcription factors binding in the Npy promoter region identified potential binding sites for several transcription factors (Fig. 2a). CpG dinucleotides 1–2 is located within a Sp1-binding site. Although the role of Sp1 binding to this site in the Npy promoter is not known, it has been reported that activation of the Sp1-binding site is necessary for mediation of leptin effects on Pomc expression.Reference Therrien and Drouin38 Although we could not identify any transcription factor directly binding to CpG dinucleotides 16–17, it is observed that they are located within the regions wherein ATF-3 and AP-1 are hypothesized to bind. Similarly, CpG dinucleotiede 21 is located between the two regions where E2F has been postulated to bind in the Npy proximal promoter region. CpG dinucleotides 20 and 24 are putative-binding sites for transcription factors E2F and p53. To the best of our knowledge, the role of these putative transcription factors in the regulation of expression of Npy is unknown. Our results suggest that the observed alterations in the methylation status of specific CpG dinucleotides in the HC female hypothalamus could possibly modify the ability of specific transcription factors to bind to the promoter and thereby contribute to the increased expression of Npy as observed in the HC female rat. In the small litter (SL) rat model, investigating the effects of overnourishment during the suckling period, no changes were observed either in the expression or in the methylation pattern of the CpG dinucleotides in the proximal promoter region of Npy in 21-day-old rats.Reference Plagemann, Harder and Brunn26 In another study, it was shown that although postnatal caloric restriction induced altered expression of hypothalamic neuropeptide genes such as Npy, Agrp and Pomc, such changes did not correlate with changes in the DNA methylation patterns in the promoter regions of these genes.Reference Shin, Dai, Thamotharan, Gibson and Devaskar39
In the case of the Pomc gene, a significant reduction in gene expression was observed in the hypothalamus from 16-day-old HC female pups. There was a trend for reduction in mRNA levels in 100-day-old HC female rats, which did not reach a significant level (P < 0.06) (Fig. 1d). In an earlier study, we found a significant reduction in the levels of Pomc mRNA in the hypothalami from both 12-day-old and adult HC rats compared with their age-matched MF rats.Reference Srinivasan, Mitrani and Sadhanandan15 In both 16- and 100-day-old HC rats, there were no significant changes in the methylation status in any of the CpG dinucleotides investigated in the proximal promoter region of Pomc. Although in the HC rat model a correlation could not be derived between the altered expression of Pomc and DNA methylation in the proximal promoter region of this gene, other studies using different animal models have suggested such a relationship. In SL rats, although there were no changes in the expression of this gene, hypermethylation of CpG dinucleotides upstream of the Sp1-binding site and in the NF-kB binding site were observed in the hypothalamus of 21-day-old SL rats, whereas the CpG dinucleotide located in the GRE-binding site (a negative regulator of Pomc expression) was hypomethylated.Reference Plagemann, Harder and Brunn26 In another rodent model, feeding of a low-protein diet to pregnant rats was shown to cause a mismatched correlation between Pomc gene expression and CpG methylation status in the offspring.Reference Coupe, Amarger, Grit, Benani and Parnet40 In the HF diet-fed obese mice, the altered expression of leptin in the adipose tissue and of Pomc and Lepr in the hypothalamus was not regulated by DNA methylation in the proximal promoter region of these genes.Reference Fan, Liu, Shen, Deckelbaum and Qi41
Histone code modifications include acetylation, methylation or phosphorylation of specific amino acid residues in the N-terminal tails of histones. Methylation of histones at specific lysine and arginine residues can change the positioning of histone–DNA interactions, which could also change the chromatin conformation and co-repressor complex formation.Reference Kouzarides42, Reference Li, Carey and Workman43 Generally, acetylation of histone, such as H3K9, results in an open chromatin structure and allows transcription.Reference Wang, Balamotis and Stevens44 Methylation of histones can positively or negatively impact transcription.Reference Pattyn, Hoebeeck and Robbrecht45, Reference Rajakumar, Thamotharan, Raychaudhuri, Menon and Devaskar46 The results from the ChIP analysis of the Npy promoter region covering the region of CpG dinucleotides in the proximal promoter region indicated increased H3K9 acetylation in the hypothalamus of 16-day-old HC female rats with no change in methylation of this lysine residue. The increased acetylation at H3K9 correlates with the increased expression of Npy in the hypothalamus of HC rat pups (Fig. 1). As methylation at H3K9 is associated with decreased gene expression, the results from the present study showing no significant changes for H3K9 methylation status also support the observed increased expression of Npy in the HC female rat. For Pomc, the histone acetylation was decreased significantly in 16-day-old HC rats compared with age-matched MF rats. However, the methylation of H3K9 was not different between the two groups of rats. These observations are in agreement with the decreased expression of this gene in the HC female rat (Fig. 1). In a sheep model investigating the effect of periconceptional maternal under nutrition, although there were no changes in the expression of Pomc in the fetal hypothalamus H3K9 acetylation was markedly increased.Reference Stevens, Begum and Cook47 In the context of silencing of the Pdx1 gene in islets of intrauterine growth restriction (IUGR) rats, it has been shown that alterations in histone tail modifications could contribute to this phenomenon. In IUGR rats, H3 and H4 in islets from fetal, 2-week-old and 6-month-old rats were markedly deacetylated. Furthermore, H3K4 methylation was decreased and H3K9 methylation was increased at the Pdx1 proximal promoter.Reference Park, Stoffers, Nicholls and Simmons48 In the muscle of IUGR rats, diminished Glut4 expression was shown to be associated with histone post-translational modifications such as de-acetylation of H3K14 by recruitment of histone deacetylase and enhanced methylation of H3K9 and increased recruitment of heterochromatin protein 1a. These processes partially inactivated postnatal and adult IUGR Glut4 gene transcription.Reference Raychaudhuri, Raychaudhuri, Thamotharan and Devaskar49
The results from this investigation indicate that the HC dietary modulation in neonatal female rats can impact on the epigenetic regulation of target genes involved in body weight homeostasis during the period of the dietary modulation and thereby provide the basis for the development of obesity in adulthood of these rats. To keep the diet isocaloric, a change in the level of one of the macronutrients (carbohydrate in the present study) necessitates a change in another macronutrient (fat in the present study). As the immediate effect of the HC milk feeding to pups is the development of hyperinsulinemia within the first 24 h,Reference Haney, Raefsky-Estrin, Caliendo and Patel50 the increased availability of carbohydrates is considered to predominantly contribute to the development of the HC phenotype in our HC rat model. Furthermore, on the basis of our previous observations on HF rats, cannulation and maternal separation do not appear to contribute to the development of the HC phenotype. However, this conclusion does not exclude the possibility that other disorders, particularly of neurological origin, could be present in the HC rat as a consequence of the artificial rearing protocol. Detailed dissection of the histone code modification and DNA methylation patterns of several genes involved in the development of metabolic disorders in target tissues such as hypothalamus, adipose tissue, etc. are needed for a comprehensive understanding of the molecular basis for the development of obesity in the HC rat model.
Acknowledgments
The authors thank Dr Gail Willsky, Dr Satrajit Sinha and Dr Murray Ettinger from the Department of Biochemistry for critical reading of the manuscript. M.S.P. conceived and directed the study, and discussed the results with all the participants of this study. M.S.P., S.M. and M.S. jointly designed the experiments. S.M. and M.S. carried out the animal experiments and collected samples. S.M. performed ChIP analysis and preparation of samples for methylation studies. D.J.S. designed the primers for methylation analysis, contributed significantly to the execution of the methylation experiments and assisted in the analysis of the data. The major contribution for writing of this manuscript was from M.S. and M.S.P. All authors read and approved the final version of the manuscript.
Financial Support
This work was supported by National Institute and Diabetes and Digestive and Kidney Diseases Grant DK-61518 (MSP).
Conflicts of Interest
The authors declare that there is no conflict of interest.
Ethical Standards
The authors assert that all procedures contributing to this work comply with the ethical standards approved by the Association for Assessment and Accreditation of Laboratory Animal Care (AAALAC) International, and all animal protocols (protocol # BCH 06064N) have been approved by the Institutional Animal Care and Use Committee (IACUC) at the University at Buffalo.