Introduction
Despite the ecological richness of the region (i.e. fertile, flat land with sufficient rainfall for half the domestic agricultural production), a high prevalence of micronutrient deficiency (e.g. iron, vitamin A and zinc) has frequently been reported among individuals who live in the Terai (lowland) region of Nepal. Dreyfuss et al. (Reference Dreyfuss, Stoltzfus, Shrestha, Pradhan, LeClerq and Khatry2000) showed that the prevalence of iron deficiency anaemia was 64% among pregnant women in Terai. The 1998 National Micronutrient Status Survey (Gorstein et al., Reference Gorstein, Shreshtra, Pandey, Adhikari and Pradhan2003) showed that the incidence of subclinical vitamin A deficiency (<0.70 μmol/l) was 40% among Terai children, while Dreyfuss et al. (Reference Dreyfuss, Stoltzfus, Shrestha, Pradhan, LeClerq and Khatry2000) showed that 54.2% of pregnant women in Terai had a low serum retinol concentration (<1.05 μmol/l). Zinc deficiency (serum zinc concentration <7.6 μmol/l) was found in 75.1% of pregnant women in rural Nepal (Christian et al., Reference Christian, Jiang, Khatry, LeClerq, Shrestha and West2006).
Several food consumption surveys have been conducted to clarify the dietary factors related to these micronutrient deficiencies. Hirai et al. (Reference Hirai, Nakayama, Sonoda, Ohno, Okuno and Nagata1993) conducted a 24-hour recall survey of participants aged 10–72 years and found that animal meat, fish and eggs were the major sources of iron, zinc and vitamin A in the Terai region, but that these were rarely consumed. Green leafy vegetables, which are potential micronutrient sources, were consumed, but not regularly because of their seasonality of production. A 24-hour recall survey in the Terai region by Ohno et al. (Reference Ohno, Hirai, Sato, Ito, Yamamoto, Tamura and Shrestha1997) of participants aged 10–68 years confirmed limited intakes of meat, fish and eggs; the energy intake of the respondents was adequate because they consumed sufficient amounts of boiled rice.
The 24-hour recall method has been widely used in national food consumption surveys in developed countries such as the US (Buzzard, Reference Buzzard and Willett1998), Finland (Anttolainen et al., Reference Anttolainen, Javanainen, Kaartinen, Lahti-Koski, Lauronen and Männistö1998) and Australia (McLennan & Podger, Reference McLennan and Podger1995). This method enables estimation of population-level intakes of energy and nutrients (Biro et al., Reference Biro, Hulshof, Ovesen, Amorim and Cruz2002). However, based on the authors' experience in the Terai region, quantification of the intake of spices (e.g. turmeric, coriander, garlic, cumin and chilli), salt, oil or tiny aquatic/terrestrial animals, which characterize the rural Terai diet, is difficult. In addition, fish curry, a common Terai dish into which all fish caught by household members are put, varies by household depending on the availability on any given day of the individuals who fish. The size and shape of cooking tools, eating plates and bowls also varies among households, which makes quantification of dietary intake using the 24-hour recall method inaccurate. Direct weighing is more appropriate for the estimation of micronutrient and mineral intake in such settings.
The present study targeted the Mushar and Tharu, two indigenous ethnic groups who live in the same community in the Terai region but with quite different subsistence activities; the authors conducted one-day food weighing for 114 individuals. The results provide basic information on the Terai diet and reveal poor intakes of several micronutrients (Dreyfuss et al., Reference Dreyfuss, Stoltzfus, Shrestha, Pradhan, LeClerq and Khatry2000; Gorstein et al., Reference Gorstein, Shreshtra, Pandey, Adhikari and Pradhan2003; Christian et al., Reference Christian, Jiang, Khatry, LeClerq, Shrestha and West2006). Dietary and nutritional intakes were also investigated by sex and ethnicity to elucidate the dietary structure stemming from socio-cultural, economic and ecological constraints in the region. A feasible mitigation strategy to address micronutrient deficiency in the region is also discussed.
Methods
Study area and participants
The participants in the present study were selected from the inhabitants of Parsauni village in the Sakhawaparsauni Village Development Committee (VDC) of Parsa District in the Terai region, Nepal. Parsauni village was selected because it was judged, according to the discussion with administrators and nutritionists who worked in the region, to be of average socioeconomic status and have the ‘typical’ diet of the Terai region. Of the 6411 de jure population in the VDC, 374 were Mushar and the remainder were mostly Tharu (CBS, 2001). Small Mushar mud huts and Tharu houses were located along the drainage channel in which waste water from each hut/house flowed into the agricultural fields outside the village.
Gautam & Thapa-Magar (Reference Gautam and Thapa-Magar1994) stated that the Mushar migrated from Uttar Pradesh (India) to the Terai region 700 years ago, looking for wild food resources in the Terai forest. Most of the Mushar do not own land or domesticated animals, and they usually work in the agricultural fields of the Tharu. They also hunt small animals such as rats and bandicoots, and collect edible snails (genus Pila), small fish, crabs and wild vegetables.
The Tharu – the indigenous people of the region – usually own their land and use it to cultivate rice and wheat and to rear domestic animals (e.g. goats, cows and buffalo). Generally speaking, the economic status of the Tharu is higher than that of the Mushar.
The participants in this study were 55 Mushar adults (28 males and 27 females) and 59 Tharu adults (26 males and 33 females) ranging in age from 20 to 60 years. The Mushar participants were adult members of 24 households that were selected randomly from 78 Mushar households in Ward 2 of Parsauni Village. The Tharu participants were members of 27 households that comprised the lowest economic group among the non-Mushar households in Ward 2. Of the 27 Tharu households, 24 identified themselves as Tharu; three could not identify their ethnicity, but reported that they shared a cultural background with the Tharu. They too were categorized as Tharu households. The lowest economic group was identified during the authors' survey in July and August 2005. This process was necessary to target Tharu individuals to minimize the effects of the difference in economic status between the Mushar and Tharu, which could have been a significant factor in their dietary deficiencies (Parajuli et al., Reference Parajuli, Umezaki and Watanabe2009). Despite these efforts, economic indicators remained higher among the Tharu than among the Mushar participants.
An 8-week dietary survey was conducted by one of the authors (RPP) between March and April 2006. It was the dry season, which produces limited amount of green leafy vegetables and fruits, although seasonality in the consumption of staple foods was reported. The author RPP lived in the village throughout this period.
Dietary survey
Following direct observations of the participants' usual dietary patterns, one-day weighed food records (WFRs) were obtained for 114 participants. The author (RPP) and a well-trained nutritionist from Helen Keller International, Kathmandu, with the assistance of two health workers, visited each subject household at 06:00h, just after the participants awakened, and observed them until they finished dinner on that day (usually 20:00h). All foods consumed by the participants were weighed in the house using electronic scales (KD-171 and KD-200; TANITA, Tokyo, Japan). All materials used for cooking were weighed after they had been processed (i.e. inedible parts had been peeled and removed). The total amount and each serving of cooked dishes were also weighed. All waste and remains were weighed when the participants finished eating. The author paid special attention to the process of weighing the spices, salt, sugar and oil consumed by the participants. This was performed by weighing the container of each item before and after cooking. Individual-level consumption of each spice, salt, sugar and oil was estimated on the basis of the amount of dish consumed by each person.
The energy, protein, fat, carbohydrate, iron, calcium, phosphorus, vitamin A, thiamine, riboflavin, niacin and vitamin C intakes of the participants were estimated using Nepali food composition tables (Ministry of Agriculture, 1994). For some items, alternative references were used: for soya cake and dried fish, the East Asian Food Composition Table 1972 (FAO, 1972) was used; for chicken meat, the ASEAN Food Composition Table (Puwastien et al., Reference Puwastien, Burlingame, Raroengwichit and Sungpuag2000) was used; and for wheat flour, the USDA National Nutrient Database for Standard Reference Release (US Department of Agriculture, 2008) was used. Intakes of zinc were estimated using standard food composition tables from Japan (Kagawa, Reference Kagawa2005) and the ASEAN Food Composition Table (Puwastien et al., Reference Puwastien, Burlingame, Raroengwichit and Sungpuag2000). Intakes of selenium and iodine were estimated using the East Asian Food Composition Table (FAO, 1972).
Through the direct-weighing survey, sixteen types of dishes and three types of beverages representing the daily diet of the subject community were recognized. Thus, for the 51 household heads (24 Mushar and 27 Tharu), who were nominated by the household members, the consumption frequencies of sixteen types of dishes and three types of beverages were further quantified through an interview survey, and the daily frequency of consumption was calculated.
Evaluation of nutritional adequacy and statistical analysis
After the energy and nutrient intakes were calculated for each individual, the participants were aggregated into four groups: Mushar males (n=28), Mushar females (n=27), Tharu males (n=26) and Tharu females (n=33).
To evaluate the nutritional adequacy of the intakes of each group, the following references were used: for protein, energy, thiamine, riboflavin, niacin, vitamin A, vitamin C, iron and calcium, the age- and sex-specific recommended daily allowance (RDA) for Nepali (Ministry of Agriculture, 1994); for zinc, selenium and iodine, the sex-specific recommended nutrient intake (RNI) for adults presented by FAO/WHO (FAO/WHO/UNU, 2001); and for phosphorus, the age- and sex-specific RDA presented by Institute of Medicine in the US (Institute of Medicine, 1997). The RDA and RNI used in the present paper were set as individual-level requirements plus two standard deviations. Therefore, when the average intake of a group equalled the RDA/RNI, 97.5% of the individuals met the nutritional requirements (Whitehead, Reference Whitehead1992; Shrimpton, Reference Shrimpton2002; Tarasuk, Reference Tarasuk2006). Energy was the only exception: the population-level RDA for energy was equal to the individual-level requirement (Barba & Cabrera, Reference Barba and Cabrera2008).
Because the intakes of each micronutrient were correlated with the energy intakes (p<0.01) in the present population, each micronutrient intake was divided by the energy intake to calculate the ‘energy-adjusted intake' (Willet & Stampeer, Reference Willet, Stampeer and Willet1998; Sudo et al., Reference Sudo, Sekiyama, Maharjan and Ohtsuka2006) for the sex and ethnicity comparisons. Protein intake was divided by the body weight of the participant in kilograms to calculate the ‘protein intake per kg body weight’ (FAO/WHO/UNU, 1985).
Anthropometric measurements were conducted following standard methods. The mid-upper-arm circumference (MUAC) was measured with a flexible tape to the nearest 0.1 cm. Triceps and sub-scapular skin-fold thicknesses were measured twice with a Holtain caliper (Holton, Briberian, UK) to the nearest 0.2 mm and averaged. The MUAC and triceps and scapular skin-folds were used as indicators of nutritional status.
Statistical analyses were performed using SPSS version 11.5 (SPSS, 2004). Ethnic differences in the household daily consumption frequency of dishes/beverages were investigated using the Mann–Whitney U-test, while ethnic and sex differences in anthropometric indicators, daily individual intakes of food items and protein intake and energy-adjusted micronutrient intake per kg body weight were examined by two-way analysis of variance (ANOVA).
Results
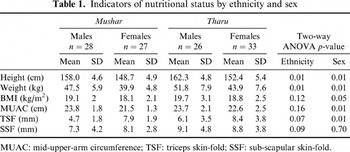
Table 1 shows the indicators of nutritional status of the participants by ethnicity and sex. Anthropometric indicators at national level are available only for females aged 15–49 years (e.g. Demographic and Health Survey conducted in 2001). According to the report, mean height, weight and body mass index (BMI) were 150.2 cm, 46 kg and 20.3 kg/m2 respectively. Tharu females in the present study were taller than the national average, while Mushar females were shorter. Both Tharu and Mushar females were lighter than the national average. The BMIs were also lower than the national average in both Mushar and Tharu. It can be speculated that the participants of the present study were slightly leaner than the national average. The prevalence of individuals whose BMI was less than 18.5 (defined as ‘underweight’ according to the World Health Organization (WHO, 2004)) was 38, 62, 35 and 65% for Mushar males, Mushar females, Tharu males and Tharu females, respectively. A statistically significant association was found between sex and BMI. Although the Tharu were taller and heavier than the Mushar, nutritional indicators (BMI, MUAC, TSF and SSF) were not associated with the ethnicity of the participants. The MUAC and TSF were associated with the sex of the participants.
Indicators of nutritional status by ethnicity and sex

MUAC: mid-upper-arm circumference; TSF: triceps skin-fold; SSF: sub-scapular skin-fold.
Based on the author's direct observations during this survey period, the daily diet of the Mushar and Tharu was characterized by the consumption of large amounts of rice and side dishes, a combination that made the meal more palatable. Almost every morning, members (mostly females) of the Mushar households went to a nearby river to collect small fish, edible snails, crabs or edible wild plants; all of them were cooked for fish curry. Thus, the fish curry ingredients varied day by day depending on the amount of wild animals collected by the household members, and between households depending on how many members of the household could collect wild animals/vegetables. Lentil dal (soup made from lentils) and vegetable curry (usually consisting of potato and wild vegetables) were common side dishes for the Mushar. It is notable that the collected food items (small fish, edible snails or crabs) were not consumed as separate dishes.
The Tharu usually ate bean dal (soup made from beans), vegetable curry (usually consisting of potato, okra and pumpkin leaves), boiled vegetables (mostly leafy ones mixed with chilli and salt) and gundruk/sinki soup (made from fermented and dried leaves of Brassica rape, Raphanus sativus and B. nigra). Wild animals/plants were occasionally purchased from Mushar households.
Dal and curry were cooked by adding plenty of water to a small amount of lentils/beans or fish. Thus, although the volume of consumption of such dishes was large, the actual amount of food items consumed was tiny.
Both groups emphasized ethnic differences in their preferences for seasonings and spices. The Mushar preferred to use mustard seed, garlic and chilli, while the Tharu preferred onion, oil and cumin. Both favoured coriander seed. The seasonings and spices were potential contributors of micronutrients (e.g. turmeric for iron; garlic and onion for selenium), although the bioavailability of nutrients originating from seasonings and spices rich in phenolic compounds needs to be considered (e.g. Tuntipopipat et al., Reference Tuntipopipat, Judprasong, Zeder, Wasantwisut, Winichagoon and Charoenkiatkul2006).
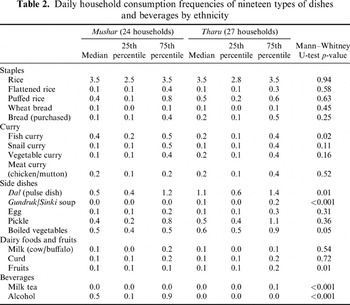
Table 2 shows the consumption frequencies of nineteen types of dishes and beverages that represent the daily diet of the subject community. In agreement with the author (RPP) observation, the comparison by ethnicity revealed that the Mushar consumed fish curry more frequently than did the Tharu, while the Tharu consumed boiled vegetables, gundruk/sinki soup, dal, milk tea and fruits more frequently than did the Mushar. While the Mushar reported the consumption of alcohol, the Tharu did not because their cultural norms prohibited it.
Daily household consumption frequencies of nineteen types of dishes and beverages by ethnicity

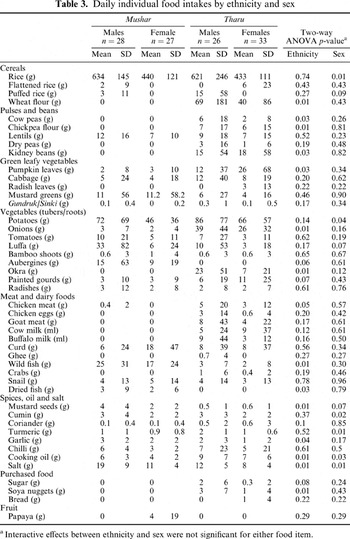
Table 3 shows the daily individual dietary intakes of the Mushar and Tharu participants. In total, the Mushar consumed 29 food items during the observation period, while the Tharu consumed 40. The Tharu consumed larger amounts of wheat flour, cow peas, chickpea flour, kidney beans, pumpkin leaves, onions, okra, chicken meat, cooking oil and soya nuggets (i.e. processed soya product) than did the Mushar participants. In contrast, the Mushar consumed more wild fish, mustard seeds, garlic and salt than did the Tharu. Males consumed more rice, potatoes, cumin, turmeric, cooking oil and salt than did females.
Daily individual food intakes by ethnicity and sex

a Interactive effects between ethnicity and sex were not significant for either food item.
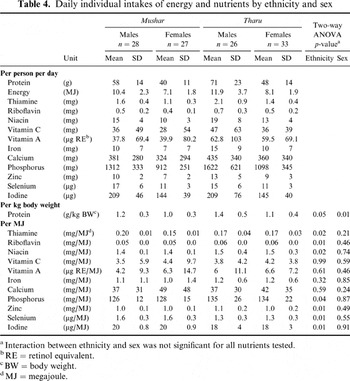
Table 4 shows the energy and nutrient intakes of the participants by sex and ethnicity. The Tharu consumed more thiamine, riboflavin, niacin, phosphorus and zinc than did the Mushar, while the Mushar consumed more selenium and iodine than did the Tharu (p<0.05). The Tharu consumed more protein per kg body weight than did the Mushar (p<0.05). The energy-adjusted intake of all micronutrients did not differ by sex, while the protein intake (per kg body weight) was higher in males than in females.
Daily individual intakes of energy and nutrients by ethnicity and sex

a Interaction between ethnicity and sex was not significant for all nutrients tested.
b RE=retinol equivalent.
c BW=body weight.
d MJ=megajoule.
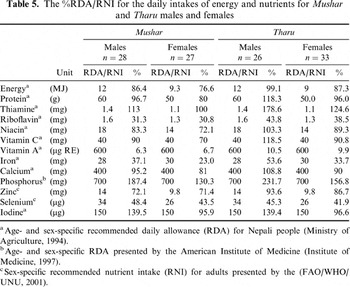
Table 5 shows the %RDA/RNI of energy and nutrients for all four groups. Intakes of vitamin A, iron, riboflavin and selenium were less than 50% of the RDA/RNI in all groups. The %RDA/RNI for the intake of zinc was approximately 70% for the Mushar and 85–95% among the Tharu. Although the Mushar and Tharu each had their own ethnic identity and food culture, the overall pattern of %RDA/RNI did not differ between the two groups.
The %RDA/RNI for the daily intakes of energy and nutrients for Mushar and Tharu males and females

a Age- and sex-specific recommended daily allowance (RDA) for Nepali people (Ministry of Agriculture, 1994).
b Age- and sex-specific RDA presented by the American Institute of Medicine (Institute of Medicine, 1997).
c Sex-specific recommended nutrient intake (RNI) for adults presented by the (FAO/WHO/UNU, 2001).
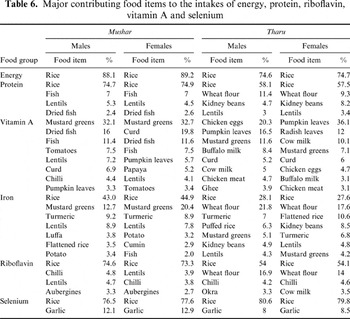
Table 6 shows the food items that contributed to the intakes of energy, protein and micronutrients that were below 50% of the RDA/RNI (i.e. vitamin A, iron, riboflavin and selenium). Rice was the major source of energy, protein, iron and riboflavin. In both sexes of the Mushar, more than 85% of the energy, more than 70% of the protein and riboflavin, and more than 40% of the iron came from rice. This tendency was similar among the Tharu, but to a lesser extent. Rice contributed more than 70% of the energy intake, more than 50% of the protein and riboflavin intakes, and more than 25% of the iron intake among the Tharu.
Major contributing food items to the intakes of energy, protein, riboflavin, vitamin A and selenium

The food items that contributed to the deficient micronutrients (listed in Table 6) are potential sources of micronutrients because the ecological feasibility of their production has been shown. To address micronutrient deficiency in the region, it should be considered whether people have ways of increasing their consumption of such foods or whether other food items that are economically and environmentally suitable to the Terai region are introducible.
Discussion
The findings of the present paper can be summarized as follows. (a) The diet in the Terai region was characterized by a large amount of rice consumed with a tiny amount of curry or dal as a side dish. (b) Intakes of vitamin A, iron, riboflavin and selenium were found to be less than 50% of the RDA/RNI irrespective of ethnicity or sex (with the exception of iron intake among Tharu males). (c) Intakes of thiamine, riboflavin, niacin, phosphorus and zinc were higher in the Tharu than in the Mushar, while intakes of selenium and iodine were higher in the Mushar than in the Tharu; however, the nutritional significance of these differences was found to be slight. (d) Protein intake (per kg body weight) was lower in females than in males, while energy-adjusted micronutrient intakes did not differ by sex.
Micronutrient deficiency in the Terai region
A rice-dominant diet might be one reason for the insufficient micronutrient intake in the Terai region. Fish, meat or vegetables cooked with spices and oil as curry or dal are served at most meals, but the amount of such food items consumed is tiny. Such dietary habits stem from people's belief that their dishes should consist of a lot of rice and something that will encourage its consumption. Supplementary foods such as milk, fruits or tea are also consumed, but only on limited occasions. Such dietary patterns result in sufficient intakes of nutrients that are abundant in rice (i.e. energy and protein), but inadequate intake of nutrients that rice contains in only small amounts.
The poorest intake was found to be that of vitamin A. The intake levels (37.8–62.8 μg RE per day) in the present study were far lower than the RDA/RNI for Nepali adults (600 μg RE per day) (Ministry of Agriculture, 1994). The levels were lower than those reported in previous studies in the southern Terai (485 μg RE for males and 469 μg RE for females; Ohno et al. (Reference Ohno, Hirai, Sato, Ito, Yamamoto, Tamura and Shrestha1997)) or in the eastern Terai (422 μg RE for males and 355 μg RE for females; Hirai et al. (Reference Hirai, Nakayama, Sonoda, Ohno, Okuno and Nagata1993)). A noteable difference between the present study and previous studies was found in the amount of milk and dairy foods consumed. In the present study, the daily individual consumption of dairy foods never exceeded 20 g, while previous studies reported an amount of more than 200 g in eastern Terai (Hirai et al., Reference Hirai, Nakayama, Sonoda, Ohno, Okuno and Nagata1993) and more than 100 g in the southern Terai (Ohno et al., Reference Ohno, Hirai, Sato, Ito, Yamamoto, Tamura and Shrestha1997). Because 100 g of milk contains 225 μg RE of vitamin A, if people consumed 200 g of milk every day in addition to their current diet, the %RDA of vitamin A would reach 85%. Another reason for the low intake of vitamin A might be the lower consumption of green leafy vegetables, as reported in the Health Survey of Nepal in 1965–1966 (Brown et al., Reference Brown, Worth and Shah1968).
The intakes of iron, riboflavin and selenium among the participants were also less than the RDA/RNI for Nepali. This finding is comparable with previous data from the Terai region (Brown et al., Reference Brown, Worth and Shah1968; Moser et al., Reference Moser, Reynolds, Acharya, Howard, Andon and Lewis1988; Hirai et al., Reference Hirai, Nakayama, Sonoda, Ohno, Okuno and Nagata1993; Ohno et al., Reference Ohno, Hirai, Sato, Ito, Yamamoto, Tamura and Shrestha1997; Sudo et al., Reference Sudo, Sekiyama, Maharjan and Ohtsuka2006).
The %RDA/RNI for zinc intake was approximately 70% among the Mushar and 85–95% among the Tharu. Thus, the participants in the present study were possibly zinc-deficient. Chandyo et al. (Reference Chandyo, Strand, Mathisen, Ulak, Adhikari, Bolann and Sommerfelt2009) investigated the association between zinc intake and plasma zinc concentration among women of reproductive age in Bhaktapur (15 km east of Kathumandu) in Nepal. The level of zinc intake in Bhaktapur was comparable with that in the present study, but 78–90% of the Bhaktapur participants were considered zinc-deficient based on their plasma zinc concentrations.
Dietary structure by ethnicity and sex
Different dietary patterns and different intakes of several micronutrients between the Tharu and Mushar participants were found. However, when the intake of micronutrients in comparison with the RDA/RNI of each was considered, participants from both ethnic groups showed similar patterns of deficiency and sufficiency. This indicates that the dietary and nutritional intakes were more strongly influenced by region than by ethnicity.
Concerning recent trends in subsistence in the region, the Mushar people claimed that parts of the streams from which they collected edible fish, snails and plants were blocked by fences recently constructed by the Tharu, who were recently registered as renters by the local government. The author also recognized that the Tharu people intended to make money by utilizing the streams for fish farming. Such processes will degrade the dietary quality of the Mushar in the near future.
Regarding the association between sex and dietary/nutritional intake, a lower consumption of protein (per kg body weight) was found in females than in males, while the intakes of other nutrients and energy were not affected by the sex of the participants. Gittelsohn et al. (Reference Gittelsohn, Thapa and Landman1997), who studied the dietary habits of the people in the western hills of Nepal, showed that staple food items were distributed fairly equally, while side dishes were often preferentially allocated to ‘valued’ household members, including adult males and small children of both sexes. The participants of the present study shared cultural beliefs (Hindu) with the western hill people. According to the author's (RPP) observations, side dishes were first served to adult males and children of both sexes, and food remaining in the pot was eaten by female participants later. This resulted in reduced consumption of protein-rich foods among females, while the energy-adjusted intake of micronutrients did not differ by sex.
Potential mitigation strategy for micronutrient deficiency
The food items that contributed to the detected micronutrient deficiencies (Table 6) are potential sources of micronutrients because the ecological feasibility of their production has already been evidenced. To address micronutrient deficiency in the region, whether the people have ways of increasing their consumption of such foods should be discussed first. Of the foods already available in the region, green vegetables such as pumpkin leaves and mustard greens are obvious candidates. They can be readily grown in small kitchen gardens without economic investment. The obstacle, however, is that the people do not regard green vegetables as food items that should be consumed in large amounts. They do consume boiled vegetables, but only for taste or a stimulant effect.
Foods such as milk, fish and meat are culturally preferred, but are not readily available ecologically or economically. Fish are caught in the nearby river by Mushar females; the catches are the result of their best efforts. The production of milk and meat is costly even for the Tharu people; they cannot meet their own demand.
Several intervention projects have been presented for improvement of the Terai diet. Encouragement of the creation of kitchen gardens and the introduction of small-scale fish farming are good examples (Peter et al., Reference Peter, Julia and Sian2004; Jones et al., Reference Jones, Specio, Shrestha, Brown and Allen2005; Bhujel et al., Reference Bhujel, Shrestha, Pant and Buranrom2008). Assuming that both projects succeeded in the Terai region, and if Mushar females could consume 200 g of green vegetables (i.e. mustard greens) together with 200 g of fish every day in addition to their current diet, the %RDA of iron would exceed 100% while that of vitamin A would reach 50%. Although fish-farming projects have not been implemented in the target community, some educated Tharu people have already started to lease parts of streams for this purpose. These areas are officially owned by the local government, but practically regarded as village commons where the Mushar people can freely collect fish, snails or edible plants. If kitchen garden projects are implemented, the Tharu people will create sufficient space for kitchen gardens on their own land, while the Mushar will only be able to make small gardens in their backyards. Therefore, implementation of these projects will benefit the Tharu more than the Mushar, resulting in increased dietary and nutritional inequality between the two ethnic groups.
Acknowledgments
The authors are grateful to Dr Makiko Sekiyama (University of Tokyo) for supporting the survey and Tara Kafle (Helen Keller International), Min Raj Gautam (UNDP officer), Binod Yadav, Chet Kumari Timilsina and Birendra Dahit (Local Social Mobiliser, supported by UNDP) for their support in the fieldwork. The authors would like to thank the Mushar and Tharu people who participated in this study. This study did not have any relationships or support that might be perceived as constituting a conflict of interest. The research was funded by Grant-in-Aid for Scientific Research (KAKENHI: 21406021, 20310146).