

Management journals publish research that can be divided into many fields and originate from many theories, but in one regard all are similar: the presentation of data according to professional conventions. The presentation of empirical findings expresses broad agreement across theories, fields of study, and researcher background, an agreement that is upheld by doctoral training and by scholars learning presentation conventions through reading journal articles. The agreement is most easily uncovered by examining empirical papers in other fields of study, which quickly yields two conclusions. First, the fields are different from the management field; second, many of them have greater internal diversity in evidence presentation than management does. In particular, empirical articles outside management use more graphical displays to show the data in addition to showing model estimates, and have a great variety of graphing techniques.[Footnote 1]
The homogeneity of evidence presentation in our field is a puzzle. Research on organization and management theory covers a broad range of theories and empirical contexts, and one could closely tailor the evidence presentation in each paper to fit the theory and empirical context. Such a tailored approach should lead to diversity in the presentation of evidence because theories are different in the evidence required, and contexts are different in the evidence provided. Imagine a matrix with the main theoretical predictions along the rows and the empirical contexts along the columns. This matrix would be enormous, and could encompass substantial variation in evidence presentation. In contrast, most organization and management papers follow a familiar formula in making their empirical argument, particularly if they are quantitative studies testing hypotheses. While such studies use multiple analytical techniques to estimate regression models, they typically present descriptive statistics, two to three tables with models, and zero to two graphs of estimated effects.
This is particularly puzzling because we are now in an era of ‘Big Data’, and researchers apply many more forms of models with different assumptions on the data-generating process. These types of models would seem to entail a need for greater presentation of the methods for generating and pre-processing data. In other fields, there is a shift in the weight of analysis to consider the nature of these sources and the textures of their data (e.g., Grimmer & Stewart, Reference Grimmer and Stewart2013). Indeed, there is a broad movement toward graphical techniques in science and excellent guides on how to apply them (e.g., Tufte, Reference Tufte2001).[Footnote 2] The movement exists for a reason: showing the data advances science because significant but weak findings can be ignored, unexplained variation can be analyzed, and new ideas can be generated from a dataset by all readers of a paper, not just the authors. Management is missing out on these opportunities, and as a result is becoming a more static science.
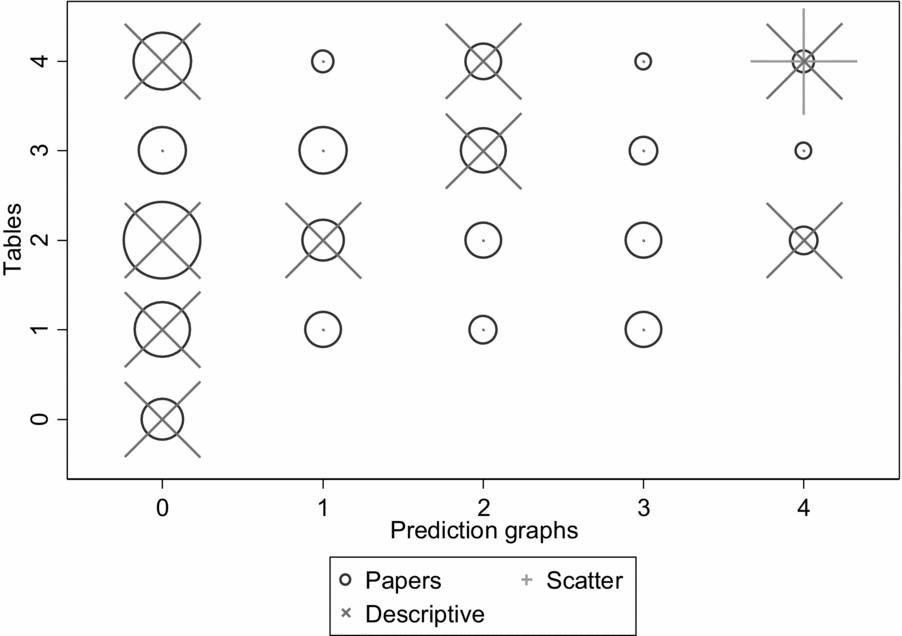
Examination of recent journal articles in management illustrates the homogeneity in evidence presentation. Two large and highly regarded journals are Academy of Management Journal (AMJ) and Organization Science (OS), and together they published 129 papers with quantitative empirical tests in 2016. The breakdowns in analysis tables and prediction graphs in the two journals is shown in Figure 1.[Footnote 3] This display has the twin purposes of showing not only the clustering of types of descriptive analyses, but also how one might depict such data graphically. The graph is a visual representation of a contingency table, but its use of circle size to represent numbers means that it requires much less mental processing to yield an interpretation.
2016 distribution of model tables and graphs in Academy of Management Journal and Organization Science
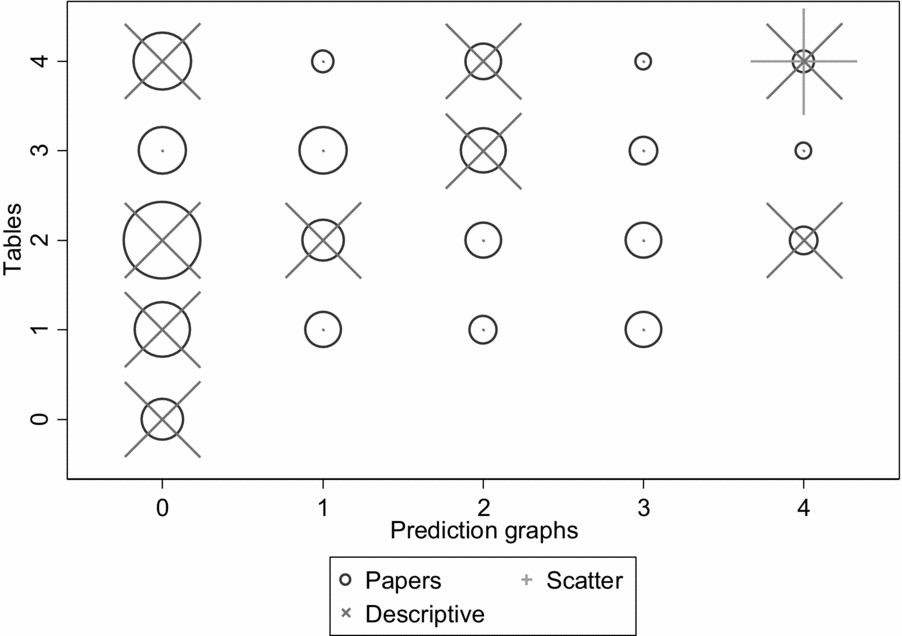
The distributions of models and prediction graphs are not overly clustered in specific cells (compare the circle distribution and sizes), but as mentioned above, they do suggest that a typical paper will have two tables, possibly one more or less, and no figures showing predictions. A split by journal (not displayed) shows that they are similar to each other, with the main difference being more prediction graphs in AMJ. There is a low proportion of papers giving a thorough display of the implications of the models, as many papers had no prediction graphs (46.2% in AMJ; 56.6% in OS) or only one prediction graph (18.9% in AMJ; 17.1% in OS). The figure also shows some papers displaying detailed data graphs (the ‘x’ symbols) and scatterplots (the ‘+’ symbols). These suggest an interest in more informational graphical displays, but are still rare. Only 15 studies (11.45 percent) showed detailed data graphs. Most of these did not show individual observations, but rather geographical or categorical summaries of the data. Prediction graphs can easily be overlaid with scatterplots showing residuals, so the reader can visually assess the extent to which outcomes differ from predictions, but only one of the 129 articles published in 2016 in these two journals showed a scatterplot.
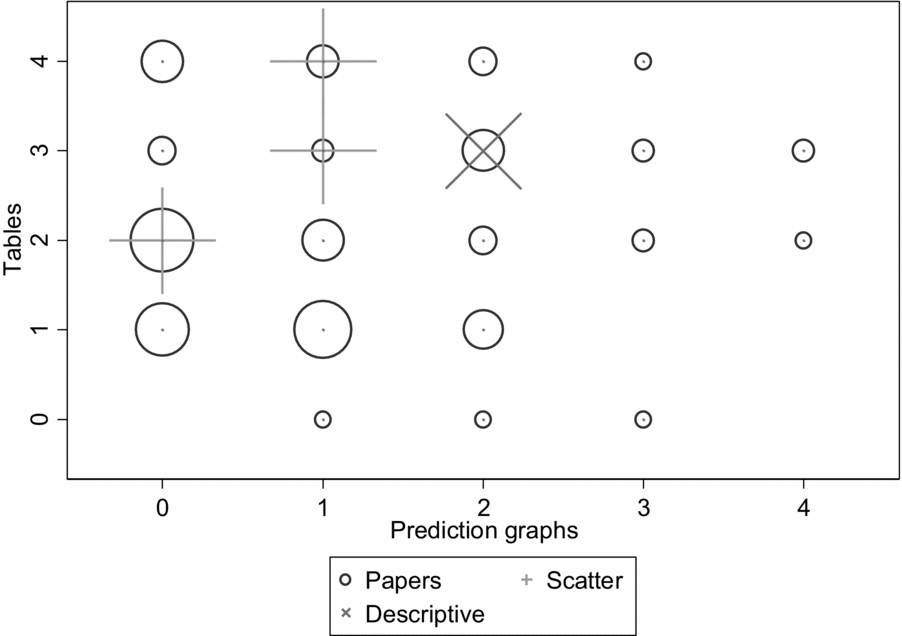
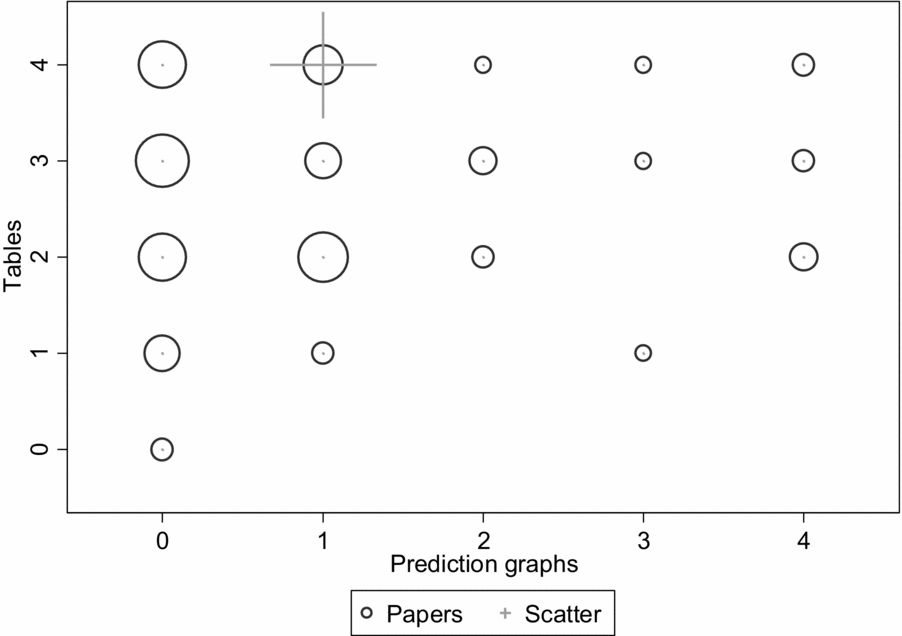
Comparison with earlier volumes shows that the number of tables has increased over the years, but the number and type of prediction graphs has not increased along with it. The proportions of tables and especially graphs are lower in the 2006 and 2011 volumes than in 2016 (see Figures 2 and 3), and the proportions of 2006/11 papers with no prediction graphs are 38.1% in AMJ and 50.7% in OS, and the proportions with only one prediction graph are 30.3% in AMJ and 29.0% in OS. The 2006/11 volumes had a total of four articles with scatterplots out of 168 empirical articles showing modeling results, and only one article with a detailed graph. The increased proportion of detailed graphs in the 2016 volume is a real change, and suggests that researchers pay increased attention to showing the data at least in some level of detail, but these graphs are still summaries rather than individual-observation data, as scatterplots would be.
2011 distribution of model tables and graphs in Academy of Management Journal and Organization Science
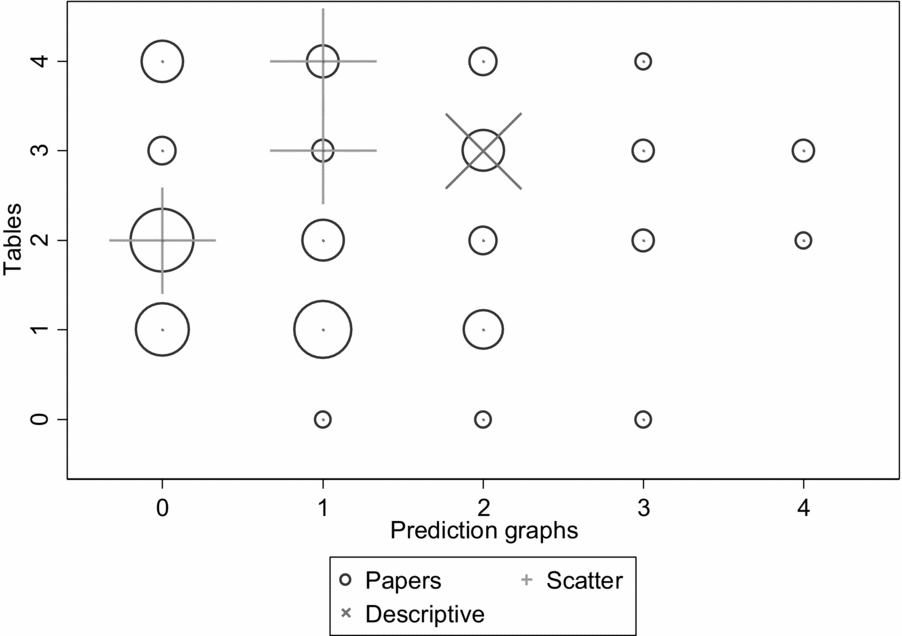
2006 distribution of models and graphs
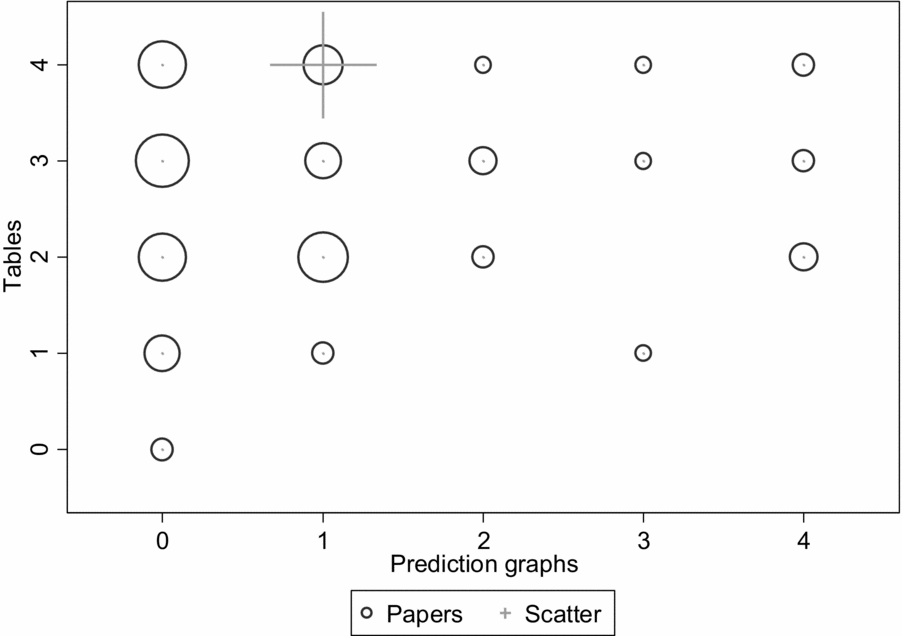
Cursory inspection of other journals suggest that AMJ and OS are representative, and are at least in 2016 better users of graphic display than a typical management journal. Examination of Administrative Science Quarterly shows that exceptions are possible, however, at least in a smaller journal. Its 2016 volume had detailed graphs in one-fifth of its papers with quantitative analysis, though no scatterplots. This is a recent development, however, as the 2011 and 2006 volumes of ASQ had no detailed graphs, and one scatterplot each. The recent increase of graphical methods in ASQ will continue, as the editorial team has decided to promote such methods, and have updated the invitation to contributors to call for increased use of graphical methods and more tailored choice of methods to the evidence at hand.
LIMITATIONS WITH CURRENT EVIDENCE PRESENTATION
Great similarity in the reporting of empirical evidence may not be a problem in itself, but it has the potential for separating data from theory and analysis, and ultimately, the readers of research from the evidence. This separation of reader and empirical evidence is especially stark if graphical displays of data are not used, because it means that the reader is left with only the model estimates to assess the empirical claims. The models will show coefficient estimates, standard errors, and significance levels, but this is insufficient, for three reasons. First, standard errors and significance levels speak to the accuracy of estimates and the confidence in the findings, both of which are different from the substantive effect. A statistically significant effect can be substantively trivial. It is well known that this will mechanically occur when the dataset is large, but it is less well known that it will also happen for smaller datasets if the noise to error ratio for this particular effect is small. An independent variable can have a reliably small effect.
Second, and importantly, in some models the substantive effect can be directly read from the coefficient estimates (e.g., linear models or exponential models), but in other models the coefficient translates to an effect in ways that are more complex, and that depend on the full regression function. For example, the commonly used logit model has coefficients that will not produce predicted effect magnitudes unless relevant data values (such as averages) are entered into the function for all variables in the regression function. A reader of the journal article can do this with the information given in the descriptive statistics, but it requires more effort than readers will normally invest. Even a logit model with a single coefficient is easy to mis-interpret. The coefficient estimate is the log of the odds ratio, so it is the logarithm of the probability of the modeled outcome divided by the probability of an alternative outcome. Both ratios and exponentials are skewed functions, so a 95% confidence interval that looks reasonable could indicate substantial uncertainty about the substantive effect. For example, if a binary variable has a coefficient of 2 with a 95% confidence interval of [0.25, 3.75], we know that the odds ratio is most likely somewhere between 1.28 and 42.52, which is the same as changing a probability of 0.5 to somewhere between 0.56 and 0.98. This means that the substantive effect could be very large, but it could also be minor. The logit model is just an example, of course. The point is that interpretation of models can be calculated through by hand, or the effect in the data can be seen at a glance in a graph.
Third, model estimates do not show the unexplained variation in sufficient detail, and neither do prediction graphs without scatterplots. This issue has two dimensions; the total unexplained variation and nonrandom unexplained variation. For the total unexplained variation, only a few model specifications yield statistics that can substitute for the graphical display of the data points relative to the prediction. The R-square statistic for linear regression has this function, but the fit statistics used for other models do not report the unexplained variance as well as graphical methods do. Model likelihood ratios measure explained variance as an improvement from a null model (usually a very simple one) to the model being tested, so they express what has been explained without being informative of what is still unexplained. Wald statistics are approximations of likelihood ratio statistics and have the same limitation. The absence of model statistics that capture the extent of unexplained variation in the dependent variable means that graphical displays such as residual scatterplots remains the superior approach. Residual scatterplots are also superior for displaying non-randomness in the unexplained variation, because they can show whether (for example) the residuals have unusual fan shapes or curves suggesting that the model has the incorrect functional form or important unmeasured influence(s). There is a wide range of techniques to explore such deviations from model assumptions, but showing them in journal publications is rare in the field of management.
More broadly, the two forms of separation – data from theory and method, and data from readers and evidence –leads to two additional limitations:
1. Because each study is different in its theoretical objectives and empirical context and procedures, standardizing across diversity automatically introduces misfit. In the reporting of research, this misfit will cause researchers to miss opportunities to explore and report specific conditions that affect the empirical testing and, thus, specific insights gained from the evidence.
2. Because the current set of reporting procedures are weighted towards showing the results of analyses rather than showing the data that is analyzed, other relevant data or subsamples within current data will be ignored. This is a problem, because data themselves are increasingly heterogeneous in nature in management studies. We have all forms of qualitative data and mixed method data, not just quantitative data (Edmondson & McManus, Reference Edmondson and McManus2007). The opportunity to integrate insights from different types of data is lost if those data are concealed.
As a consequence of these two convention-driven limitations, the readers of a paper and the authors writing the paper can miss two other important opportunities for scientific advancement. First, standardization of evidence preparation and presentation seals each research project off from the particular insights that a given dataset (and hence, the study context) can give, so it is harder to derive theoretical extensions from contextual differences. Second, the lack of raw data and residuals from predicted values makes it harder for readers to assess trivial effects from important effects, and fully modeled processes from processes with significant unexplained variation. Both of these missed opportunities can channel researcher attention and effort into less fruitful (but more traditional) research areas, at the cost of exploring fewer novel and promising research opportunities.
These problems make assessment of research findings harder, and in combination they can lead to repeated testing of minor varieties of the same theories. If researchers do not examine the data for unexplained variance and do not publish graphs that allow other researchers to examine the data for unexplained variance, it becomes harder to discover shortcomings of current theory. It is also harder to discover how specific contexts or data may be worse fit to a theory, and to exploit this misfit to develop new theory. Seeking fit and failing to report misfit are inherently static activities that does not advance science.
These activities may even facilitate pseudoscience. For unscrupulous analysts in a field of study that favors reporting model results over displaying the data, the ideal empirical context has many observations and many covariates, because such data can easily be coaxed into coefficient significance for conventional theories or minor variations of these theories.[Footnote 4] The consequence of such model tuning and related practices is a significant proportion of findings that prove difficult to replicate (e.g., Goldfarb & King, Reference Goldfarb and King2016). Journals have started applying a broad range of countermeasures against pseudoscience (e.g., Bettis et al., Reference Bettis, Ethiraj, Gambardella, Helfat and Mitchell2016; Lewin et al., Reference Lewin, Chiu, Fey, Levine, McDermott, Murmann and Tsang2016). As of yet, there is insufficient recognition that current conventions of showing model findings but not data greatly facilitates pseudoscientific practices, so improvement of evidence presentation complements the journal efforts to improve replicability.
IMPROVING THE EVIDENCE PRESENTATION
Suppose we took seriously our efforts to display data to enhance theory development, first by grounding it more deeply in the empirics, and, second, by generating more excitement, curiosity and discussion about the nature of the data on which analyses and results are based. Reaching this goal would involve drawing lessons from how qualitative researchers interpret their data and display their data in published papers, and adapting this approach to quantitative research. To ground theory more tightly with the data, we should:
1. Clearly display the original theory and original, largely disaggregated, data before showing model results, predictions, and unexplained variance.
2. Fully discuss the theoretical design from which these data were originally drawn.
3. Use post hoc analysis and additional theory development when finding opportunities to do so, but distinguish this from the original theory and modeling.
4. Feel no obligation to explain (or rationalize) all unexplained variance and no incentive to conceal it, but instead display unexplained variance in order to encourage researchers with different theoretical ideas to build on it.
To show the data more transparently and tailor the evidence presentation to the specific features of the study, we should:[Footnote 5]
1. If the theory is phenomenon based, then describe that in the theory section and accentuate this connection in the opening of the methods.
2. Graph the phenomenon to show that there is a meaningful distribution of the outcome one is trying to explain, and graph the distribution of the main independent variables and how they covary with the outcome. Display the data at the finest, disaggregated level possible, including scatterplots of individual observations. Large datasets may give the impression that scatterplots will be unwieldy, but plotting random samples is also valid and can ease interpretation.
3. The graphs should foster understanding of the variable distributions and alertness for unusual distribution shapes that could influence the findings, and even thoughts about why the distributions take that shape. Distributions of key variables are especially important if they have substantive interest such as links to the outcome. Graphs could also include mapping or tracing outcomes over space or time, or to specific network positions. The analyst should give careful thought about how best to display the data, including consideration of what dimensions are best.
4. Whenever possible, use graphical tools to give an early indication of the phenomenon and importance of the explanatory variable. This can be done to motivate the paper and to give transparency about the substantive importance of the theoretical explanation. It should preferably be done before estimating any models, because showing the data is prior to showing analyses.
5. When doing additional analyses or robustness checks, display findings in ways that provide more insight. Examples would be comparing estimates from different model specifications and actual outcomes on the same graph. Currently papers in management show predictions, but typically only from one model, and without scatterplots. Tables or graphs of prediction accuracy gained by the theoretical variables, or quantifying how much has been explained and how much variation remains to explain (and what shape it has), serve as a transparent reporting of the model limitations and an indicator of future research opportunities.
The suggestions above are merely examples meant to suggest starting points leading to transparent and rich display of data. There are now many novel ways of displaying data graphically that convey much information in a compact space. Authors can decide how to best present evidence to highlight their theoretical and empirical contribution by using the evidence components that make the paper easiest to understand and most compelling to a reader. This means that they have to think carefully about how the content reflects their message, rather than meeting a set of fixed expectations about the form of evidence presented.
Addressing the limitations of the conventional evidence presentation (especially the risk of pseudoscience) and pursuing opportunities for better display and use of data would be problematic if it imposed significant costs on the field in terms of data-collection costs, research and reporting costs, reviewing costs, and post-review data storage and checking. Research may yet come to a point at which such costs are needed, but for now it is inexpensive and appealing to show the data in graphical format, and to let the modeling follow the data display, possibly even with simplified modeling and reporting approaches. The merit of this approach is that a visible display of a relation between data items can substitute for much analysis and allow easy distinction between relations that are of substantive importance and relations that are trivial in magnitude. It also allows for easy and transparent theory development that stems from conversations between data and modeling.
THE PATH FORWARD
‘Show me the data’! is a phrase that seems almost too simple as a summary statement to be helpful for advancing management research at a greater pace. But its simplicity is its power, because showing relations from the raw data is easy to do and easy to interpret. It is an excellent approach for distinguishing the important phenomena from the less important, and for distinguishing the theory that explains phenomena well that from the theory that only captures a small part of the variation. Showing the data is an initial test of importance that speaks volumes of the relevance of the analyses that follow. Indeed, if the data are shown well, the modeling that follows is mostly for quantifying the strength of the theoretical explanation when factoring out controls for other causes, and for quantifying the uncertainty of the theoretical explanation. Graphs can go a long way towards answering the question of what is going on in the data, with models taking the next step of adding precision to this answer along the dimensions of effect strength and researcher confidence.
‘Show me the data’! allows greater ability to identify important phenomena and reduces the credibility of models that produce misleading results. It also shows irregularities in the data and analysis that suggest opportunities for additional theory building and empirical research. Transparent display of irregularity directs researchers toward the most promising research opportunities, and away from red herrings in the form of idiosyncratic findings. This is important because a research paper should never be seen as a completed piece of work. It is a signpost for future research, so it should be maximally informative for the future scholars who are reading it and wondering whether and how to follow up. Showing the data makes the signpost clearer, and guides future research better, than simply presenting a series of models. It is a way to improving evidence presentation that also improves management research overall.
‘Show me the data’! can become normalized through the review and editorial process of journals, but this route is limited because journals are working with the material that authors submit, and even best-practice suggestions for improvements will miss opportunities for data display. The best path to improving evidence presentation is changed norms and acquired skills. This starts in the doctoral programs, where those teaching the next generation of scholars should emphasize the norm of ‘data before models’ and teach effective data presentation. It continues through presentations in scholarly conferences and in workshops organized by journals. I have yet to see a participant in such training who is resistant to learning better evidence presentation skills or doubtful of the benefits of transparency as an engine of scientific progress. Once schools, associations, and journals take the lead, the progress should be rapid.