INTRODUCTION
Grape and wine quality depends on numerous factors such as climatic and soil conditions, cultural practices, yield, degree of ripening, cultivar and hygiene conditions during production. It is widely recognized that phenolics are a main component of quality, being responsible for many grape and wine organoleptic properties including colour, flavour, bitterness and astringency. Their contribution to human health is now attracting considerable interest in the international scientific community and several studies have been developed (Glories Reference Glories1988; Mateus et al. Reference Mateus, Silva, Santos-Buelga, Rivas-Gonzalo and de Freitas2002).
Polyphenolic compounds in grape can be divided into two large groups: non-flavonoid (hydroxybenzoic and hydroxycinnamic acids and stilbenes) and flavonoid compounds. The presence or absence of these contribute greatly to the grape and wine quality. Three classes of flavonoids are commonly detected: anthocyanins, flavan-3-ols and flavonols. They are considered as chemical markers among the plant metabolic compounds and they have been frequently used in chemotaxonomy because they are relatively stable and their biosynthesis and accumulation seems to be independent of environmental influence (Markham Reference Markham, Harborne and Dey1989).
Anthocyanins are responsible for red to black colouration (Ribereau-Gayon & Glories Reference Ribereau-Gayon, Glories and Lee1986) and it is well known that the distribution in the fruit varies according to the cultivar (Mazza & Miniati Reference Mazza and Miniati1993). The glycosides are more stable than the free aglycones (anthocyanidins), which are highly reactive and do not occur naturally (Arozarena et al. Reference Arozarena, Ayestarán, Cantalejo, Navarro, Vera, Abril and Casp2002; Pomar et al. Reference Pomar, Novo and Masa2005). Cyanidin, delphinidin, petunidin, peonidin and malvidin-3-monoglucosides (Mvgs), along with the corresponding acetyl-p-coumaroyl and caffeoyl derivatives, are predominant in red grape cultivars (Pomar et al. Reference Pomar, Novo and Masa2005).
The chemical structure of flavan-3-ols (monomeric catechins and proanthocyanidins), when compared with the known structures of tannin polymers, suggests a precursor product relationship (Adams Reference Adams2006); flavan-3-ols and tannins are mainly responsible for the astringency, bitterness and structure of wines (Gawel Reference Gawel1998). Flavonols are the most abundant phenolic compounds in grape skins, and although colourless, are nevertheless thought to contribute to grape colour as anthocyanin copigments (Asen et al. Reference Asen, Stewart and Norris1972; Boulton Reference Boulton2001). They are represented mainly by quercetin, kaempferol, isorhamnetin and myricetin (only in red cultivars); glycosides are the major flavonol compound in plant tissues (Makris et al. Reference Makris, Kallithraka and Kefalas2006).
The composition of flavonoids is primarily determined by genetic factors and their distribution depends on grape maturation, seasonal conditions and soil characteristics (Mazza Reference Mazza1995; Zoecklein et al. Reference Zoecklein, Fugelsang, Gump and Nury1995; Yokotsuka et al. Reference Yokotsuka, Nagao, Nakazawa and Sato1999; Arozarena et al. Reference Arozarena, Ayestarán, Cantalejo, Navarro, Vera, Abril and Casp2002). A recent study (Cliff et al. Reference Cliff, King and Schlosser2007) observed that the analysis of phenolic derivatives, combined with a sensory evaluation of the astringent characteristics in British Columbian commercial red wines, showed significant cultivar and environment effects. Several authors have also shown that the cultivar (Goldberg et al. Reference Goldberg, Karumanchiri, Tsang and Soleas1998) and environment (Goldberg et al. Reference Goldberg, Karumanchiri, Tsang and Soleas1998; Brossaud et al. Reference Brossaud, Cheynier, Asselin and Moutounet1999; Yokotsuka et al. Reference Yokotsuka, Nagao, Nakazawa and Sato1999) affect the phenolic composition. Nevertheless, most of the studies agree that the non-genetic factors (environmental conditions or viticultural practices) have a greater effect on the concentration of flavonoids rather than on their relative distribution (Arozarena et al. Reference Arozarena, Ayestarán, Cantalejo, Navarro, Vera, Abril and Casp2002).
Studies on genetic variation of polyphenols have been previously reported (Pomar et al. Reference Pomar, Novo and Masa2005; Masa et al. Reference Masa, Vilanova and Pomar2007), but the environmental effects and their interaction with the plant cultivar have not been investigated. The aim of the present work was to study the effect of the environment (year) and cultivar on the flavonoid composition of white and red grape cultivars, in order to increase the knowledge about the impact of the environment and cultivar on grape and wine quality.
MATERIALS AND METHODS
Genetic material
Ten red grape cultivars (Brancellao, Cabernet Sauvignon, Caiño Tinto, Castañal, Espadeiro, Garnacha Tinta, Mencía, Merenzao, Sousón and Verdejo Negro) and eight white grape cultivars (Albariño, Caiño Blanco, Dona Branca, Godello, Lado, Loureiro, Torrontés and Treixadura) from the grape germplasm collection of the Misión Biológica de Galicia, an institute belonging to the Spanish Council for Scientific Research (Consejo Superior de Investigaciones Científicas; MBG-CSIC) in Spain were used in the present study. Sousón is a synonym of Vinhao from Portugal (Sefc et al. Reference Sefc, Lopes, Lefort, Botta, Roubelakis-Angelakis, Ibañez, Pejic, Wagner, Glössl and Steinkellner2000) and of Tinta País (Vilanova et al. Reference Vilanova, De La Fuente, Fernández-González and Masa2009).
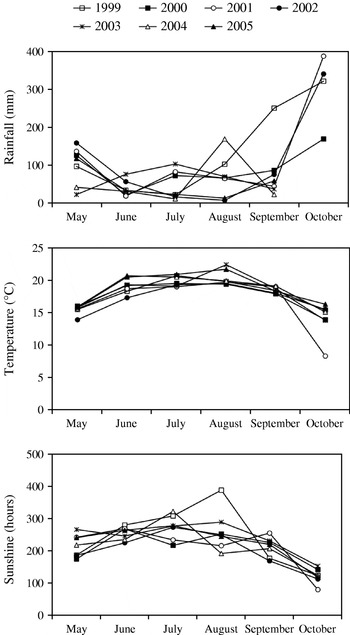
The MBG-CSIC collection is located in Salcedo, Pontevedra, northwest Spain, which has a temperate climate. The climatic conditions (rainfall, temperature and sunshine) during the period that grapes are maturing are shown in Fig. 1. The soil characteristics where the grape cultivars were grown are a sandy loam with 80 g organic matter/kg. All the plants studied (10 replicates per cultivar) were of the same age, grown on 110-Richter rootstocks, espalier grown and were pruned to a Sylvoz system. One hundred berries from each cultivar, at technological ripening, were harvested from seven consecutive vintages (1999–2005). The samples were frozen at −20°C immediately after harvesting, until the phenolic compounds were extracted.
Climatic conditions (rainfall, temperature and sunshine) during grape ripening in seven consecutive years (1999–2005) in Salcedo, Pontevedra, Spain.

Phenolic compound extraction
Anthocyanins, flavonols and dihydroflavonols were extracted according to the procedures described by Pomar et al. (Reference Pomar, Novo and Masa2005) and Masa et al. (Reference Masa, Vilanova and Pomar2007). Five extractions were performed in each sample. The extracts were used for the chromatographic analysis. The phenolic standards were obtained from Extrasynthese (Genay, France), Sarsyntex (Merignac, France), Fluka (Buchs, Switzerland) and Sigma (St. Louis, MO, USA).
Chromatographic analysis
The chromatographic analyses were performed with a Waters (Milford, MA, USA) high-performance liquid chromatograph equipped with a 2690 Waters Separation Module and a 996 Waters photodiode array detector. A 4×250 mm Kromasil 100 column from Tracer Analítica (Barcelona, Spain) packed with 4 μm reversed phase C18 and protected with a C18 Nova-Pak guard precolumn (Waters, Milford, MA, USA) was used. The oven temperature was set at 30°C. Extracts were passed through a 0·45 μm filter (Millex-HV, Millipore) and 20 μl of solution was injected through the RP-C18 column for analytical high performance liquid chromatography (HPLC). For red grape samples, the flow rate was 1·0 ml/min and the mobile phase and gradient conditions were as in Pomar et al. (Reference Pomar, Novo and Masa2005). Data were recorded using the Millenium32 software (Waters, Milford, MA, USA) and the chromatograms were acquired at 313 and 546 nm with photodiode array spectra between 270 and 600 nm. For white grape samples, the flow rate was 0·8 ml/min and the mobile phase and gradient conditions were as in Masa et al. (Reference Masa, Vilanova and Pomar2007). In this case, the chromatograms were acquired at 280 and 356 nm and the photodiode array spectra were recorded between 240 and 460 nm.
Samples were repeatedly injected and peaks were collected and studied by co-chromatography in an analytical HPLC, thin layer chromatography (TLC; 200×200×0·1 mm cellulose; Merck) and paper chromatography (1 m Whatman paper) and according to their spectral properties. Anthocyan spectral analyses were achieved in methanol containing 0·0012 N hydrochloric acid and shifts were recorded after addition of aluminium chloride (AlCl3; three drops of 50 g/l in ethanol). The flavonol and dihydroflavonol spectra were measured in methanol (MeOH) and in the presence of a number of spectral shift reagents (AlCl3, HCl, sodium methoxide (NaOMe), sodium acetate (NaOAc) and boric acid (H3BO3)). All spectral measurements were carried out with a DU-640 spectrophotometer from Beckman Coulter (Fullerton, CA, USA). Further evidence for the structure of phenolic compounds was obtained by chromatographing the products of acid and alkaline hydrolysis that were carried out following the methods described by Markham (Reference Markham1982).
Data analysis
The relative concentration of each flavonoid was calculated as the area under the curve from the chromatograms obtained. Analysis of variance was carried out according to established methods (Steel et al. Reference Steel, Torrie and Dickey1997) using the PROC GLM of the SAS statistical package (SAS 1999). The years and cultivars were considered as random effects. Principal component analysis (PCA) was used for reducing the dimensionality of data and finding the best differentiation among grape cultivars and the interrelationship of the variables.
RESULTS
The temperature regime during the grape maturity period was similar in different years, except in 2003 and 2005 when the temperatures were higher (Fig. 1). However, the rainfall was considerably higher in 1999 and 2004 compared with 2002 and 2005. Mean sunshine hours were high for July and August in 1999 and for August in 2003.
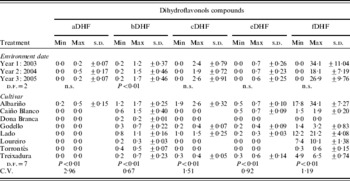
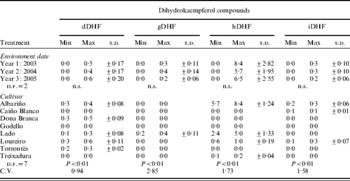
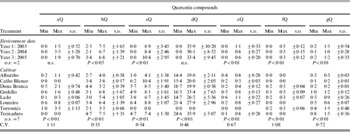
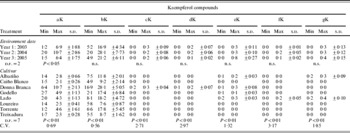
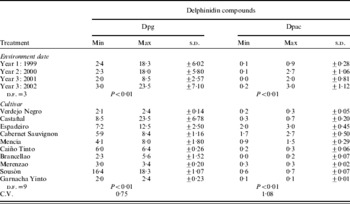
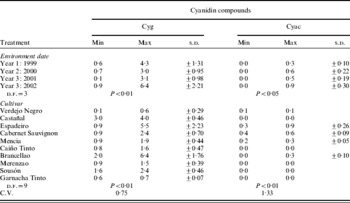
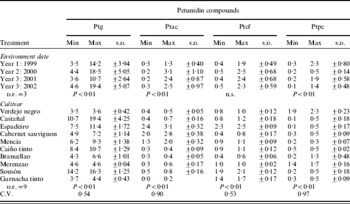
Significant differences between years were observed on seven of the 23 flavonoids measured, one dihydroflavonol, five quercetin derivatives and one kaempferol derivative (Tables 1–4). Differences between years were significant for 11 of the 14 anthocyanin derivatives studied (Tables 5–9).
Effect of date of environment and cultivar on dihydroflavonols in 10 white grape cultivars

Dihidroquercetin-3-glycoside (aDHF), dihidroquercetin-3-glycoside (bDHF), dihidroquercetin-3-galactoside (cDHF), dihidroquercetin-3-glucoside (eDHF), dihidroquercetin-3-rhamnoside (fDHF). n.s., not significant; d.f., degrees of freedom; C.V., proportion of the coefficient of variation.
Effect of date of environment and cultivar on dihydrokaempferols in 10 white grape cultivars

Dihydrokaempferol-3-glycoside (dDHF), dihydrokaempferol-3-glycoside (gDHF), dihydrokaempferol-3-rhamnoside (hDHF), and dihydrokaempferol-3-glycoside (iDHF). n.s., not significant; d.f., degrees of freedom; C.V., proportion of the coefficient of variation.
Effect of date of environment and cultivar on quercetin compounds in 10 white grape cultivars

Quercetin-3-rutinoside (aQ), quercetin-3-glucuronide (bQ), quercetin-3-galactoside (cQ), quercetin-3-glucoside (dQ), quercetin-3-rhamnoside (eQ), quercetin-3-glycoside (fQ) and quercetin-3-glycoside (gQ). n.s., not significant; d.F., degrees of freedom; C.V., proportion of the coefficient of variation.
Effect of date of environment and cultivar on kaempferol compounds in 10 white grape cultivars

Kaempferol-3-rutinoside (aK), kaempferol-3-glucuronide (bK), kaempferol-3-glycoside (cK), kaempferol-3-glycoside (dK), kaempferol-3-glucoside (eK), kaempferol-3-rhamnoside (fK) and kaempferol-3-glycoside (gK). n.s., not significant; d.f., degrees of freedom; C.V., proportion of the coefficient of variation.
Effect of date of environment and cultivar on delphinidin compounds based on data of eight red grape cultivars

Delphinidin-3-monoglucoside (Dpg), delphinidin-3-monoglucoside-acetate (Dpac). n.s., not significant; d.f., degrees of freedom; C.V., proportion of the coefficient of variation.
Effect of date of environment and cultivar on cyanidin compounds based on data of eight red grape cultivars

Cyanidin-3-monoglucoside (Cyg), cyanidin-3-monoglucoside-acetate (Cyac). n.s., not significant; d.f., degrees of freedom; C.V., proportion of the coefficient of variation.
Effect of date of environment and cultivar on petunidin compounds based on data of eight red grape cultivars

Petunidin-3-monoglucoside (Ptg), petunidin-3-monoglucoside-acetate (Ptac), petunidin-3-monoglucoside-caffeoate (Ptcf), petunidin-3-monoglucoside-p-coumarate (Ptpc). n.s., not significant; d.f., degrees of freedom; C.V., proportion of the coefficient of variation.
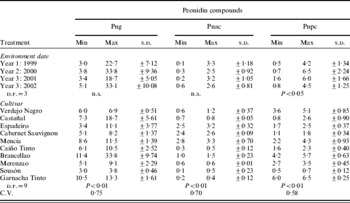
Effect of date of environment and cultivar on peonidin compounds based on data of eight red grape cultivars

Peonidin-3-monoglucoside (Png), peonidin-3-monoglucoside-acetate (Pnac), peonidin-3-monoglucoside-p-coumarate (Pnpc). n.s., not significant; d.f., degrees of freedom; C.V., proportion of the coefficient of variation.
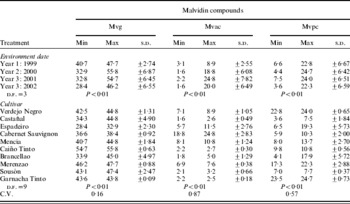
Effect of date of environment and cultivar on malvidin compounds based on data of eight red grape cultivars

Malvidin-3-monoglucoside (Mvg), malvidin-3-monoglucoside-acetate (Mvac) and malvidin-3-monoglucoside-p-coumarate (Mvpc). n.s., not significant; d.f., degrees of freedom; C.V., proportion of the coefficient of variation.
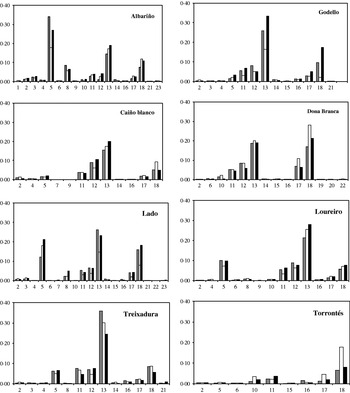
Quercetin-3-glucoside (dQ) was the main flavonoid derivative compound in white cultivars, except for Torrontés and Albariño varieties, showing a large range of variation between cultivars in all vintages. However, no significant differences were found between years for this compound. The 2003 vintage, which experienced more hours of sunshine and higher temperatures, showed the highest amounts of this compound. The same genetic variability showed in the levels of dihydroquercetin-3-rhamnoside (fDHF) for all vintages, and for kaempferol-3-glucuronide (bK) in 2004 and 2005 vintages.
Mvg, the main anthocyanin compound in the red grape cultivars, showed significant differences between years. Mvg was high in the 1999 vintage, probably due to more hours of sunshine during grape maturity. The range of variation in maximum and minimum values for this compound was low in all vintages, while other compounds with greater amounts, such as peonidin-3-monoglucoside (Png), malvidin-3-monoglucoside-acetate (Mvac), malvidin-3-monoglucoside-p-coumarate (Mvpc), delphinidin-3-monoglucoside (Dpg) and petunidin-3-monoglucoside (Ptg), showed a large range of variation in all vintages.
Significant differences between cultivars were found in all flavonoid and anthocyanin compounds. The four flavonoid compounds, fDHF, quercetin-3-galactoside (cQ), dQ and bK were those with the highest concentrations in the white grape cultivars. The six anthocyanin compounds, Dpg, Ptg, Png, Mvg, Mvac and Mvpc, were those with the highest concentrations in red grape cultivars.
A high coefficient of variation between white varieties was found for five flavonoid compounds: dihidroquercetin-3-glycoside (aDHF), dihydrokaempferol-3-glycoside (gDHF), kaempferol-3-glycoside (cK), kaempferol-3-glycoside (dK), and kaempferol-3-rhamnoside (fK). However, in red cultivars the coefficients of variation between cultivars were lower for all compounds.
Although the major compound in white cultivars was dQ, high levels of fDHF were found in Albariño and Lado. Torrontés was characterized by bK, while Dona Branca was also characterized by high concentrations of kaempferol-3-rutinoside (aK) and bK.
The most abundant compound in all red cultivars was Mvg. However, high values of other compounds were found in some cultivars as follows: Castañal, Espadeiro and Sousón had high values of Dpg and Ptg; Castañal, Brancellao and Garnacha Tinta had high values of Png; Cabernet Sauvignon had high values of Mvac and Verdejo Negro, Merenzao and Garnacha Tinta had high values of Mvpc.
The flavonoid and anthocyanin composition for the different white and red grape cultivars and years studied are shown in Figs 2 and 3. In white cultivars, dihidroquercetin-3-rhamnoside (peak 5, Fig. 2) shows a high degree of variation between years for Albariño (the peak area in 2003 is twice that in 2004). In Lado, the peak area of this compound in 2005 is double that in 2003. dQ (peak 13, Fig. 2) shows a very high variation between years for different varieties: Albariño, Godello, Caiño Blanco, Lado, Loureiro and Treixadura. Dona Branca and Torrontés showed a higher peak area in 2004 than in 2003 and 2005 for two compounds: aK and bK (peaks 17 and 18, respectively, in Fig. 2).
Flavonoid compounds (proportion of total) in different white grape cultivars grown in the northwest of Spain during three years (2003  , 2004 □ and 2005 ▪). 1, dihidroquercetin-3-glycoside (aDHF); 2, dihidroquercetin-3-glycoside (bDHF); 3, dihidroquercetin-3-galactoside (cDHF); 4, dihidroquercetin-3-glucoside (eDHF); 5, dihidroquercetin-3-rhamnoside (fDHF); 6, dihydrokaempferol-3-glycoside (dDHF); 7, dihyrokaempferol-3-glycoside (gDHF); 8, dihydrokaempferol-3-rhamnoside (hDHF); 9, dihydrokaempferol-3-glycoside (iDHF); 10, quercetin-3-rutinoside (aQ); 11, quercetin-3-glucuronide (bQ); 12, quercetin-3-galactoside (cQ); 13, quercetin-3-glucoside (dQ); 14, quercetin-3-rhamnoside (eQ); 15, quercetin-3-glycoside (fQ); 16, quercetin-3-glycoside (gQ); 17, kaempferol-3-rutinoside (aK); 18, kaempferol-3-glucuronide (bK); 19, kaempferol-3-glycoside (cK); 20, kaempferol-3-glycoside (dK); 21, kaempferol-3-glucoside (eK); 22, kaempferol-3-rhamnoside (fK); 23, kaempferol-3-glycoside (gK).

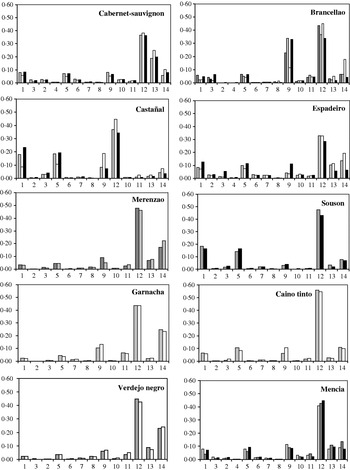
Anthocyanin compounds (proportion of total) in red grape cultivars grown in the northwest of Spain grown during four years (1999 , 2000  , 2001 □ and 2002 ▪). 1, delphinidin-3-monoglucoside (Dpg); 2, delphinidin-3-monoglucoside-acetate (Dpac); 3, cyanidin-3-monoglucoside (Cyg); 4, cyanidin-3-monoglucoside-acetate (Cyac); 5, petunidin-3-monoglucoside (Ptg); 6, petunidin-3monoglucoside-acetate (Ptac); 7, petunidin-3-monoglucoside-caffeoate (Ptcf); 8, petunidin-3-monoglucoside-p-coumarate (Ptpc); 9, peonidin-3-monoglucoside (Png); 10, peonidin-3-monoglucoside-acetate (Pnac); 11, peonidin-3-monoglucoside-p-coumarate (Pnpc); 12, malvidin-3-monoglucoside (Mvg); 13, malvidin-3-monoglucoside-acetate (Mvac); 14, malvidin-3-monoglucoside-p-coumarate (Mvpc).

In red cultivars (Fig. 3), the highest differences between years for different anthocyanin compounds were as follows: Mvg (peak 13) and Mvpc (peak 14) in Cabernet Sauvignon and Espadeiro; Png (peak 9), Mvg (peak 12) and malvidin-3-monoglucosid-p-coumarate (peak 14) in Brancellao and Dpg (peak 1), Ptg (peak 5), Png (peak 9), Mvg (peak 12) and malvidin-3-monoglucosid-p-coumarate (peak 14) in Castañal. The other red grape cultivars showed similar profiles in every year studied. Caiño Tinto showed the highest value for Mvg (peak 12), more than 0·55 of the total, with no variation between years.
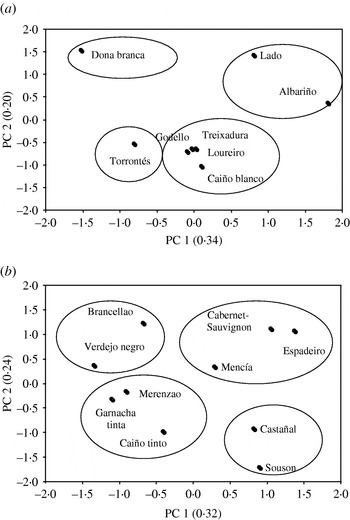
The PCA for the flavonoids among the grape cultivars studied is shown in Fig. 4. The PCA for the white grape cultivars accounted for 0·53, where PC1 (0·34) was characterized by six dihydroflavonols (dihidroquercetin-3-glycoside (aDHF), dihidroquercetin-3-glycoside (bDHF), dihidroquercetin-3-galactoside (cDHF), dihidroquercetin-3-glucoside (eDHF), fDHF, dihydrokaempferol-3-glycoside (dDHF)), and one kaempferol-3-glycoside with positive loadings, while PC2 (0·20) was characterized by six kaempferol derivatives (aK, bK, kaempferol-3-glycoside (cK), kaempferol-3-glycoside (dK), fK and kaempferol-3-glycoside (gK)), one quercetin-3-glycoside (fQ) and one dihydrokaempferol-3-glycoside (gDHF) with positive loadings.
PCA of the polyphenol data for the white (a) and red (b) grape cultivars.

White grape cultivars were classified into four groups (Fig. 4 a). The PCA for the anthocyanin compounds accounted for 0·56 of the variance, where PC1 (0·32 of the total variance) was characterized by Dpg, Ptg, delphinidin-3-monoglucoside-acetate (Dpac) and petunidin-3-monoglucoside-acetate (Ptac) with positive loadings and peonidin-3-monoglucoside-p-coumarate (Pnpc) and Mvpc with negative loadings. PC2 (accounting for 0·24 of the variance) is described by cyanidin-3-monoglucoside-acetate (Cyac), peonidin-3-monoglucoside-acetate (Pnac) and Mvac with positive loadings and Ptg and Mvg with negative loadings.
The red grape cultivars formed four groups (Fig. 4 b).
DISCUSSION
The present study shows the effect of year and cultivar on phenolic compounds in red and white grape cultivars. Flavonoid biosynthesis in plants is affected by many factors including light, temperature, altitude, soil type, water, microbial interactions and nutritional status (Downey et al. Reference Downey, Dokoozlian and Krstic2006). These parameters are genetically determined, although their expression throughout the grape ripening process is also modulated by environmental factors (Delgado et al. Reference Delgado, Martín, del Alamo and Gonzalez2004; Vian et al. Reference Vian, Tomao, Coulomb, Lacombe and Dangles2006). The phenolic compounds studied were less affected by year than by cultivar. Other authors have found that the values of the phenolic compounds can change significantly from year to year, especially as a consequence of climatic and environmental factors (De la Presa-Owens et al. Reference De la Presa-Owens, Lamuela-Raventos, Buxaderas and de la Torre-Boronat1995). To obtain results that may be valid in the long term, it is necessary to include data obtained from several environments in order to provide a good estimate of the parameters (Bakker et al. Reference Bakker, Bridle, Timberlake and Arnold1986; Forina et al. Reference Forina, Armanino, Castino and Ubigli1986). Brossaud et al. (Reference Brossaud, Cheynier, Asselin and Moutounet1999) determined that the environment affected the anthocyanin content and qualitative distribution of tannins. The amount of phenolic components increases with increasing sugar content in the berry juices and the phenolic content is higher in cool rather than warm years (Yokotsuka et al. Reference Yokotsuka, Nagao, Nakazawa and Sato1999).
The years 1999, 2003 and 2005 provided the best environmental conditions for white cultivars (more hours of sunshine and higher temperatures); these conditions corresponded to higher peak areas of the flavonoids for the greater number of cultivars studied. Light, temperature and humidity (climatic conditions) seem to have a great influence on flavonoid accumulation (Emmett et al. Reference Emmett, Harris, Taylor, McGechan, Coombe and Dry1992; Haselgrove et al. Reference Haselgrove, Botting, van Heeswijck, Hoj, Dry, Ford and Iland2000; van Leeuwen et al. Reference van Leeuwen, Friant, Choné, Tregoat, Koundouras and Dubourdieu2004). No significant year×cultivar interaction was detected for eDHF or gDHF. qD was the most important compound in the majority of white cultivars; nevertheless it was very variable with year. This compound is not present in Torrontés, where the major compound is bK.
For red cultivars, the higher peak area of anthocyanin derivatives was found in 1999 and 2001 vintages (more hours of sunshine) for several cultivars. More sunlight stimulates accumulation of anthocyanin in the berry (Smart Reference Smart1985; Spayd et al. Reference Spayd, Tarara, Mee and Ferguson2002). No significant year×cultivar interaction was detected for the Cyac, Ptac or petunidin-3-monoglucoside-caffeoate (Ptcf). Anthocyanin composition for Tempranillo, Garnacha and Cabernet Sauvignon cultivars has been studied by Arozarena et al. (Reference Arozarena, Ayestarán, Cantalejo, Navarro, Vera, Abril and Casp2002), who showed that the content of these compounds was always the same within each cultivar, independent of the environment considered. Brossaud et al. (Reference Brossaud, Cheynier, Asselin and Moutounet1999) found that the malvidin, delphinidin and petunidin derivatives were the major anthocyanins in Cabernet franc grape cultivar and they found no differences between years. It seems that anthocyanin content depends on environment, whereas qualitative anthocyanin composition is determined by genetic factors (Brossaud et al. Reference Brossaud, Cheynier, Asselin and Moutounet1999).
All the compounds studied in the present work showed differences between cultivars. This is in agreement with other authors (Ribereau-Gayon & Glories Reference Ribereau-Gayon, Glories and Lee1986; De la Presa-Owens et al. Reference De la Presa-Owens, Lamuela-Raventos, Buxaderas and de la Torre-Boronat1995; Soleas et al. Reference Soleas, Dam, Carey and Goldberg1997), who reported differences in phenolic patterns for different grape cultivars. The most abundant compounds for the red cultivars analysed in the present work were Mvg and Mvpc. These results are in agreement with those previously described (Escribano-Bailón et al. Reference Escribano-Bailón, Álvarez-García, Rivas-Gonzalo, Heredia and Santos Buelga2001; Cantos et al. Reference Cantos, Espin and Tomás-Barberán2002; García-Beneytez et al. Reference García-Beneytez, Cabello and Revilla2003; Pomar et al. Reference Pomar, Novo and Masa2005; Mattivi et al. Reference Mattivi, Guzzon, Vrhovsek, Stefanini and Velasco2006; Dopico-García et al. Reference Dopico-García, Fique, Guerra, Afonso, Pereira, Valentäo, Andrade and Seabra2008), where the major phenolic group is the 3-O-glucoside derivatives (malvidin and peonidin) because they are the final products of the anthocyanin biosynthesis pathway (Roggero et al. Reference Roggero, Coen and Ragonnet1986). Malvidin derivatives have been found to be the most important anthocyanin components in Touriga Nacional and Touriga Francesa cultivars, followed by peonidin, petunidin and cyanidin derivatives (Mateus et al. Reference Mateus, Proença, Ribeiro, Machado and De Freitas2001). Petunidin compounds have been shown to be significantly high in different red grape cultivars from Uruguay (González-Neves et al. Reference González-Neves, Franco, Barreiro, Gil, Moutounet and Carbonneau2007). The main flavonol glycosides in white grapes were kaempferol and quercetin compounds, as found by Mattivi et al. (Reference Mattivi, Guzzon, Vrhovsek, Stefanini and Velasco2006) and Rodríguez Montealegre et al. (Reference Rodríguez Montealegre, Romero Peces, Chacón Vozmediano, Gascueña and García Romero2006). Quercetin is known to be a powerful antioxidant and health benefits have been demonstrated based on experimental data (Choi et al. Reference Choi, Choi, Min, Yoon, Rhie, Jo, Kim and Hahn2001; Duarte et al. Reference Duarte, Perez-Palencia, Vargas, Ocete, Perez-Vizcaino, Zarzuelo and Tamargo2001).
In the present work, it has been found that the variation of the phenolic composition between years for white grape cultivars was more variable than for red cultivars. Stable profiles between years were found for Sousón, Garnacha, Caiño Tinto and Verdejo Negro. Also, several groups of cultivars with similar phenolic composition were found: Albariño and Lado, characterized by a high content of dQ, fDHF; Treixadura and Loureiro showed high values for dQ and bK compounds. Godello, Caiño Blanco and Dona Branca cultivars had a high concentration of dQ and bK compounds. Brancellao, Garnacha, Verdejo Negro and Merenzao cultivars presented malvidin and peonidin derivatives while Castañal, Espadeiro, Mencía, Sousón, Caiño Tinto and Cabernet Sauvignon cultivars were evidenced by malvidin, peonidin, petunidin and delphinidin derivatives.
The main conclusions of the present work are that the content of phenolic compounds varied widely and significantly between grape cultivars, but was less affected by the year than the cultivar. In addition, the variation of the phenolic composition between years for white grapes was found to be higher than for red cultivars. The cultivars Sousón, Garnacha, Caiño Tinto and Verdejo Negro exhibited stable profiles between years. There was high genetic variability for all phenolic compounds.
This research was supported by the Xunta de Galicia project (XUGA40301B94). Dr Vilanova acknowledges assistance from the Xunta de Galicia for the Isidro Parga Pondal Program. Thanks to Enrique López for technical assistance.