Introduction
Prostate cancer is the most frequent malignancy among men and accounts for approximately 20% of all new cancer cases and 10% of all cancer mortalities in Canadian men and ranks second in cancer-related deaths in the United States.Reference Brenner, Weir and Demers1–Reference Siegel, Miller and Jemal4 In 2020, it is projected that 191,930 new cases will be diagnosed and 33,330 prostate cancer mortalities will occur in the United States.Reference Siegel, Miller and Jemal4 In Canada, it is estimated that 23,300 new cases and 4,200 prostate cancer deaths will occur in 2020.Reference Brenner, Weir and Demers1,2 The standard treatment modalities for prostate cancer include surgery, radiation therapy, hormonal therapy and chemotherapy or any combination depending on the stage of the tumour. Radiation therapy is a common and effective treatment modality for low- and intermediate-risk patients with localised prostate cancer to treat the intact prostate.Reference Darko, Osei, Fleck and Rachakonda5–Reference Al-Mamgani, Putten, Wielen, Levendag and Incrocci17 However, for high-risk patients with increased risk of nodal involvement, treatment with radiation will usually include treatment of the whole pelvis to cover the prostate and seminal vesicles and the pelvic lymph nodes followed by a boost delivery dose to the prostate. This usually involves a two-phase approach: Phase 1 will involve whole-pelvis radiation therapy (WPRT) to cover the prostate and seminal vesicles or prostate bed post prostatectomy and the pelvic lymph nodes followed by a phase 2 which delivers a boost dose to the prostate and seminal vesicles or prostate bed.Reference Ashman, Zelefsky, Hunt, Leibel and Fuks15,Reference Aizer, Yu, McKeon, Decker, Colberg and Peschel16,Reference Poelaert, Fonteyne and Ost18–Reference Pommier, Chabaud and Lagrange37 Radiation therapy is also an effective salvage therapy for biochemical recurrence following prostatectomy.
Intensity-modulated radiotherapy (IMRT) has been used for dose escalation to the intact prostate and prostate bed with prophylactic whole pelvis radiotherapy and is capable of providing a highly conformal dose distribution that conforms tightly to the target volume with minimal dose to the organs at risks (OARs).Reference Yang, Li and Yuan6,Reference Hardcastle, Tomé and Foo11,Reference Ashman, Zelefsky, Hunt, Leibel and Fuks15,Reference Myrehaug, Chan and Craig20,Reference Davidson, Blake and Batchelar21,Reference Jorgo, Polgar and Major23,Reference Joo, Kim and Kim24,Reference Ishii, Ogino and Hosokawa26,Reference Hesselberg, Fogarty and Haydu29,Reference Franzese, Fogliata and D’Agostino30,Reference Cahlon, Hunt and Zelefsky38,Reference Yoo, Wu and Lee39 In recent years, volumetric-modulated arc therapy (VMAT), which employs continuous dynamic modulation of dose rate, field aperture and gantry speed, has also been used to deliver radiotherapy due to its relatively short treatment delivery time, higher dose conformity and homogeneity.Reference Hardcastle, Tomé and Foo11,Reference Davidson, Blake and Batchelar21,Reference Hegazy, Mahmood and Otaibi28,Reference Hesselberg, Fogarty and Haydu29,Reference Buschmann, Sharfo and Penninkhof33,Reference White, Yee and Shan40 Several studies have reported that VMAT is capable of achieving equal or better target volume coverage and normal tissue sparing compared to IMRT.Reference Hardcastle, Tomé and Foo11,Reference Ishii, Ogino and Hosokawa27,Reference Buschmann, Sharfo and Penninkhof33,Reference White, Yee and Shan40 Hardcastle et al.Reference Hardcastle, Tomé and Foo11 compared the VMAT technique with IMRT and reported reduced rectal doses with the VMAT, significant reductions in delivery time and monitor units, even though target coverage was equivalent to the IMRT. According to Lawton et al.,Reference Lawton, Desilvio and Roach22 whole-pelvis radiotherapy provides significant benefit to patients with regard to progression-free survival when delivered with neoadjuvant and concurrent hormonal therapy. Several other studiesReference Matta, Chapple and Fisch10,Reference Poelaert, Fonteyne and Ost18,Reference Amini, Jones and Yeh32,Reference Song, Byun and Kim35,Reference Aizer, Anderson and Oh36 have also demonstrated the benefit of whole pelvis radiotherapy in terms of biochemical-free survival. Aizer et al.Reference Aizer, Yu, McKeon, Decker, Colberg and Peschel16 conducted a study on whole-pelvis radiotherapy versus prostate-only radiotherapy in the management of locally advanced or aggressive prostate adenocarcinoma. They reported that patients treated with whole-pelvis radiotherapy had an improved biochemical-free survival rate of 86.3% compared to patients treated with prostate-only radiotherapy with a biochemical-free survival of 69.4% and concluded that whole-pelvis radiation therapy potentially improves biochemical-free survival in patients with aggressive prostate cancer.
One of the challenges in treatment planning is the lack of consistency among different institutions and individuals with regard to what is considered an acceptable treatment plan in terms of target coverage and doses to the OAR. In clinical trials,Reference Peeters, Heemsbergen and Koper7,Reference Lawton, Desilvio and Roach22,Reference Pommier, Chabaud and Lagrange37,Reference Roach, Hsu and Chung41 this issue is usually resolved because there are usually well-defined criteria provided for treatment plan’s acceptability within the trial and any plan fulfilling the criteria is considered acceptable, whereas any plan not fulfilling the criteria may be considered unacceptable. This provision potentially lessens the stress on dosimetrists, as they can present treatment plans to radiation oncologists, which are less likely to be rejected. Furthermore, it improves confidence in dosimetrists, reduces variation in treatment plans and improves workflow and patient care.Reference Darko, Osei, Fleck and Rachakonda5 Despite these benefits, several institutions are yet to develop local institutional criteria for treatment plan’s acceptability based on local resources. Therefore, there is a growing need for the development of local site-specific treatment plan acceptability criteria in order to standardise and minimise variations in patients’ treatment plans. In order to develop institutional criteria for volume-based WPRT treatment plans acceptability based on our current experiences and resources, we conducted a comprehensive retrospective dosimetric analysis of WPRT plans for prostate cancer patients. This study reports on the dosimetric evaluation of VMAT technique for 2-phase WPRT for high-risk prostate cancer with lymph node metastasis patients treated at our cancer centre over a period of 3 years and suggest criteria for treatment plans acceptability. Implementation of such criteria would establish an evaluation process to define a consistent, standardised and transparent treatment path for all patients that reduces significant variations in the acceptability of treatment plans and potentially improve patient standard of care.
Materials and Methods
The retrospective analysis was performed on the basis of treatment plans for 179 prostate cancer patients treated over a period of 3 years at the cancer centre with the VMAT technique via RapidArc (Varian Medical Systems, Palo Alto, CA, USA) using 6 MV photon beam. The patients were stratified into two cohorts: WPRT plus a boost dose to the prostate and WPRT plus a boost dose to prostate bed. The first cohort composed of 114 patients treated with a total prescription dose of 78 Gy in 39 fractions (78 Gy/39): 46 Gy in 23 fractions was delivered to the whole pelvis, and a boost dose of 32 Gy in 16 fractions was delivered to the prostate. The second cohort consisted of 65 patients treated with a total prescription dose of 66 Gy in 34 fractions (66Gy/33): 46 Gy in 23 fractions was delivered to the whole pelvis, and a boost dose of 22 Gy in 11 fractions was delivered to the prostate bed.
Patient preparation
All patients underwent bladder and bowel preparation prior to computer tomography (CT) simulation. Patients were asked to empty their bladder and bowels if possible and then given 500 mL of water to drink followed by a wait period of about 30–60 minutes until the bladder was considered full.
CT simulation
All patients were positioned supine on a flat couch top with a leg immobiliser as per institutional protocol for prostate cancer patients CT scan. The head was positioned on a pillow and hands were placed on the chest. Radio-opaque markers were placed on the pelvis to define the tattoo localisation and patients scanned with 3 mm slice thickness from L3 to below the ischial tuberosity per institutional protocol. The bladder and rectal volumes were checked for adherence to our institutional protocol, namely, that the bladder dome pushes the small bowel superiorly and the rectal diameter is less than 5 cm. If these criteria are not met, the patient is removed from the couch with further instruction about bladder fullness or rectal emptying. In some cases, patients were asked to take milk of magnesia for 3 days and return for another CT scan if required. After CT scanning, tattoos were placed at the anterior, right lateral and left lateral setup points. The scan datasets were exported to the Eclipse treatment planning system (TPS) (Version 13.6: Varian Medical Systems, Palo Alto, CA, USA).
Target volumes and OAR
Contouring of all structures was standardised based on institutional guidelines and included the primary clinical target volume (CTV-primary) and CTV-nodes, primary planning target volume (PTV-primary) and PTV-nodes, rectum, bladder, bowel, right and left femurs. The CTV-primary was contoured to encompass the prostate and seminal vesicles or for post prostatectomy patients, the prostate bed. A radiation treatment planner usually contours the normal OAR including the rectum, bladder and the femurs and the radiation oncologist contours the CTV-primary and CTV-nodes. In some patients, T2-weighted magnetic resonance imaging (MRI) scans were used as part of the planning process. In such cases, the CT and MRI images were co-registered with one another within the Eclipse TPS (Varian Medical Systems, Palo Alto, CA, USA) and were used to better delineate the prostate volume. Standard expansions were applied to the CTVs to generate the PTV volumes; usually the PTV-primary expansion for the intact prostate is 10 mm circumferentially except 7 mm posteriorly and the PTV-primary expansion for the post prostatectomy prostate bed is 10 mm circumferentially. The PTV-nodal expansion was 5 mm circumferentially from the CTV-nodal volume. Additional structures were created to aid the VMAT optimisation process. The details of all structures contoured for prostate treatment at our institution have been described by Darko et al.Reference Darko, Osei, Fleck and Rachakonda5
Radiation treatment planning
A detailed description of the planning process including a summary of the plan optimisation objectives and the normal tissue objectives has been described by Darko et al.Reference Darko, Osei, Fleck and Rachakonda5 In summary, all plans were generated using the Eclipse external beam TPS, version 13.6 (Varian Medical Systems, Palo Alto, CA). The beam geometry for the VMAT plans consisted of two full arcs spanning 358° each with gantry angles of 180·1 to 179·9 in clockwise and 179·9 to 180·1 in counter-clockwise rotation to cover the PTV-primary and PTV-nodal regions for the phase-I treatment planning. A second set of arcs for phase-II boost planning covers the PTV-primary region. Collimator angles for each plan were typically up to 15° and 345°. VMAT plan optimisation was carried out by the progressive resolution optimiser, which considers the plan objectives for an increasing number of beam angles. To account for the attenuation properties of the couch-top used for treatment, the Varian Exact IGRT couch top model available in the Eclipse TPS was adopted and included in the dose optimisation and calculation. All treatment plans used 6 MV photons and a dose calculation grid size of 2·5 mm and incorporated heterogeneity corrections.
Daily treatment
Patients were instructed to arrive for daily radiation therapy with a full bladder and empty rectum and were set-up for treatment as per institutional protocol using tattoos and laser alignment. Treatments were delivered on either a Varian Clinac 2100iX Linac or Varian TrueBeam Linac, both with 120-leaf multi-leaf collimator (MLC). Daily cone-beam CT image guidance was used for setup verification and target localisation for all patients, and the cone beam computed tomography is matched to the pelvis bones for phase I (checking the prostate for inclusion) and matched to the prostate for phase II. If clips were present for postoperative prostate bed cases, they were used for alignment for the phase II. Rectum and bladder consistency was checked before treatment is delivered.
Indices for PTV
The plan quality in this study was quantitatively evaluated by calculating the HI, UI and the CI for each plan. The HI, CI and UI evaluate the dose homogeneity, conformity and uniformity, respectively, within the PTV-primary and are calculated as:
 $$HI = \frac{{{{D_2} - {D_{98}}}}\over{{DPD}}$$
 $$\hskip-22pt UI = \frac{{{{D_5}}}\over{{{D_{95}}}}$$
 $$\hskip-22pt CI = \frac{{{{V_{RI}}}}\over{{TV}}$$
where D2, D5, D95 and D98 are the doses received by 2%, 5%, 95% and 98% of the PTV-primary, respectively. DPD is the prescribed dose, VRI is the volume of PTV-primary covered by the reference isodose line (in this case the 95% isodose line) and TV is the target volume (in this case the PTV-primary). The values of CI and UI close to unity indicate greater conformity and uniformity, and values of HI close to zero indicate greater homogeneity.
Results
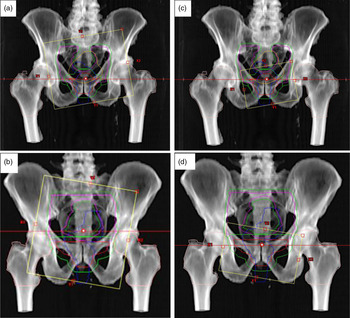
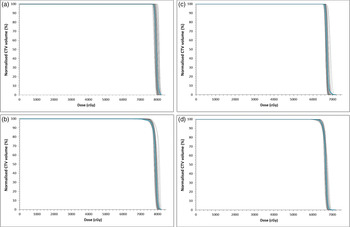
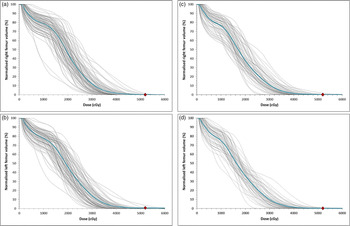
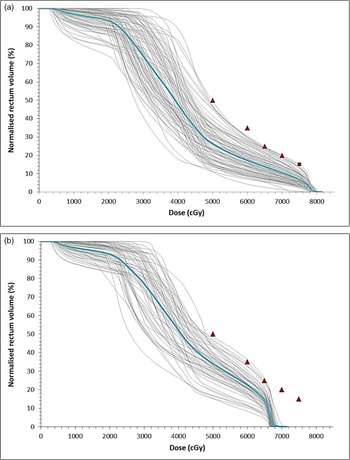
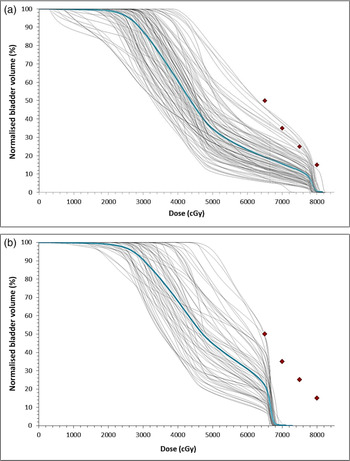
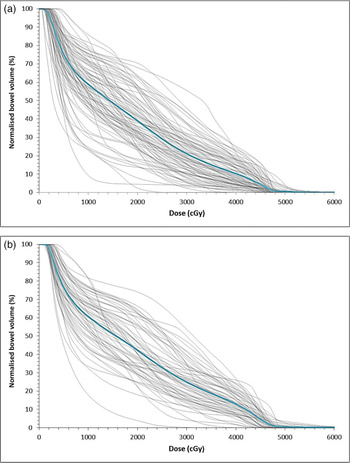
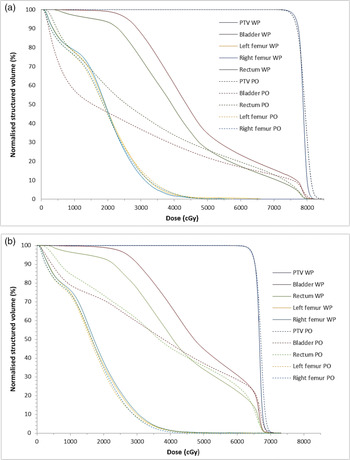
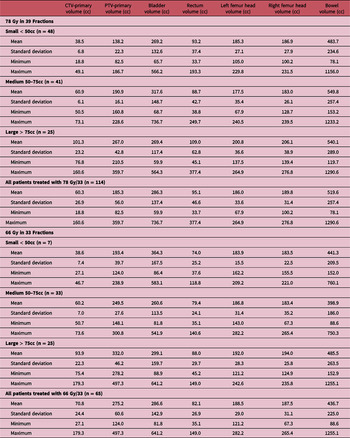
We have retrospectively performed a dosimetric analysis of 179 patients treated over a period of 3 years at our cancer centre. Figure 1 shows digital reconstructed radiographs (DRR) showing the field placements when treating the whole pelvis for intact prostate and post prostatectomy prostate bed patients and the boost field for the intact prostate and prostate bed. Figure 2 shows the dose-–volume histograms (DVHs) of the CTV-primary and PTV-primary volumes for all patients treated with a prescription dose of 78 Gy in 39 fractions (Figures 2a and 2b) and 66 Gy in 33 fractions (Figures 2c and 2d). The grey lines represent individual patients DVH and the blue lines in each plot are the mean DVHs. Similar DVH plots for the OAR; right and left femur, rectum, bladder and bowels are also shown in Figures 3-6, respectively. A comparison of DVHs for the 2-phase whole pelvis radiotherapy plus boost dose to the prostate/prostate bed treatment dose analysis (this work) and a single phase prostate/prostate bed-only radiotherapy plansReference Darko, Osei, Fleck and Rachakonda5 for patients treated at 78 Gy in 39 fractions (Figure 7a) and 66 Gy at 33 fractions (Figure 7b) is shown in Figure 7. Table 1 shows the statistical summary of patient target volumes (CTV-primary and PTV-primary) and OAR (rectum, bladder, femurs heads and bowel) volumes for all patients treated with a prescription of 78 Gy in 39 and 66 Gy in 33 fractions. The patients were stratified into three groups based on the size of the CTV-primary: small (< 50cc), medium (50 ≥ x ≤ 70cc) and large (> 70cc). Plan quality was determined by evaluating the homogeneity, uniformity and conformity indexes for the PTV-primary for all patients, and a statistical analysis of the indexes for the PTV-primary at 78 Gy/39 and 66 Gy/33 is shown in Table 2. The PTV-primary dose coverage was evaluated on the basis of the PTV-primary volume receiving 95%, 100% and 105% of the prescribed dose of 78 Gy and 66 Gy (V95%, V100% and V105%) for each cohort of patients and a summary of the statistical analysis of the normalised V95%, V100% and V105% for the PTV-primary volume is shown in Table 3. A summary of the statistical analysis of the dose–volume points to the rectum, bladder, femur heads and bowels, which are shown in Table 4 to Table 7, respectively. The rectum dosimetric analysis included the maximum dose, V50Gy, V65Gy,V66.6Gy, V70Gy, V75Gy and V80Gy, and for the bladder are the maximum dose, V40Gy, V50Gy, V65Gy, V66.6Gy, V70Gy, V75Gy and V80Gy. Conversely, for the left and right femurs, the doses at maximum, minimum and mean doses, as well as the V50Gy, ‘were analysed, and the bowel dosimetric analysis included the maximum, minimum and mean doses.
Digital reconstructed radiographs (DRR) showing the field placements when treating the whole pelvis for intact prostate (a) and post prostatectomy prostate bed (b) patients and the boost field for the intact prostate (c) and prostate bed (d). CTV-primary (prostate or prostate bed) = red, CTV_Pel (primary plus nodes) = magenta, PTV-primary (prostate plus margins) = green, PTV_Pel (prostate plus nodes plus margins) = dark green, bladder = orange, rectum = blue, femur heads = pink.

Dose–volume histograms (DVHs) of the CTV-primary and PTV-primary volumes for all patients treated with a prescription dose of 78 Gy in 39 fractions (Figures 2a and 2b) and 66Gy in 33 fractions (Figures 1c and 1d). The grey lines represent individual patients DVH, and the blue lines in each plot are the mean DVHs.

Dose–volume histograms (DVHs) of the right and left femur volumes for all patients treated with a prescription dose of 78 Gy in 39 fractions (Figures 2a and 2b) and 66 Gy in 33 fractions (Figures 2c and 2d). The grey lines represent individual patients DVH, and the blue lines in each plot are the mean DVHs. The red data point is the planning dose objective of maximum dose < 52 Gy.

Dose–volume histograms (DVHs) of the rectum volume for all patients treated with a prescription dose of 78 Gy in 39 fractions (Figures 3a) and 66 Gy in 33 fractions (Figures 3b). The grey lines represent individual patients DVH, and the blue lines in each plot are the mean DVHs. The red data points are the planning dose objectives of V50 Gy < 50%, V60 Gy < 35%, V65 Gy < 25%, V70 Gy < 20% and V75 Gy < 15%.

Dose–volume histograms (DVHs) of the bladder volume for all patients treated with a prescription dose of 78 Gy in 39 fractions (Figures 4a) and 66 Gy in 33 fractions (Figures 4b). The grey lines represent individual patients DVH, and the blue lines in each plot are the mean DVHs. The red data points are the planning dose objectives of V65 Gy < 50%, V70 Gy < 35%, V75 Gy < 25% and V80 Gy < 15%.


Comparison of dose–volume histograms (DVHs) for 2-phase whole pelvis radiotherapy plus boost to the prostate/prostate bed (this work) and single-phase prostate/prostate bed-only (PO) radiotherapy plansReference Darko, Osei, Fleck and Rachakonda5 for patients treated at 78 Gy in 39 fractions (Figure 6a) and 66 Gy at 34 fractions (Figure 6b).

Statistical analysis of patient targets (CTV-primary, PTV-primary) and organs at risk (bladder, rectum, left and right femur and bowel) volumes for patients treated with intact prostate at 78 Gy in 39 fractions and postoperative prostate bed at 66 Gy in 33 fractions

A summary of the statistical analysis of the homogeneity index, conformity index and uniformity index for the PTV-primary for prescription doses of 78 Gy in 39 and 66 Gy in 33 fractions and stratified by CTV-primary volume

A summary of the statistical analysis of the normalised PTV-primary volume receiving 95%, 100% and 105% of the prescribed dose of 78 Gy in 38 fractions and 66 Gy in 33 fractions

A summary of the statistical analysis of the normalised rectum volumes volume receiving 50 Gy, 65 Gy, 66.6 Gy, 70 Gy, 75 Gy and 80 Gy

A summary of the statistical analysis of the normalised bladder volume receiving 40 Gy, 50 Gy, 65 Gy, 66.6 Gy, 70 Gy, 75 Gy and 80 Gy

A summary of statistical analysis of the volumetric doses for the left and right femur heads at prescription dose of 78 Gy and 66 Gy

A summary of statistical analysis of the volumetric doses for the bowel at prescription doses of 78 Gy and 66 Gy

Discussion
Patient characteristics
We evaluated the dosimetric data of 179 prostate cancer patients treated over a period of 3 years at our cancer centre. For each patient, we determined the volumes of the prostate or prostate bed (CTV-primary), PTV-primary, rectum, bladder, right and left femur heads and bowels. There were 114 (64%) patients treated with a prescription of 78 Gy in 39 fractions and 65 (36%) treated with a prescription of 66 Gy in 33 fractions. When patients were stratified into three groups by the volume of the CTV-primary, there was a significant difference in the target (CTV-primary and PTV-primary) volume between patients treated with intact prostate (78 Gy) and postoperative prostate bed (66 Gy). The mean CTV-primary volumes for patients treated with 78 Gy and 66 Gy were 60.3 ± 26.9cc and 70.8 ± 24.4cc, respectively, and the corresponding mean PTV-primary volumes for patients treated at the same prescribed doses are 185.3 ± 56.0cc and 275.2 ± 60.6cc, respectively (Table 1). The mean bladder, rectum, left femur, right femur and bowel volumes for patients treated with 78 Gy are 286.3 ± 137.4, 95.1 ± 46.6, 186.0 ± 33.6, 189.8 ± 31.4 and 519.6 ± 257.4, respectively, and for patients treated with 66 Gy, the mean values are 286.6 ± 142.9, 82.1 ± 26.9, 188.5 ± 29.0, 187.5 ± 31.3 and 436.7 ± 225.0 for the bladder, rectum, left femur, right femur and bowel volumes, respectively (Table 1).
Plan quality evaluation
We quantitatively assessed the quality of the treatment plans by calculating the HI, UI and the CI for the PTV-primary for all patients. The mean HI, CI and UI for the PTV-primary of patients treated with intact prostate are 0.06 ± 0.01, 1.04 ± 0.01 and 0.99 ± 0.01, respectively, and the corresponding mean values for postoperative prostate bed patients are 0.06 ± 0.02, 1.05 ± 0.01 and 0.99 ± 0.01, respectively (Table 2). Yoo et al.Reference Yoo, Wu and Lee39 reported HI and CI for PTV-primary of 1.09 and 1.20 for double arc VMAT treatment plans, 1.10 and 1.25 for single arc VMAT treatment plans and 1.09 and 1.19 for IMRT treatment plans. When values of CI and UI are close to unity, it indicate greater conformity and uniformity, and when values of HI are close to zero, it indicate greater homogeneity; therefore, our data show superior dose conformity, uniformity and homogeneous to the PTV-primary for prostate VMAT plans irrespective of the size of the prostate, prostate bed or the prescription (Table 2).
Treatment plans dose evaluation
The DVH plots (Figures 2-6) extracted from patients treatment plans are used to quantitatively assess the acceptability of each treatment plan by examining the extent to which each plan achieved the target coverage and OAR dosimetric constraints. For target coverage, a plan is considered acceptable when at least 95% of the PTV-primary received at least 95% of the prescribed dose (Figure 2), and for the OARs, acceptability is determined based on the organ dose-–volume constraints (Figures 3-6). The dose–volume constraints used for the rectum are V50Gy < 50%, V60Gy < 35%, V65Gy < 25%, V70Gy < 20% and V75Gy < 15%; bladder dose constraints are V65Gy < 50%, V70Gy < 35%, V75Gy < 25% and V80Gy < 15% and for the femur heads is maximum dose < 52 Gy.
PTV dose analysis
The DVH plots in Figure 2 and data in Table 3 show that adequate target coverage was achieved for all patients which is the main objective of radiation therapy without compromising excessive dose to OAR in order to minimise toxicity. Our data show that for patients with intact prostate treated with a prescription of 78 Gy/39, the mean V95%, V100% and V105% are 99.5 ± 0.5%, 78.8 ± 12.2% and 0.1 ± 0.5%, respectively (Table 3). Similarly for postoperative patients treated with 66 Gy/34, the mean V95%, V100% and V105% are 99.3 ± 0.9%, 78.1 ± 10.6% and 0.1 ± 0.4%, respectively (Table 3). When patients were stratified into three cohorts based on the CTV-primary volume, that is, small: CTV<50cc, medium: 50≥CTV≤ 75cc and large: CTV>75cc, the target coverage was still found to be very adequate for all groups. Adequate target coverage is associated with tumour control which leads to improved biochemical relapse-free survival, cancer progression-free survival and cancer-specific survival. A study by Song et al investigated biochemical relapse-free survival in patients receiving whole-pelvis radiation therapy and reported a biochemical-free survival rate of 65.9% and concluded that patients undergoing radiation therapy after prostatectomy with whole-pelvis radiation therapy will have better biochemical relapse-free survival rates compared to prostate bed-only radiation therapy.Reference Song, Byun and Kim35 Poelaert et al.Reference Poelaert, Fonteyne and Ost18 studied the outcome of whole-pelvis radiation therapy in patients with positive pelvic lymph nodes and reported an estimated biochemical relapse-free survival of 67%, a cancer progression-free survival of 71% and a cancer-specific survival of 96%. Furthermore, they reported that patients treated with whole-pelvis radiation therapy, along with androgen deprivation therapy, show a promising cancer-specific survival.Reference Poelaert, Fonteyne and Ost18
OAR dose evaluation
In radiation therapy, the dose to the OAR is usually the dose-limiting factor for the target dose, and in the radiotherapy of prostate cancer, the rectum is the primary dose-limiting organ and therefore significantly influences the treatment prescribed dose and the plan quality. It has been reported that the V60Gy (i.e. the volume receiving ≥ 60Gy) of rectal volume is related to the risk of Grade ≥ 2 rectal toxicity or rectal bleeding.Reference Michalski, Gay and Jackson42 Moreover, late rectal injuries are also clinically expressed within 3–4 years after radiotherapy and may include stricture, diminished rectal compliance and decreased storage capacity. These morbidities can be severe and can significantly impact the quality of life of prostate cancer patients.Reference Darko, Osei, Fleck and Rachakonda5,Reference Michalski, Gay and Jackson42 According to Michalski et al.,Reference Michalski, Gay and Jackson42 the normal tissue complication probability model predicts that following a conventional DVH constraint for rectum of V50Gy < 50%, V60Gy < 35%, V65Gy < 25%, V70Gy < 20% and V75Gy < 15% would limit Grade ≥ 2 late rectal toxicity to < 15% and the probability of Grade ≥ 3 late rectal toxicity to < 10% for prescriptions up to 79·2 Gy with standard 1·8–2 Gy fractions. Furthermore, constraints for bladder of V65Gy < 50%, V70Gy < 35%, V75Gy < 25% and V80Gy < 15% are reported to limit Grade ≥ 3 bladder toxicity.Reference Roach, Hsu and Chung41,Reference Bentzen, Constine and Deasy43,Reference Viswanathan, Yorke and Marks44 Michalecki et al.Reference Michalecki, Gabryś and Kulik45 reported that the probability of radiation induced changes in bone (osteitis, fracture) depends on many factors, including the dose per fraction, total dose, dose intensity and irradiated volume. Tolerance doses such as TD5/5, TD50/5, which represent the dose of radiation that could cause no more than 5% and 50% severe complication rate within 5 years after irradiation, range from 20 to 30 Gy and 65 to 70 Gy for single and fractionated dose, respectively. Moreover, as the volume of irradiated bone or cartilage decreases, the dose to produce 5% or 50% complications increases.Reference Michalecki, Gabryś and Kulik45
Rectal dose analysis
We evaluated the rectal V50Gy, V65Gy, V66.6Gy, V70Gy, V75Gy and V80Gy (rectal volume receiving the indicated dose) and the estimated mean values are 26.8 ± 9.1%, 14.2 ± 5.3%, 13.1 ± 5.0%, 10.8 ± 4.3%, 6.9 ± 3.1% and 0.1 ± 0.1%, respectively, for patients with intact prostate treated with 78 Gy and 33.7 ± 8.4%, 14.1 ± 4.5%, 6.7 ± 4.5%, 0.0 ± 0.2%, 0.0% and 0.0%, respectively, for postoperative prostate bed patients treated with 66 Gy (Table 4). Several studiesReference Ishii, Ogino and Hosokawa26,Reference Ishii, Ogino and Hosokawa27,Reference Yoo, Wu and Lee39,Reference Deville, Vapiwala, Lin, Hwang, Tochner and Both46 have reported similar rectal doses for high-risk prostate cancer patients (involving whole pelvis treatment plus boost dose to the intact prostate or prostate bed) or low-intermediate-risk patients (involving treatment of the prostate or prostate bed only) using either three-dimensional (3D) conformal, IMRT or VMAT techniques. Ishii et al.Reference Ishii, Ogino and Hosokawa27 compared the dosimetric parameters between whole-pelvis and prostate-only radiotherapy VMAT plans in 224 patients with localised prostate cancer treated to 78 Gy in 39 fractions and reported V50Gy, and V70Gy of 26.5 ± 5.5% and 11.5 ± 3.9%, respectively. In another study, Ishii et al.Reference Ishii, Ogino and Hosokawa26 evaluated the dosimetric quality of whole-pelvis radiotherapy plans in 100 high-risk prostate cancer patients treated with VMAT and reported the V50Gy and V70Gy of 26.3 ± 4.9% and 11.3 ± 3.5%, respectively. Yoo et al.Reference Yoo, Wu and Lee39 compared the dosimetric parameters of VMAT treatment plans and conventional IMRT plans for high-risk prostate cancer patients and reported V70Gy of 9.7%, 12.0% and 10.5% for IMRT, single arc VMAT and double arc VMAT plans, respectively. Deville et al.Reference Deville, Vapiwala, Lin, Hwang, Tochner and Both46 assessed whole-pelvis and prostate-only IMRT plans and reported V65Gy and V70Gy of 14.8 ± 7.3% and 9.3 ± 5.4%, respectively, for whole-pelvis radiotherapy and V65Gy and V70Gy of 17.5 ± 5.1% and 12.4 ± 4.5%, respectively, for prostate-only radiotherapy. Darko et al.Reference Darko, Osei, Fleck and Rachakonda5 evaluated the dosimetric implementation of VMAT technique for treatment of low-risk prostate cancer patients and reported V50Gy, V60Gy, V65Gy, V70Gy and V75Gy of 26.0 ± 8.2%, 19.8 ± 6.3%, 16.7 ± 5.5%, 13.3 ± 4.6% and 8.6 ± 0.8%, respectively, for patients with intact prostate treated with 78 Gy/39 and V50Gy, V60Gy and V65Gy of 34.4 ± 9.1%, 24.1 ± 7.6% and 12.8 ± 6.6% for postoperative prostate bed-only patients treated with 66 Gy/33.
Bladder dose analysis
We estimated the mean V40Gy, V50Gy, V65Gy, V66.6Gy, V70Gy, V75Gy and V80Gy for the bladder volume as 59.8.1 ± 17.5%, 34.9 ± 15.3%, 19.6 ± 10.0%, 18.5 ± 9.6%, 16.0 ± 8.7%, 12.1 ± 7.1% and 0.4 ± 1.0%, respectively, for patients with intact prostate treated with 78 Gy (Table 5). For post prostatectomy patients treated with 66 Gy, the estimated mean V40Gy, V50Gy, V65Gy and V66.6Gy are 67.9 ± 19.1%, 44.8 ± 18.5%, 22.3 ± 10.3% and 11.0 ± 6.9%, respectively (Table 5). We compared our data with other studiesReference Darko, Osei, Fleck and Rachakonda5,Reference Ashman, Zelefsky, Hunt, Leibel and Fuks15,Reference Ishii, Ogino and Hosokawa26,Reference Ishii, Ogino and Hosokawa27,Reference Yoo, Wu and Lee39,Reference Deville, Vapiwala, Lin, Hwang, Tochner and Both46 who have reported bladder volume doses from radiotherapy of the prostate for either low-intermediate or high-risk patients and using various treatment techniques. Ashman et al.Reference Ashman, Zelefsky, Hunt, Leibel and Fuks15 investigated the dosimetric parameters for whole-pelvis radiotherapy for prostate cancer using either 3D conformal radiotherapy (3D-CRT) or IMRT and reported V40Gy of 39.8 ± 18.9% and 63.8 ± 16.8% for IMRT and 3D-CRT treatment plans, respectively. Ishii et al.Reference Ishii, Ogino and Hosokawa27 also reported V50Gy of 27.4 ± 10.8% and V70Gy of 11.1 ± 5.5% for VMAT treatment plans, whereas Yoo et al.Reference Yoo, Wu and Lee39 reported V65Gy of 17.1%, 18.9% and 17.3% for IMRT, single arc VMAT and double arc VMAT, respectively. In a study by Deville et al.,Reference Deville, Vapiwala, Lin, Hwang, Tochner and Both46 they reported bladder V40Gy, V65Gy and V70Gy of 60.6 ± 13.9%, 22.1 ± 9.6% and 15.7 ± 8.9%, respectively, for whole-pelvis radiotherapy and 45.8 ± 17.9%, 21.2 ± 9.0% and 16.6 ± 7.6%, respectively, for prostate-only radiotherapy treatment plans. Darko et al.Reference Darko, Osei, Fleck and Rachakonda5 also have reported bladder V40Gy, V50Gy, V60Gy, V65Gy, V70Gy and V75Gy of 28.2. ± 14.5%, 21.6 ± 11.4%, 16.7 ± 8.9%, 14.6 ± 7.9%, 12.5 ± 6.9% and 10.0 ± 5.8%, respectively, for low-risk patients with intact prostate treated with 78 Gy/39 and V40Gy, V50Gy, V60Gy, V65Gy of 47.6. ± 20.1%, 37.2 ± 16.6%, 28.8 ± 13.9%, 22.4 ± 12.2%, respectively, for post prostatectomy patients treated with 66 Gy/33 to the prostate bed only.
Femur heads dose analysis
The maximum, minimum and mean doses and the V50Gy of the left and right femur heads were extracted from each patient treatment plan and the estimated mean of the maximum dose and the V50Gy for the femur heads (right and left femur) for patients treated with 78 Gy are 45.1.0 ± 6.2 Gy and 0.1 ± 0.5%, respectively, and the corresponding mean for patients treated with 66 Gy are 44.3 ± 6.1 Gy and 0.1 ± 0.5%, respectively (Table 6). In a study by Darko et al.Reference Darko, Osei, Fleck and Rachakonda5 who evaluated the femur volume doses of low-risk prostate cancer patients, they reported mean of maximum femur doses of 40.1 ± 7.6 Gy and 40.5 ± 7.2 Gy for patients with intact prostate treated with 78 Gy and post prostatectomy prostate bed patients’ treatment with 66 Gy, respectively.
Bowel dose analysis
We also estimated that the mean of the maximum bowel doses for patients treated with 78 Gy and 66 Gy doses are 52.2 ± 7.1 Gy and 51.8 ± 6.5 Gy, respectively (Table 7), and the corresponding mean of minimum doses are 1.7 ± 1.9 Gy and 1.6 ± 0.5 Gy for 78 Gy and 66 Gy prescription doses, respectively. The mean of the mean bowel dose are 17.7 ± 4.7 Gy and 18.8 ± 4.1 Gy for 78 Gy and 66 Gy prescription doses, respectively. Similar values have been reported by other studiesReference Ashman, Zelefsky, Hunt, Leibel and Fuks15,Reference Yoo, Wu and Lee39,Reference Deville, Vapiwala, Lin, Hwang, Tochner and Both46 who investigated patients doses from prostate cancer radiotherapy. Ashman et al.Reference Ashman, Zelefsky, Hunt, Leibel and Fuks15 reported maximum and mean bowel doses of 47.0 ± 3.4 Gy and 27.0 ± 4.6 Gy for IMRT plans and 48.6 ± 3.1 Gy and 27.1 ± 5.9 Gy for 3D-CRT treatment plans, respectively. In a study by Deville et al.,Reference Deville, Vapiwala, Lin, Hwang, Tochner and Both46 they reported a mean of mean bowel dose of 27.2 ± 6.0 Gy for whole pelvis IMRT treatment plans and mean of minimum dose of 4.4 ± 2.4 Gy, and Yoo et al.Reference Yoo, Wu and Lee39 also reported mean bowel doses of 17.8 Gy, 19.8 Gy and 19.2 Gy for IMRT, single arc VMAT and double arc VMAT treatment plans, respectively.
Mean DVHs evaluation
The estimated mean DVHs for the OAR (bladder, rectum and femur heads) and the PTV-primary were compared with data in other studiesReference Darko, Osei, Fleck and Rachakonda5,Reference Ishii, Ogino and Hosokawa26,Reference Ishii, Ogino and Hosokawa27 who investigated the dosimetric parameters whole pelvis radiotherapy and a boost to the prostate/prostate bed or prostate-only radiotherapy to doses of either 78 Gy or 66 Gy. Darko et al.Reference Darko, Osei, Fleck and Rachakonda5 retrospectively evaluated the treatment plans of 300 VMAT plans for low-risk prostate cancer patients and reported mean DVHs for PTV-primary, bladder, rectum and femur head for all patients. We compared the mean DVHs in this study for high-risk prostate cancer patients with 2-phase (whole pelvis plus boost to the prostate/prostate bed) treatment to the mean DVHs from Darko et al.Reference Darko, Osei, Fleck and Rachakonda5 study for single phase (prostate/prostate bed) only treatment (Figure 7). We observed similar DVH plots for the PTV-primary and the right and left femur heads; however, there were significant difference in the mean DVHs for the bladder and rectum at the low-dose region but relatively similar at the high-dose region (Figure 7). The rectal and bladder volumes receiving low doses were significantly increased in the whole pelvis radiotherapy treatment plans; however, the volumes in the high-dose areas did not differ significantly between the two treatment plans. The bladder volume in the high-dose region was slightly lower for the whole pelvis radiotherapy plans but was similar for the rectum for the 78; however, they were both similar in the 66 Gy treatment plans. These observations were similar to the findings reported by Ishii et al.,Reference Ishii, Ogino and Hosokawa26 and Ishii et al.Reference Ishii, Ogino and Hosokawa27 who conducted similar studies.
Conclusion
The use of VMAT technique for 2-phase (i.e. whole pelvis treatment plus boost to the prostate/prostate bed) radiation therapy of high-risk prostate cancer patients is an efficient and reliable method for achieving superior dose conformity, uniformity and homogeneity to the PTV-primary and minimal doses to the OAR. The results of this study will help with the development of local criteria for treatment plans acceptability based on our resources and technology. The development and implementation of consistent treatment criteria in radiotherapy programs would establish an evaluation process to define a consistent, standardised and transparent treatment path for all patients that would reduce significant variations in the acceptability of treatment plans and potentially improve patient standard of care. Predefined dose–volume constraints and objectives can be achieved, resulting in improved dose optimisation and coverage of target volume, reduction in OAR volume receiving high doses and therefore with the potential to reduce the rate of toxicity, decrease pain and improve quality of life of prostate cancer patients. The results yielded from the dosimetric analysis of these VMAT treatment plans will prove helpful in evaluating the effectiveness of our current practices and consider changes necessary for optimal radiation treatment plans.
Acknowledgements
The authors would like to acknowledge with much gratitude the financial support from the Kitchener-Waterloo Chapter of the TELUS Ride For Dad and the Prostate Cancer Fight Foundation for this study. The authors would also like to acknowledge with much gratitude the support from Abraham Park who developed the code for extracting the patient’s data and all the staff in the oncology program.
Conflict of Interest
The authors declare that the research was conducted in the absence of any commercial or financial relationships that could be construed as a potential conflict of interest.