INTRODUCTION
Organochlorine pesticides (OCPs) and polychlorinated biphenyls (PCBs) are persistent, semi-volatile, highly toxic, transported long-distance and hydrophobic compounds with long-range transport potential. In particular, they have lipophilic properties in the marine environment (Yim et al., Reference Yim, Hong, Shim and Oh2005). Those compounds tend to accumulate in the fatty tissues and muscles of fish when they are absorbed by fish in water (Atamanalp & Yanık, Reference Atamanalp and Yanık2001). Fish has been considered as an indicator organism due to its accumulation potential for lipophilic compounds (Falandysz et al., Reference Falandysz, Wyrzykowska, Warzocha, Barska, Garbacik-Wesołowska and Szefer2004). Although fish consumption is very healthy for humans, fish is also an important source of these chemicals for human exposure (Storelli, Reference Storelli2008). Therefore, these pollutants have been of great concern owing to their presence in the food chain (Stefanelli et al., Reference Stefanelli, Di Muccio, Ferrara, Barbini, Generali, Pelosi, Amendola, Vanni, Di Muccio and Ausili2004). Horse mackerel can be found in every season in all the seas around Turkey, has an economic value and provides delicious meat that people usually prefer (Bostancı, Reference Bostancı2009).
The Sea of Marmara is considered to be contaminated by pesticides because it is surrounded by extensively used agricultural areas, industrial complexes and dense human populations (DPT, 2008). Therefore, determining the presence of pesticides is important not only in ecological terms but also for public health (Kalyoncu et al., Reference Kalyoncu, Ağca and Aktümsek2009).
In this study, some OCPs and PCBs were determined in horse mackerel samples obtained from four different coastal sites in the Marmara Sea and comparisons were made between the regions. The results were also evaluated considering the limit values with regard to public health and food safety; they can provide new scientific evidence on pesticide residues in fish in the Marmara Sea, Turkey.
MATERIALS AND METHODS
Sampling and preparation
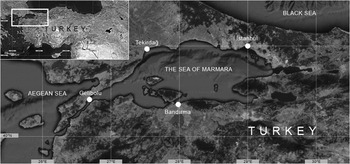
Horse mackerel (Trachurus trachurus Gronow 1854, Trachurus mediterraneus Steindachner 1868) samples were collected between October 2010 and October 2011. These samples were taken in four regions (Bosphorus, Bandırma, Gelibolu, Tekirdağ) near the Marmara Sea (Figure 1). Approximately 1 kg fish samples were captured by professional fishermen in compliance with the laws of fishing in each region and they were transported to the laboratory in PU foam boxes filled with ice within one day post-capture. Weight and length of each fish sample were measured in the laboratory (Table 1). Edible parts (muscle and skin) of fish samples were minced with an homogenizer (Retsch, GM 200, Germany), and then skin pieces were removed from homogenized fish samples. The remaining homogenized parts were re-homogenized to be combined in two consecutive monthly groups for each site as follows: I1 (November + December), I2 (January + February), I3 (March + April), I4 (May + June), I5 (July + August), I6 (September + October). The homogenates of combined groups contained ~50 mussel individuals.
Fish sampling regions (İstanbul, Bandırma, Gelibolu, Tekirdağ).

Information on fish samples.

a: Different letters in the same row indicate significant differences (P < 0.05).
The grouped fish samples were freeze-dried (Lyovac GT 3, Leybold-Heraeus, Germany), and then stored at −80°C until analysis. Before being freeze-dried homogenized groups were weighed and later freeze-dried samples were weighed again to determine the loss of water. Freeze-dried fish samples were transferred in capped plastic tubes (50 ml) coated with paraffin to Eurofins GfA Lab Service GmbH/ERGO Laboratory in Germany for analysis. All analyses were performed according to Eurofins House Method (SOP, 2005). While analysis was performed on dry weight, the results calculated based on wet weight are presented.
Extraction and clean-up procedure
Soxhlet extraction was used for the sample extraction. Flasks and the soxhlet system were pre-extracted with hexane/acetone (2:1) for 2 h. Then, samples were weighed into filter papers followed by adding quality (extraction) standard (LGC standards, CIL, CLM-1282-1,2, UK) (10 µl). Extraction was done with hexane/acetone (2:1) for 8 h. Extracted samples were washed twice with hexane. Centrifuge of extracted samples was repeated two additional times by adding potassium carbonate (2 ml).
For cleanup, glass columns filled with hexane, sodium sulphate, alox + water 6% and florisil + water 5% were eluted with hexane into flasks. Purified extracts were transferred to the columns with hexane and hexane:toluol (7/3), respectively. The rest of the extracts were evaporated using nitrogen gas and they were transferred to the vials by adding the internal standard solution. Thereafter, the same columns were cleaned up into turbo-vap glass tubes with hexane:toluene (7/3) and toluene, sequentially for detecting endosulfan. The second extracts were centrifuged by adding acetonitrile after evaporating with nitrogen gas. Remaining solution was transferred to the vials. CKW1W (LGC standards, CIL, EC-1420-1.2, UK) (5 µl) and PCBOCW (LGC standard, CIL, SCDI-019, UK) (10 µl) standards were added to the vials.
HRGC/HRMS analysis
Identification of OCPs (total-HCH (α-HCH, β-HCH, γ-HCH, δ-HCH), total-DDT (o,p-DDT, p,p’-DDT, p,p’-DDD), Endrin, α-endosulfan, β-endosulfan, Heptachlor) and PCBs (PCB 28, PCB 52, PCB 138, PCB 153, PCB 180) residues in fish samples were analysed using two different HRGC/HRMS-instruments: Thermo Scientific model High Resolution Gas Chromatograph (HRGC) and Agilent 6893 Series GC System model High Resolution Mass Spectrometry (HRMS). The HRGC was equipped with a 60 m capillary column (Restek RTX/200) with 0.25 mm ID and film thickness 0.25 µm thickness; whereas, the HRMS was equipped with 60 m column (Agilent DB-5 ms), 0.25 mm diameter and 0.25 µm film. The oven temperature program of the HRGC and the oven temperature program of HRMS were as follows: 90°C for 3 min, 25°C min−1 to 210°C, 2.0°C min−1 to 233°C and then held 10 min to 300°C. The levels of OCPs and PCBs were determined according to standard chromatograms by using the peak area.
Statistical analysis
Statistical analysis was performed with SPSS 21.0 (SPSS Inc. Chicago, IL). The normality of distribution was evaluated using one-sample Kolmogorov–Smirnov test and the Levene test was used for homogeneity of variance. Data were analysed by one-way ANOVA. Scheffé and Tamhane's T2 test were applied for multiple comparison. Statistical significance was expressed at P < 0.05.
RESULTS
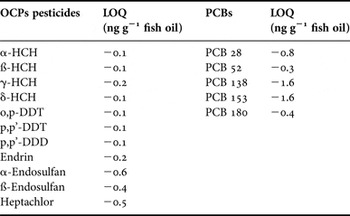
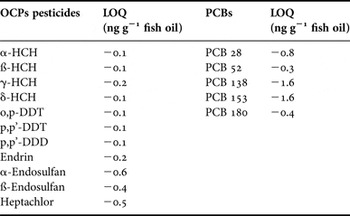
Table 1 shows information related to the fish samples. Limit of quantification (LOQ) values are shown in Table 2. Wet weight (Ww) and lipid weight (Lw) based annual average concentrations of OCPs and PCBs in horse mackerel samples are presented in Tables 3 and 4, respectively.
LOQ (Limits of quantification with ng g−1 fish oil) of OCPs and PCBs.
Annual average (ng g−1, wet weight (Ww) and lipid weight (Lw)) OCPs concentrations in fish samples from Marmara Sea coast sites in 2010 and 2011.

-, not detected; (), Detection limit-LOD; a (wet), x (lipid), Different letters in the same row indicate significant differences (P < 0.05).
Annual average (ng g−1, wet weight (Ww) and lipid weight (Lw)) PCB-concentrations in fish samples from Marmara Sea coast sites in 2010 and 2011.

a (wet), x (lipid), different letters in the same row indicate significant differences (P < 0.05).
DISCUSSION
Horse mackerel, an economical and popular fish highly preferred and consumed, has potential health risks associated with pesticide contamination in the Marmara Sea (Di Bella et al., Reference Di Bella, Licata, Bruzzese, Naccari, Trombetta, Lo Turco, Dugo, Richetti and Naccari2006; Bostancı, Reference Bostancı2009). In this study, the results based on wet weight are discussed although the results are presented on a wet and lipid weight basis. According to Meisner et al. (Reference Miesner2000), assessments based on wet weight of organic pollutants give more accurate results to reveal how much people are exposed to these pollutants. Tuomisto et al. (Reference Tuomisto, Vartiainen and Tuomisto2011) stated that PCBs are often expressed per wet weight in fish and other food items to easily calculate human intake as well. In this study, neither heptachlor nor α-endosulfan was detected in the horse mackerel samples caught from all regions. Likewise, Barlas et al. (Reference Barlas, Coelhan, Bayat, Ozturk, Kadıoglu and Ozturk2000) and Coelhan et al. (Reference Coelhan, Strohmeier and Barlas2006) have indicated that heptachlor was not detected in fish samples from the Marmara Sea. Heptachlor may be reduced to undetectable amounts because heptachlor is quickly converted to heptachlorepoxide and other metabolites (El Nabawi et al., Reference El Nabawi, Heinzow and Kruse1987). Unlike the α-endosulfan results of the present study, some researchers have detected α-endosulfan in several fish samples caught or contaminated from the Black Sea, Turkey (Erkmen & Kolankaya, Reference Erkmen and Kolankaya2006; Kalyoncu et al., Reference Kalyoncu, Ağca and Aktümsek2009; Çakıroğulları & Secer, Reference Çakıroğulları and Secer2011). Β-endosulfan was detected in fish samples caught only from the Tekirdağ Region, which was lower than the results of previous studies (Erkmen & Kolankaya, Reference Erkmen and Kolankaya2006; Kalyoncu et al., Reference Kalyoncu, Ağca and Aktümsek2009; Çakıroğulları & Secer, Reference Çakıroğulları and Secer2011). Aksu et al. (Reference Aksu, Balkıs, Taşkın and Erşan2011) found the presence of α and β-endosulfan in hake samples from waters close to Istanbul and Gelibolu. However, α and β-endosulfan concentrations in hake samples from waters close to Tekirdağ were not detected in their study. El Nabawi et al. (Reference El Nabawi, Heinzow and Kruse1987) also reported that β-endosulfan was not detected in any fish samples from Abu Qir Bay, Egypt.
Endrin was only not determined in fish samples caught from the Gelibolu Region. There were no significant differences among the other regions for annual mean endrin values (P > 0.05). Bozcaarmutlu et al. (Reference Bozcaarmutlu, Turna, Sapmaz and Yenisoy-Karalaş2014) determined endrin in flathead mullet captured from the Black Sea. Contrary to the present results, Uluocak & Egemen (Reference Uluocak and Egemen2005) could not detect endrin in red mullet, grey mullet, seabream and sole from Aliaga and Izmir Bay. In another study, endrin was not found in anchovy samples caught from the Black Sea (Çakıroğulları & Secer, Reference Çakıroğulları and Secer2011).
The highest annual mean ∑ DDT could be noticed in fish samples captured from the Gelibolu coast. There were no significant differences between the regions with regard to annual means of total-DDT levels in both wet and lipid weights of fish samples (P > 0.05). Some recent studies have shown that DDT was determined in horse mackerel samples (Tanabe et al., Reference Tanabe, Madhusree, Ozturk, Tatsukawa, Miyazaki, Ozdamar, Aral, Samsun and Öztürk1997b; Barlas et al., Reference Barlas, Coelhan, Bayat, Ozturk, Kadıoglu and Ozturk2000; Coelhan et al., Reference Coelhan, Strohmeier and Barlas2006). DDT was also found in several fish samples except for horse mackerel in Turkey (Erdoğrul et al., Reference Erdoğrul, Covacı and Schepens2005; Uluocak & Egemen, Reference Uluocak and Egemen2005; Erkmen & Kolankaya, Reference Erkmen and Kolankaya2006; Kalyoncu et al., Reference Kalyoncu, Ağca and Aktümsek2009; Çakıroğulları & Secer, Reference Çakıroğulları and Secer2011; Bozcaarmutlu et al., Reference Bozcaarmutlu, Turna, Sapmaz and Yenisoy-Karalaş2014). OCP-concentrations in fish samples were dominated by total-DDT followed by total-HCH in this study, similar to the results found by Barlas et al. (Reference Barlas, Coelhan, Bayat, Ozturk, Kadıoglu and Ozturk2000), Erdoğrul et al. (Reference Erdoğrul, Covacı and Schepens2005), Coelhan et al. (Reference Coelhan, Strohmeier and Barlas2006), Çakıroğulları & Secer (Reference Çakıroğulları and Secer2011) and Georgieva et al. (Reference Georgieva, Stancheva and Makedonski2012). This could be explained by the fact that DDT has high chemical and thermal stability (Di Bella et al., Reference Di Bella, Licata, Bruzzese, Naccari, Trombetta, Lo Turco, Dugo, Richetti and Naccari2006). Moreover, the presence of total-DDT in an aquatic environment indicates its illegal use in nearby field agriculture areas and contamination from other regions because of atmospheric activities, sea flow, and different migration and feeding habits of aquatic organisms (Tuncer et al., Reference Tuncer, Karakas, Balkas, Gökçay, Aygnn, Yurteri and Tuncel1998; Aksu et al., Reference Aksu, Balkıs, Taşkın and Erşan2011). The results also showed that concentrations of total-DDT were mostly much higher than total-HCH in the fish samples. Similarly, several researchers have found that the total-DDT was the predominant component in fish samples (El Nabawi et al., Reference El Nabawi, Heinzow and Kruse1987; Barlas et al., Reference Barlas, Coelhan, Bayat, Ozturk, Kadıoglu and Ozturk2000; Aksu et al., Reference Aksu, Balkıs, Taşkın and Erşan2011). The reason for higher total-DDT values is the low biodegradability and highly lipophilic character of DDT components (Guo et al., Reference Guo, Zeng, Wu, Meng, Mai and Luo2007; Hongsheng, Reference Hongsheng2011), and input from the Black Sea to the Marmara Sea as mentioned by Aksu et al. (Reference Aksu, Balkıs, Taşkın and Erşan2011). Another reason is that HCH has less bioaccumulation in the marine environment and aquatic organisms, lower lipophilicity compared with DDT, high biodegradability, high rates of hydrolysis and high vapour pressure. Discrepancy of physicochemical and biochemical properties between HCH and DDT may also affect the results (Guo et al., Reference Guo, Zeng, Wu, Meng, Mai and Luo2007; Özkoç et al., Reference Özkoç, Bakan and Arıman2007; Said et al., Reference Said, El Moselhy, Rashad and Shreadah2008).
When the annual mean total OCP amounts were compared, the highest annual mean amounts of total-OCPs were found in fish samples caught from Gelibolu and Tekirdağ. Annual mean total-OCP concentrations between the regions ranged as follows: Gelibolu > Tekirdağ > Bandırma > Istanbul. The results may be attributed to pollution caused by previously used total-DDT and current illegal use of total-DDT in Gelibolu and Tekirdağ regions located in the intensive agricultural areas. Besides, existence of OCPs in the Marmara Sea may also depend on inputs from the Black Sea, atmospheric conditions, as well as agricultural activities. Seasons, the age of the fish and regions may cause the difference in the levels of OCPs between the regions, as previously mentioned (Uluocak & Egemen, Reference Uluocak and Egemen2005). The current total OCP amounts in horse mackerel samples caught in the Marmara Sea were lower than those in fish samples caught in the Black Sea reported by Georgieva et al. (Reference Georgieva, Stancheva and Makedonski2012), Stoichev et al. (Reference Stoichev, Makedonski, Trifonova, Stancheva and Ribarova2007) and Tanabe et al. (Reference Tanabe, Madhusree, Ozturk, Tatsukawa, Miyazaki, Ozdamar, Aral, Samsun and Öztürk1997b). This may be related to a closed basin of the Black Sea, inputs of fresh OCPs from countries neighbouring the Black Sea and intensive land-based pollutants. Unlike our results, Aksu et al. (Reference Aksu, Balkıs, Taşkın and Erşan2011) postulated that the concentrations of total-OCPs in hake collected from the Prince Islands (Istanbul) were higher than those from the Marmara Sea close to Gelibolu and Tekirdağ. The total OCP levels were in the range of 444, 99.3 and 217 ng g−1 (Ww) in hake samples collected from Istanbul, Gelibolu and Tekirdağ, respectively in their study. The difference could be because of hake being a demersal fish.
Endrin and α-endosulfan detected in the samples remained below detection limits (FAO, 1983; Hussein, Reference Hussein2012). The concentrations of total-DDT and total-HCH in fish samples were also well below the limit values in accordance with FAO (1983), US FDA (2011) and National Academy of Sciences & National Academy of Engineering (1972). On the other hand, total-DDT concentrations in I1, I2, I3 coded horse mackerel samples caught from the Gelibolu region and I3 coded fish samples caught from the Tekirdağ region exceeded the limit value (14 ng g−1) proposed by the Canadian Council of Ministers of the Environment (2001).
In this study, PCB 153 followed by PCB 138 was the predominant congener found in the horse mackerel samples from all regions. The result is in accordance with several studies (El Nabawi et al., Reference El Nabawi, Heinzow and Kruse1987; Tanabe et al., Reference Tanabe, Madhusree, Amaha, Tatsukawa, Miyazaki, Ozdamar, Aral, Samsun and Öztürk1997a; Barlas et al., Reference Barlas, Coelhan, Bayat, Ozturk, Kadıoglu and Ozturk2000; Bayarri et al., Reference Bayarri, Baldassarri, Iacovella, Ferrara and Domenico2001; Erdoğrul et al., Reference Erdoğrul, Covacı and Schepens2005; Coelhan et al., Reference Coelhan, Strohmeier and Barlas2006). However, our results are not compatible with the Çakıroğulları & Secer (Reference Çakıroğulları and Secer2011) finding that PCB 52 was predominant in anchovy samples caught from the Black Sea. Çakıroğulları et al. (Reference Çakıroğulları, Uçar, Oymael, Bozkurt and Kılıç2010) reported that PCB 153 and PCB 138 are the most commonly found congeners in fish. Widespread presence of PCB 153, PCB 138, PCB 180 and PCB 118 may be attributed to their lipophilicity, persistence, stability and adsorption of these compounds in aquatic ecosystems (Naso et al., Reference Naso, Perrone, Ferrante, Bilancione and Lucisano2005). Lipid solubility and biomagnification both increase with increasing chlorination degree (Tuomisto et al., Reference Tuomisto, Vartiainen and Tuomisto2011).
Generally, PCB 28 and PCB 52 were the lowest detected PCB components in the fish samples caught from all regions. Our results are inconsistent with Barlas et al. (Reference Barlas, Coelhan, Bayat, Ozturk, Kadıoglu and Ozturk2000) who stated no presence of PCB 28 and PCB 52 concentrations in horse mackerel samples collected from Istanbul fish market. In another study, PCB 52 was detected with higher concentration levels than our results in the samples while PCB 28 could not be detected (Çakıroğulları & Secer, Reference Çakıroğulları and Secer2011). The results of annual mean total PCBs in horse mackerel samples were lower than those found in several fish samples by Erdoğrul et al. (Reference Erdoğrul, Covacı and Schepens2005). These findings were also lower than those found in horse mackerel, red mullet, anchovy, whiting and mackerel samples by Tanabe et al. (Reference Tanabe, Madhusree, Amaha, Tatsukawa, Miyazaki, Ozdamar, Aral, Samsun and Öztürk1997 Reference Tanabe, Madhusree, Ozturk, Tatsukawa, Miyazaki, Ozdamar, Aral, Samsun and Öztürkb), Georgieva et al. (Reference Georgieva, Stancheva and Makedonski2012), Tanabe et al. (Reference Tanabe, Madhusree, Amaha, Tatsukawa, Miyazaki, Ozdamar, Aral, Samsun and Öztürk1997a) and Bayarri et al. (Reference Bayarri, Baldassarri, Iacovella, Ferrara and Domenico2001), respectively.
There were no significant differences between the regions in terms of annual means of PCB levels in both wet and lipid weight of fish samples (P > 0.05). When the annual means of total PCB levels were compared, the highest annual mean level of total-PCBs was found in fish samples obtained from the Istanbul region. This was probably because urbanization, industrial areas and the heavy ship traffic of the Istanbul region are more intense than those in other regions. Input of PCBs to the area was also indicated by Barlas et al. (Reference Barlas, Coelhan, Bayat, Ozturk, Kadıoglu and Ozturk2000). Turkey still does not have a regulation on the official use control and sale of PCBs (Çok et al., Reference Çok, Görücü, Satiroglu and Demircigil2003).
In this study, PCB values determined in fish samples were mostly lower than the total-DDT and total-HCH values, similar to those found by El Nabawi et al. (Reference El Nabawi, Heinzow and Kruse1987). Similarly, Barlas et al. (Reference Barlas, Coelhan, Bayat, Ozturk, Kadıoglu and Ozturk2000) found that PCB concentrations in horse mackerel samples caught from Istanbul were lower than OCP concentrations. This could be correlated to entrances of DDT directly or indirectly to the Marmara Sea as Barlas et al. (Reference Barlas, Coelhan, Bayat, Ozturk, Kadıoglu and Ozturk2000) mentioned. Lower presence of PCBs may also depend on marine currents, different migratory and feeding habits of aquatic organisms, decrease of PCB release into the environment over the last 30 years (Di Bella et al., Reference Di Bella, Licata, Bruzzese, Naccari, Trombetta, Lo Turco, Dugo, Richetti and Naccari2006; Magnusson et al., Reference Magnusson, Ekelund, Grabic and Bergqvist2006), as well as lower bioaccessibility of PCBs in high-lipid food (Xing et al., Reference Xing, Yang, Chan, Tao and Wong2008). Recent studies indicate that physicochemical properties of lipid content in food affect the bioaccessibility of PCBs, as well as PCBs having lipophilic features (Hongsheng, Reference Hongsheng2011).
The current results of PCBs in horse mackerel samples were lower than those found in horse mackerel, red mullet, anchovy, whiting and mackerel samples by Tanabe et al. (Reference Tanabe, Madhusree, Amaha, Tatsukawa, Miyazaki, Ozdamar, Aral, Samsun and Öztürk1997b), Georgieva et al. (Reference Georgieva, Stancheva and Makedonski2012), Tanabe et al. (Reference Tanabe, Madhusree, Amaha, Tatsukawa, Miyazaki, Ozdamar, Aral, Samsun and Öztürk1997a) and Bayarri et al. (Reference Bayarri, Baldassarri, Iacovella, Ferrara and Domenico2001), respectively.
PCB values determined in fish samples from all regions were below the maximum limit reported by the EU Commission (2011) and Turkish Food Codex (2011) in the study. However, total PCB values exceeded the cancer health endpoint (a one in 100,000 risk level) given by the US EPA (2000), if monthly consumption is unrestricted.
In the current study, the amounts of OCPs and PCBs accumulated in the horse mackerel samples did not appear to be related to their lipid content. Present findings are in agreement with those of Çakıroğulları & Secer (Reference Çakıroğulları and Secer2011), El Hraiki (Reference El Hraiki1993), Manchester-Neesvig et al. (Reference Manchester-Neesvig, Valters and Sonzogni2001) and Uluocak & Egemen (Reference Uluocak and Egemen2005). There was also no difference in fish samples between the regions with regard to OCP levels. Likewise, El Hraiki (Reference El Hraiki1993) found that there was no difference between the regions (four different stations in Morocco) where horse mackerel samples were caught. The researcher also stated that the reason for that was the proximity of sampling regions.
The results show that OCP and PCB levels in horse mackerel samples were below acceptable limits in the study. Hence, it was concluded that horse mackerel from the Marmara Sea have no risks for consumer health. Concentrations of OCPs and PCBs in the fish samples seem to be commonly lower than those stated for the Black Sea. However, records of annual periodical data on pesticide concentrations are required to protect public health and to establish food security policies in Turkey. Furthermore, pesticide detection programmes need to be enhanced to estimate the public health risk from possibly contaminated fish and seafood.
ACKNOWLEDGEMENTS
The authors thank Eurofins GfA Lab Service GmbH for the analysis of the study and also the sales manager of Eurofins GfA Lab Service GmbH Emin Özden for his assistance during the analysis of the study.
FINANCIAL SUPPORT
This work was supported by the Research Fund of Istanbul University (Grant numbers 10262 and 20807).