Dairy sheep breeders consider the improvement of milk quality traits (MQT) in order to meet the industry's demands and ensure good pricing of their milk. The use of high-cost, complicated analysers for the assessment of MQT requires well-equipped laboratories, specialised staff, appropriately organised farmers’ networks and cooperatives, logistics for the transferring of samples, and a considerable capital investment to support the endeavour. Predicting MQT using daily milk yield (DMY) and physicochemical traits of milk, which can be easily and inexpensively measured on farm, could help overcome the difficulties posed by the demanding prerequisites associated with the use of expensive and specialised infrastructures and personnel for complicated MQT analyses. It can further facilitate the selection of the highest yielding animals and flocks in remote and less favoured areas, where the option of using the aforementioned analysers is not available. For this reason, some of the selected physicochemical traits which can be routinely used are milk electrical conductivity (MEC), refractive index (RI) and pH. Studies on cows’ milk have showed that MEC and RI are correlated with milk's fat, protein and total solids content (Jääskeläinen et al. Reference Jääskeläinen, Peiponen and Räty2001; Mabrook & Petty, Reference Mabrook and Petty2003; Chigerwe & Hagey, Reference Chigerwe and Hagey2014), whereas pH has not been found to be significantly correlated with MQT (Atasever et al. Reference Atasever, Erdem and Altop2010). Similar studies regarding the correlation between physicochemical traits and MQT in sheep milk are missing.
In our study, the hypothesis was that DMY and milk physicochemical traits can be efficiently used as predictors to estimate MQT, utilising low-cost, readily-used analysers that are suitable for on-farm use.
Material & methods
Animals and management
A total of 308 purebred multiparous Frizarta ewes, from two representative semi-intensive high investment dairy sheep flocks, as described by Gelasakis et al. (Reference Gelasakis, Valergakis, Arsenos and Banos2012), allocated at Aitoloakarnania, Greece were randomly selected for the study. The flocks were managed under similar management schemes and the feeding was the same, according to the instructions of the cooperative's technical experts and advisors. On both farms measurements were made during December 2014, one week after the weaning of lambs.
Experimental design
From each individual ewe, a composite milk sample, obtained from a portable, ICAR-accredited (International Committee for Animal Recording) milk meter (Waikato MKV Milk Meter, Waikato Milking Systems) was collected in 50-ml capacity tubes during milking. For each individual sample physicochemical traits and MQT were measured as described in detail in online Supplementary File Additional Materials and Methods. Briefly, MEC, pH and RI were measured using a handheld pentype pH/conductivity meter (EZDO 7200, GMM Technoworld®) and a portable optical refractometer (RHW-25ATC-BE, Hong Han Technologies). Furthermore, milk samples were assayed for fat, protein, lactose and total solids content, using an automatic infrared milk analyser (MilkoScan™, Foss). DMY was calculated according to ICAR recommendations.
Statistical analyses
A stepwise multiple linear regression model was developed in order to assess the predictive value of DMY, pH, MEC and RI of milk on its quality traits as described below.
 $$Y= a + b_{\rm 1} X_{\rm 1} + b_{\rm 2} X_{\rm 2} + b_{\rm 3} X_{\rm 3} + b_{\rm 4} X_{\rm 4} + e$$
where, Y = the predicted variable (fat, protein, lactose and total solids content), a = intercept, b 1 = regression coefficient of DMY in kg (X 1), b 2 = regression coefficient of pH (X 2), b 3 = regression coefficient of MEC in ms/cm (X 3), b 4 = regression coefficient of RI in °Bx (X 4) and e = error term. Outliers, ewes with SCC > 106 and observations with missing values were removed from the data set. This resulted in data from 300 individual ewes to be further considered for the modelling. Although SCC was measured using flowcytometry (Fossomatic™), and found to be highly correlated with MEC, it was not used for the development of the prediction equations of MQT, because it requires specialised and costly equipment which cannot be used on a daily routine basis in sheep flocks under a point of service concept.
In order to avoid violations of the assumptions of normality, linearity and homoscedasticity, preliminary analyses were performed, by visually assessing the plots of standardised residuals against standardised predicted values and histograms, as well as, probability-probability plots (P-P plots) of regression standardised residuals. Variance inflation factor (VIF) was calculated for each predictor to ensure there was no violation of the assumption of multicollinearity. The internal validity of the prediction equations was evaluated by bootstrapping techniques. For bootstrapping, 1000 randomly assigned bootstrap samples were recalculated from the complete data set. Coefficients, standard errors, 95% confidence intervals and P-values for the overall model and for the predictors were calculated for both the original and the bootstrap samples.
For each one of the prediction models the number of correctly predicted highest yielders within the 100 observed highest yielders and the number of mispredicted highest yielders within the 100 observed lowest yielders were calculated. Moreover, the overall costs for implementing both the physicochemical analyses (pH, RI and MEC) and MQT (fat, protein, lactose and total solids content) were estimated as described in the online Supplementary File Additional Materials and Methods.
For the statistical analyses, the statistical software IBM SPSS 21 was used and the statistical significance was set at P ≤ 0·05 level.
Results and discussion
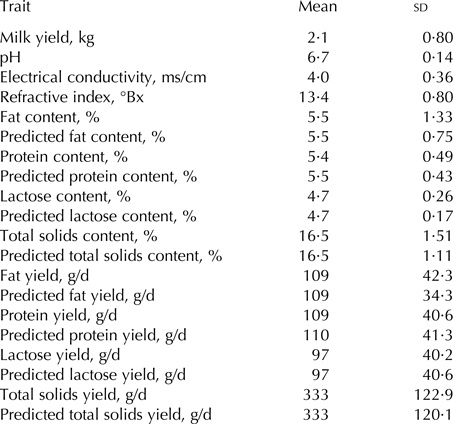
Table 1 summarises the descriptive statistics of milk yield, the physicochemical properties and MQT of Frizarta ewes. Average DMY was ca. 2·1 kg per ewe. Fat, protein and lactose content were ca. 5·5, 5·4 and 4·7%, respectively, whereas, the average values for pH, MEC and RI of milk were ca. 6·7, 4·0 ms/cm and 13·4 °Bx, respectively. The assumptions of normality, linearity and homoscedasticity were verified (online Supplementary Fig. S1) and the assumption of multicollinearity was not violated in any case.
Mean value and standard deviation of chemical composition and physicochemical properties of milk produced by the studied Frizarta ewes population

Prediction of milk quality traits
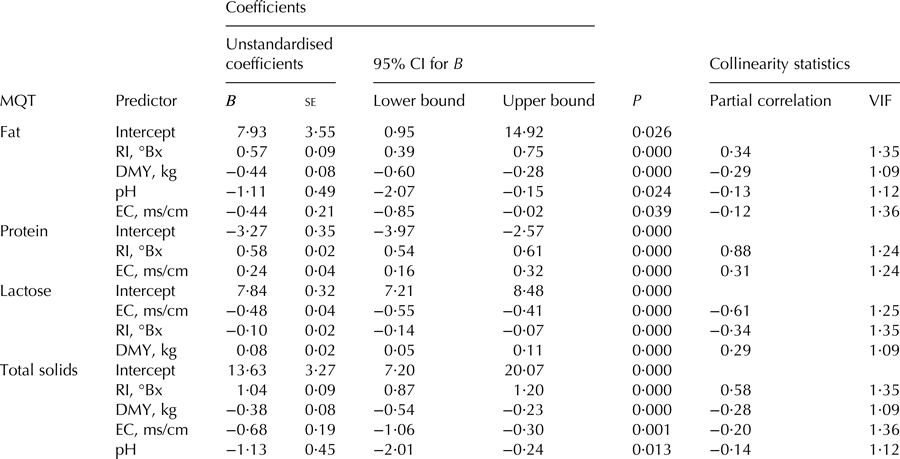
To the best of our knowledge, this is the first time that equations for the prediction of MQT post-weaning, using measurements of milk yield and milk physicochemical traits (MEC, RI and pH) as predictors, have been developed for sheep milk. In the model predicting milk fat content, RI, DMY, pH and MEC were retained as significant predictors (P < 0·001, P < 0·001, P < 0·05 and P < 0·05, respectively, Table 2). The model accounted for ca. 31% of milk fat content variance (R 2 = 0·311) and produced a significant regression equation [F(4, 295) = 34·7, P < 0·001] equal to 7·93 + 0·57 × (RI) − 0·44 × (DMY) − 1·11 × (pH) − 0·44 × (MEC).
Summary statistics, coefficient estimates β, correlations and results for the predictors in the stepwise linear regression analysis for the prediction of milk fat, protein, lactose and total solids content (%)

CI, Confidence Interval; MQT, Milk Quality Trait; VIF, Variance Inflation Factor; RI, Refractive index; DMY, Daily milk yield; EC, Electrical conductivity.
RI and MEC were significant predictors of milk protein content (both at P < 0·001 level), whereas, DMY and pH were not (Table 2). These two predictors accounted for ca. 78% of milk protein content variance (R 2 = 0·777) and the produced prediction equation was significant [F(2, 297) = 523·0, P < 0·001] and equal to −3·27 + 0·58 × (RI) + 0·24 × (MEC).
Milk lactose content was significantly predicted by RI, MEC and DMY (all of them at P < 0·001 level, Table 2); the three predictors accounted for ca. 43% of milk lactose content variance (R 2 = 0·426), producing a significant regression equation [F(3, 296) = 75·1, P < 0·001], which was equal to 7·84 − 0·10 × (RI) − 0·48 × (MEC) + 0·08 × (DMY).
In the case of total solids content, RI, DMY, MEC and pH were all significant predictors and accounted for ca. 54% of total solids content variance (R 2 = 0·542, Table 2); pH failed to remain a significant predictor after bootstrapping. The developed regression equation was significant F(4, 295) = 89·6, P < 0·001 and total solids content was equal to 13·63 + 1·04 × (RI) − 0·38 × (DMY) − 0·68 × (MEC) − 1·13 × (pH).
The predicting equations seem to work better for the prediction of protein and total solids content, rather than for fat and lactose content. In the case of protein content, this is possibly associated with the very high correlation between protein and RI which, also seems to increase the prediction ability of total solids content (total solids content is the sum of fat, protein, lactose and minerals content).
Research in dairy cattle has showed that the pH of milk is not an effective predictor of MQT (Ikonen et al. Reference Ikonen, Morri, Tyrisevä, Ruotinnen and Ojala2004; Atasever et al. Reference Atasever, Erdem and Altop2010). This is in accordance with our findings, where pH was not a significant predictor in most of the studied MQT with the exception of milk fat content. On the contrary, we found RI to be a significant predictor of all the studied MQT. This is consistent with the results from studies on cows’ milk showing that RI tends to be a linear function of milk's fat, protein and total solids content (Jääskeläinen et al. Reference Jääskeläinen, Peiponen and Räty2001; Chigerwe & Hagey, Reference Chigerwe and Hagey2014). MEC is positively associated with milk protein content and negatively associated with milk fat, lactose and total solids content. Similar results regarding the effect of protein content on MEC have been reported for cows’ milk by Mabrook & Petty (Reference Mabrook and Petty2003). According to them, caseins which are the main proteins of milk, are known to have a rather low conductivity when compared to milk salts, but can still affect the overall milk conductivity through the insoluble salts which can be linked to the casein micelles in the colloidal phase. Over time, these micelles break down and the salts are released causing an increase on MEC. The negative association between milk fat content and MEC is also observed in goats’ and cows’ milk and attributed to the poorer electrical conductivity of fat in comparison to the other milk constituents (Park, Reference Park1991; Zywica et al. Reference Zywica, Banach and Kielczewska2012). Α negative correlation between lactose content and MEC has also been observed in cows’ milk by Yoshida et al. (Reference Yoshida, Lopez-Villalobos and Holmes2005), which is consistent with our findings. Predicting MQT can be 762 to 1012 euros cheaper comparing to mid-infrared analyses (online Supplementary File Additional Materials and Method). Apart from the economic benefits, an important advantage of self-assessment of MQT is the farmer's capability of selecting the most convenient time to undertake the measurements and record the results within the farm's routine. On the contrary, the analyses of MQT in specialised labs, although less labour intensive for the farm, requires efficient communication between the farmer and the lab, well-organised logistics for transferring the samples within a specific and usually restricted time frame, and adjustments of the farm's routine according to the availability of the logistics company and the lab's capability to perform the analyses.
Using the models, 75, 94, 97 and 92 out of the 100 highest fat-, protein-, lactose- and total solids- yielders, respectively, were correctly predicted, whereas only three out of the 100 lowest fat yielders were mispredicted as high fat yielders and none out of the 100 lowest protein-, lactose- and total solids- yielders were mispredicted as high yielders. This justifies the use of the models as reliable tools for benchmarking activities towards selecting the highest protein-, fat-, lactose- and total solids- yielding animals and flocks. This is crucial in remote and developing areas, where laboratories for MQT analyses may be difficult to access. It is also significant for dairy industry which can assess MQT of interest quickly and on-farm before collecting the milk.
In any case, both farmers and farm consultants need to be trained on the appropriate sampling and measuring procedures to follow every time the same protocol. They also need to be aware of the appropriate equipment and how to use it. For the instruments used in the study routine calibration is necessary, but this does not add complexity to procedures as the calibration standards are readily available and the steps required during calibration are very simple.
Farm consultants can use these measurements periodically, to assess MQT at ewe and flock level, to adjust flock's management and animal's nutrition, to select the most productive animals, to justify colostrum quality and to diagnose subclinical mastitis, under a point of service (POS) plan. Hence, milk yield and milk physicochemical traits assessment can be efficiently promoted for the establishment of a more effective management plan and they can be added to the list of the routine services that are expected to strengthen the professional interrelationship between farmer and consultant and increase the latter's participation and influence on farm's management.
In all models significant predictors remained the same and at the same level of significance after bootstrapping, with the exception of pH which failed to remain a significant predictor in the model predicting milk total solids content (online Supplementary Table S2). However, external validation of the models, using milk produced by several dairy sheep breeds, reared under various farming systems and management schemes and in different time-points within lactation is required in order to enhance generalisability of the models’ capacity to make accurate predictions in dairy sheep farms.
Conclusion
Although automatic infrared milk-analysers remain the gold standard for the measurement of milk quality traits, the prediction of milk protein, lactose and total solids content using DMY, RI, and MEC as predictors, is a useful alternative method for the estimation of these traits. Following their validation, these models can be efficiently applied in cases where laboratories for MQT analyses are unavailable or too expensive. They can also be used, at the farm level, for the selection of the highest MQT yielders, irrespective of the breed, the farming system or the participation of the farm in national genetic improvement programs.
Supplementary material
The supplementary material for this article can be found at https://doi.org/10.1017/S0022029917000772.
The Laboratory of Milk Quality Control of the Hellenic Milk and Meat Organization (ELOGAK, Epirus Department), Georgios Antonakos, Vasilios Konstantinou and the farmers from the Agricultural Cooperative of Western Greece are greatly acknowledged for their contribution to the study.