

The cleavage of κ-casein, catalysed by chymosin or other enzymes with comparable substrate specificity, induces one of the most important phase conversion processes in dairy technology. The separation of the caseinomacropeptide (CMP) from the surface of the casein micelle and its release into the whey are responsible for casein flocculation and aggregation which further leads to casein micelle fusion; a weak gel is the resulting macroscopic evidence of the formation of a three-dimensional network (Walstra et al. Reference Walstra, Wouters and Geurts2006).
Analytical methods for following action and kinetics of κ-casein cleaving enzymes include chemical approaches, mainly the quantification of the liberated CMP by HPLC (van Hooydonk & Olieman, Reference van Hooydonk and Olieman1982), or physical methods which follow the changes induced by milk clotting enzymes on a phenomenological basis. As regards the latter category it is necessary to distinguish between phenomena caused by κ-casein cleavage itself in the primary phase, and secondary effects which are a direct consequence of that action, i.e., gel formation. State-of-the-art experimental techniques for characterising gel formation include small amplitude oscillation with versatile rheometers or with dedicated instruments such as the formagraph (Bencini, Reference Bencini2002; Horne, Reference Horne2003), or optical techniques which follow changes in the scattering of light of different sources (Huppertz & de Kruif, Reference Huppertz and de Kruif2007; Klandar et al. Reference Klandar, Lagaude and Chevalier-Lucia2007).
One of the oldest methods for measuring enzyme-induced milk flocculation, which goes back to Sommer & Matsen (1935) and which is now an element of standard procedures for the determination of the activity of milk clotting enzymes (ISO, 2002, 2006, 2007), is based on the visual determination of the flocculation onset in rotating bottles; the corresponding measure is usually denoted as clotting time (tC). For the Berridge method, the bottles are smaller and rocking in a water bath instead of rotating (Huppertz & de Kruif, Reference Huppertz and de Kruif2007). It is also known that CMP liberation reduces the diameter of the casein micelles by a few nanometers, which decreases the volume fraction of dispersed casein micelles and leads to a small but significant decrease in milk viscosity (Mellema et al. Reference Mellema, Leermalers and de Kruif1999). Whereas Scott-Blair & Burnett (Reference Scott-Blair and Burnett1963) and, later, Lomholt & Qvist (Reference Lomholt and Qvist1997) used capillary viscometry to follow CMP release and the primary phase of casein destabilisation, Kopelman & Cogan (Reference Kopelman and Cogan1975) monitored the onset of flocculation by rotational viscometry and estimated clotting time from viscometry as the time where ‘a steep linear increase in viscosity intersects a horizontal base line’. In the primary phase of enzymatic κ-casein degradation, a decrease of apparent viscosity of approximately 4–8% has been quantified by Guthy & Novak (Reference Guthy and Novak1977), Lomholt & Qvist (Reference Lomholt and Qvist1997) and Guthy et al. (Reference Guthy, Auerswald and Buchheim1989). In all of these studies, however, viscosity measurements were performed without accompanying flocculation tests.
The objective of this study was to determine viscosity changes in the primary phase of enzymatic κ-casein cleavage, to relate the output of these measurements to the results of flocculation tests, and to verify whether rotational viscometry has the potential to be used instead of the current, laborious reference method of visual flocculation measurement.
Materials and Methods
Materials
Three fermentation-produced coagulants (Chy-MaxTM Plus and ChymaxTM M from Chr. Hansen A/S, Horsholm, Denmark, and Maxiren 180 from DSM Food Specialties, Seclin, France) were used in the study. A chymosin standard was obtained from Chr. Hansen A/S. Coagulants were stored in a refrigerator (5°C).
Skim milk was reconstituted by dissolving 110 g spray-dried low-heat milk powder (Alpavit Käserei Champignon Hofmeister GmbH & Co. KG, Lauben/Allgäu, Germany) in 1000 ml of a 0·5 g CaCl2/l solution (ISO 2007). Moisture content of the milk powder was 43 g/kg (IDF, 1993), total nitrogen content was 56·8 g/kg (IDF, 2001), and undenatured whey protein nitrogen was 6·7 g/kg (ADPI, 2009). For complete dissolution, the reconstituted milk was kept for 12–16 h at 5°C while stirring. Microbial growth was prevented by adding 0·3 g sodium azide/l. Prior to measurements, milk pH was adjusted to 6·4, 6·5 or 6·6 with 1 m HCl.
Design of the study
Apart from the coagulants, independent factors in a 33 full factorial design were temperature and pH which were varied at three levels each (30, 32 or 34°C, and 6·4, 6·5 or 6·6, respectively). Separately for each experiment, the coagulants were diluted with acetate buffer, pH 5·5 (ISO, 2007) to obtain a solution with 4 International Milk Clotting Units (IMCU) per ml. After adding diluted enzyme solution to milk in a ratio of 1:100, which corresponds to 40 IMCU per l milk, clotting time determinations, rotational viscometry and dynamic rheometry were applied. Additional viscosity measurements were carried out at selected temperatures, pH and reduced CaCl2 concentration (0·1 or 0·2 g/l). For the reconstitution of skim milk with reduced calcium content, CaCl2 solutions with corresponding concentrations were used. All experiments were performed within a time span of two months.
Clotting time determination
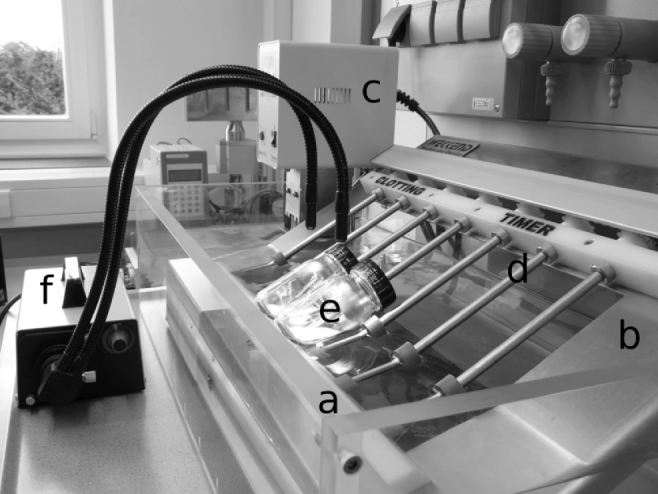
Clotting time measurements were performed with a device and the method as described in ISO (2007). For the initial determination of the clotting strength of the enzymes, 25 ml reconstituted skim milk, pH 6·5, were transferred into 100 ml glass bottles which were placed on rotating rods in a water bath set to 32±0·1°C (Fig. 1). Inclination angle of the rods was 30°, rotational speed was set to 3·5 rpm, and a FLQ 85E cold light illumination system (Olympus Optical Co GmbH, Hamburg, Germany) was placed in front of the bottles. After temperature equilibration, 0·5 ml of diluted coagulant or chymosin standard were added. tC of coagulants and reference chymosin, defined as time span from enzyme addition to the first visually observable flocs, was then used to calculate clotting strength in IMCU/ml. Clotting time in the supplementary video sequence is approximately 66 s.
The online video can be viewed at http://journals.cambridge.org/dar2011001.
Design of the instrument used for clotting time determination. a, water bath; b, frame; c, circulator; d, rotating rod; e, rotation bottle with milk; f, light source.

For the determination of clotting times of the sample set (i.e., milk with varying temperature and pH), the coagulants were diluted to ensure that an addition of 0·25 ml to 25 ml milk corresponds to 40 IMCU/l. All clotting time determinations were performed in triplicate.
Rotational viscometry and dynamic rheometry
A stress-controlled AR-G2 rheometer (TA Instruments GmbH, Eschborn, Germany) equipped with a double gap geometry and Peltier temperature control was used. Outer and inner stator radius was 22·34 mm and 20·00 mm, outer and inner rotor radius was 21·96 mm and 20·38 mm, respectively, and bob height was 59·5 mm. 25 ml milk adjusted to the required temperature were spiked with 0·25 ml of diluted coagulant, mixed and the necessary amount (approximately 7 ml) was immediately transferred into the cup of the rheometer. The rotating cylinder was lowered and a shear rate of 50/s was applied. Preliminary experiments showed that reconstituted skim milk proved to be Newtonian in the shear rate range of 1–200/s (1·38±0·017 mPa.s at 32°C, n=3), and 50/s were selected to achieve a sufficiently stable output signal of the viscometer. Recording of apparent viscosity (ηA) was started 1 min after enzyme addition.
In separate experiments, the enzyme-induced gelation of milk was monitored using oscillatory time sweeps (Jaros et al. Reference Jaros, Seitler and Rohm2008). Input strain was set to 0·003, angular frequency was 1 rad/s, and the storage modulus (G’) was measured as a function of time. These experiments were performed in duplicate.
Results and Discussion
At the beginning of the study, actual clotting strengths of the coagulants were 204±2·9 IMCU/ml (Chy-MaxTM Plus), 964±4·8 IMCU/ml (Chy-MaxTM M), and 195±3·3 IMCU/ml (Maxiren 180). These data are in close agreement with the declared activity given by the providers (190, 970 and 180 IMCU/ml, respectively), and all further experiments were carried out on the basis of the experimentally determined values. Clotting strength of the coagulants did not change significantly while this study was being completed (data not shown).
For the entire data set, average tC (n=3) ranged between 721±7·6 s (Chy-MaxTM Plus at 34°C, pH 6·4) and 1848±16·6 s (Maxiren 180, 30°C, pH 6·6). Although any systematic influence of coagulant, temperature and pH on tC is out of the scope of this study and these factors were primarily varied to provoke different clotting time, it should be mentioned that it is both the increase in temperature from 30 to 34°C and the decrease in pH from 6·6 to 6·4 which caused a reduction of tC by a factor of approximately 2·5. Statistical evaluation of the entire data set by three-factor analysis of variance revealed that the influence of pH and temperature was significant (P<0·01), whereas the coagulant effect was insignificant (P > 0·05). An impact of temperature and pH on gelation onset in small amplitude oscillatory shear of a similar magnitude have been shown by Nájera et al. (Reference Nájera, de Renobales and Barron2003) and Jaros et al. (Reference Jaros, Seitler and Rohm2008). For all 27 samples, the coefficient of variation for the (n=3) determinations was less than 2%.
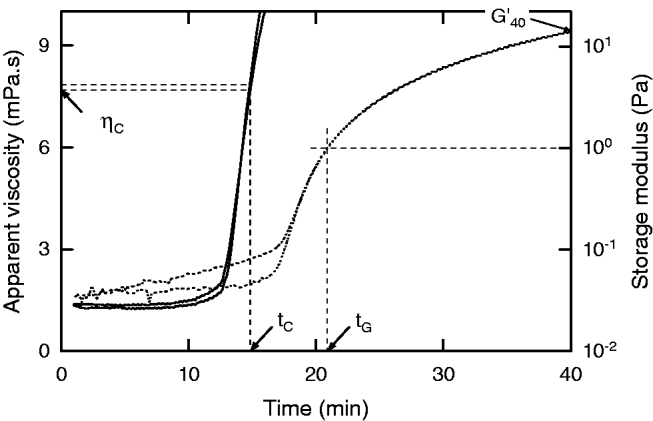
For reconstituted skim milk with 40 IMCU/l ChymaxTM M, temperature 32°C, pH 6·4, Fig. 2 shows the development of apparent viscosity after coagulant addition, and the corresponding gelation curve from small amplitude rheometry. In this particular sample, ηA decreased by 4·5% within 7–8 min after adding the enzyme; this drop is, however, not visible to the naked eye in this graph because of the scaling. Arithmetic mean and standard deviation of shear viscosity at the beginning of the experiments was 1·39 mPa.s. At approximately 12 min, apparent viscosity started to increase significantly. When a value of ∼20 mPa.s was exceeded (data not shown), the curves became irregular and/or showed some off-levelling. This behaviour reflects the processes which start with the primary phase where CMP is enzymatically cleaved from κ-casein, leading to an initial decrease of ηA (Mellema et al. Reference Mellema, Leermalers and de Kruif1999) and subsequent aggregation which, when the system remains undisturbed, leads to coagulation of the milk (increase in ηA).
Development of apparent viscosity (full lines) and gel stiffness (dotted lines) during gel formation (duplicate experiment). 40 IMCU/l ChymaxTM M were added to reconstituted skim milk, 32°C, pH 6·5. tC is clotting time measured by the rotating bottle reference method (n=3), tG is gelation time, ηC is apparent viscosity at tC, and G’40 is storage modulus 40 min after enzyme addition.

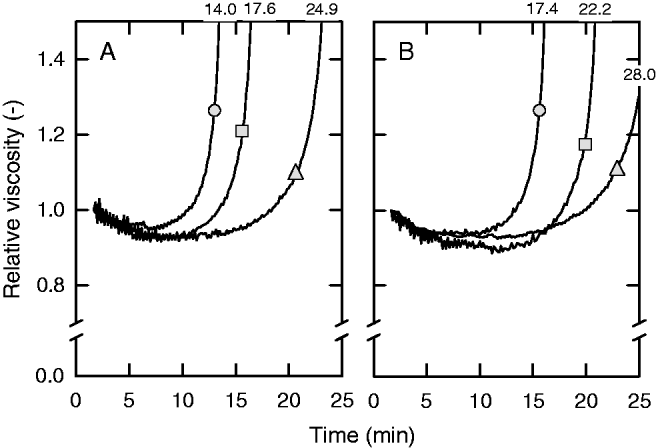
Similar effects of κ-casein cleavage on milk viscosity have also been shown by Guthy & Novak (Reference Guthy and Novak1977) who, using capillary viscometry, reported a viscosity decrease of 0·2 mPa.s but did not specify an absolute viscosity value. Lomholt & Qvist (Reference Lomholt and Qvist1997) used another type of capillary viscometer, stopped their experiments before the milk had started to flocculate and, for 10% reconstituted milk, reported an apparent viscosity of 1·29 mPa.s and a viscosity decrease of up to 5%. Guthy et al. (Reference Guthy, Auerswald and Buchheim1989) specified a viscosity decrease of 0·14 mPa.s by using a rotational viscometer and a mixture of milk and glycerol as substrate (initial viscosity was 2·78 mPa.s). For Chy-MaxTM Plus and 32°C milk temperature, Fig. 3 exhibits the influence of pH at constant CaCl2 concentration (0·5 g/l), and the impact of CaCl2 concentration at pH 6·5 on milk viscosity in the primary phase of milk clotting and at starting aggregation in more detail and also shows how the initial part of the viscosity curve is related to tC from reference measurements. After setting initial viscosity (∼1·4 mPa.s) to unity, the relative viscosity (ηR) decreased by a factor between 0·03 and 0·08. Differences in the slope of dηR/dt immediately after coagulant addition (<5 min) were not pronounced; for example, the decrease of relative viscosity for the curves given in Fig. 3A was 0·012/min, 0·015/min and 0·014/min for a pH of 6·4, 6·5 and 6·6, respectively. It was mainly the flocculation which started earlier at lower pH or higher CaCl2 concentration, which also determines the macroscopic behaviour of the entire system.
Evolution of relative milk viscosity after coagulant addition. 40 IMCU/l ChymaxTM Plus were added to reconstituted skim milk, 32°C. (A) CaCl2 addition was 0·5 g/l, and pH was 6·4 (circle), 6·5 (square) or 6·6 (triangle). (B) pH was 6·5, and CaCl2 addition was 0·5 g/l (circle), 0·2 g/l (square) or 0·1 g/l (triangle). Each curve is the averaged response from duplicate measurements. Numbers above the curves refer to clotting time measured by the rotating bottle reference method in min.

Fig. 2 also exhibits for this sample that, at an average (n=3) tC of 14·8 min, the apparent viscosity at visual clotting time (ηC) is 7·5 and 7·8 mPa.s (duplicate measurements). At tC, the changes which occurred in the milk were hardly reflected by the oscillatory experiments. Approximately 2 min after tC was passed, the slope of dG’/dt almost immediately started to increase. Gelation time (tG), which has frequently been defined as the time where G’ exceeds 1 Pa (Horne, Reference Horne1998; Lopez et al. Reference Lopez, Lomholt and Qvist1998) was achieved at approximately 21 min. It is, however, also evident that aggregation and network formation started earlier, and it is merely a question of instrument sensitivity to obtain reliable results for G’<1.
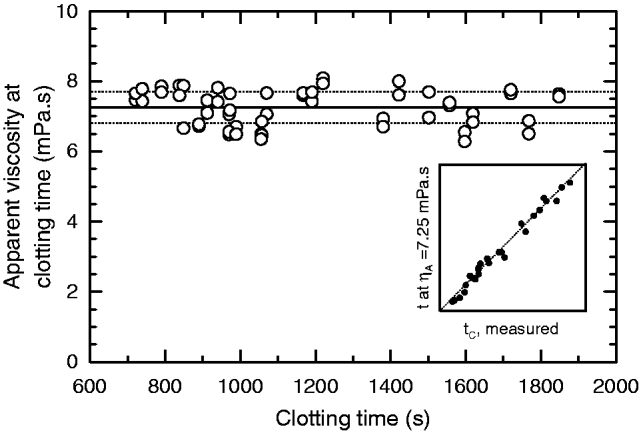
For the entire sample set, apparent viscosity at clotting time is plotted versus visual clotting time analyzed by the reference method (Fig. 4). ηC ranged between 6·4 and 8·0 mPa.s, arithmetic mean±standard deviation was 7·24±0·45 mPa.s (n=54), and the coefficient of variation was 6·2%. All experimental ηC data are within  , and relative viscosity at tC is 5·2±0·22. If clotting time is read from viscosity curves as the time span until a viscosity of 7·24 mPa.s is reached, this measure would be underestimated in samples with ηC higher than 7·24 mPa.s, and overestimated in samples with ηC lower than 7·24 mPa.s. The insert to Fig. 4 shows the corresponding agreement between tC measured by the rotating bottle method, and clotting time read from viscosity curves. The relative differences between tC from the reference method and clotting time taken from viscosity curves can be regarded as a measure for the accuracy of the viscosimetric method; these differences are 0·11±3·35% on average (n=27) and range between −5·4% and +5·8%. By considering all data, tC is significantly interrelated with tG (R2=0·94, P<0·01, tG (s)=−62·4 s+1·41 tC), and inversely related with G’40, which refers to gel stiffness after 40 min gelation (Jaros et al. Reference Jaros, Seitler and Rohm2008; R2=0·95, P<0·01, tC (s)=1420 s−33·7 (s/Pa) G’40).
Apparent viscosity at clotting time (n=2) versus average clotting time (n=3, rotating bottle reference method) for 27 samples. The solid and dotted horizontal lines refer to average viscosity and standard deviation, respectively. The insert (x- and y-scaling identical to x-scaling of main graph) gives clotting time predicted from apparent viscosity as a function of measured clotting time.

Conclusion
Our results show that, using standardised reconstituted skim milk as a substrate, the time where visual clotting is determined by the rotating bottle reference method corresponds to an apparent viscosity of 7·24±0·45 mPa.s measured in a rotational viscometer. Viscometry might therefore be used for the indirect measurement of clotting time, provided that a calibration data set is used to specify clotting-time related viscosity which might be influenced by instrument characteristics or measuring geometry. As compared with the reference method using the rotating bottles (ISO, 2002, 2007), there is no need for a technical setup that is not available on a commercial basis, whereas rotational viscometers are almost routine equipment in a modern laboratory. Other drawbacks of the reference method are that it requires the presence of an operator during the measurement, and that clotting time determination is based on the subjective visual perception of flocs, which can hardly be documented other than by pencil and paper. A device with time-based electronic documentation gives operator-independent data, and allows retrospective analysis.