Introduction
In the past 25 years, research on early development of physical aggression (PA) has been strongly influenced by social learning theories suggesting that the onset and development of PA is mainly determined by accumulated exposure to aggressive role models in the social environment and the media (Bandura, Reference Bandura1978; Crick & Dodge, Reference Crick and Dodge1994; Anderson & Bushman, Reference Anderson and Bushman2002; Ferguson, Reference Ferguson2013). However, the results of studies on early childhood PA indicate that PA starts during infancy and peaks between the ages of 2 and 4 years (NICHD Early Child Care Research Network, 2004; Tremblay et al. Reference Tremblay, Nagin, Seguin, Zoccolillo, Zelazo, Boivin, Perusse and Japel2004; Alink et al. Reference Alink, Mesman, van Zeijl, Stolk, Juffer, Koot, Bakermans-Kranenburg and van Ijzendoorn2006; Côté et al. Reference Côté, Vaillancourt, LeBlanc, Nagin and Tremblay2006, Reference Côté, Boivin, Nagin, Japel, Xu, Zoccolillo, Junger and Tremblay2007; Tremblay, Reference Tremblay2010). These studies also show that, although for most children the use of PA peaks during early childhood, there is substantial heterogeneity in both frequency at onset and rate of change of PA. This heterogeneity is probably due to the interplay of genetic and environmental factors over time (Rhee & Waldman, Reference Rhee and Waldman2002; van Lier et al. Reference van Lier, Boivin, Dionne, Vitaro, Brendgen, Koot, Tremblay and Perusse2007). To the best of our knowledge, no study has investigated this early heterogeneity in PA development, including its putative gene–environment underpinnings, using a longitudinal twin study.
Meta-analyses of genetically informed studies of disruptive behavior and different forms of aggression generally concluded that genetic factors account for approximately 50% of the variance (Miles & Carey, Reference Miles and Carey1997; DiLalla, Reference DiLalla2002; Rhee & Waldman, Reference Rhee and Waldman2002; Tuvblad et al. Reference Tuvblad, Narusyte, Grann, Sarnecki and Lichtenstein2011). There are also some indications that shared environmental influences on antisocial or disruptive behavior decrease with age from childhood to early adulthood (Rhee & Waldman, Reference Rhee and Waldman2002, Viding et al. Reference Viding, Larsson and Jones2008; Burt, Reference Burt2009, Reference Burt2012). However, behavior genetic studies of preschool children have mostly focused on temperamental characteristics such as anger/frustration and irritability rather than on PA per se (Deater-Deckard et al. Reference Deater-Deckard, Petrill and Thompson2007; Gagne & Goldsmith, Reference Gagne and Goldsmith2011; Saudino & Ganiban, Reference Saudino and Ganiban2011). One study did examine genetic and environmental contributions to the stability of the Child Behavior Checklist (CBCL) ‘aggression’ scale from childhood to early adolescence (van Beijsterveldt et al. Reference van Beijsterveldt, Bartels, Hudziak and Boomsma2003). Genetic transmission (i.e. initial) and innovation (i.e. new) contributions explained 65% of individual differences in PA over time, while shared and non-shared environment accounted for 25% and 10%, respectively. There are, however, two important limitations to this study. First, the nine-item CBCL ‘aggression’ scale that was used contains only three items specifically referring to PA toward peers and adults, whereas the other six items targeted disruptive behaviors (unusually loud, disobedient), vandalism (destroy own things, destroy others' things), and aggression toward animals (hurts animals or people and cruel toward animals). Thus, these results probably apply to disruptive behavior rather than to PA per se. Second, because the study started at 3 years of age, it did not capture the increase in PA that is characteristic of infancy (Tremblay, Reference Tremblay2010).
The present study focused specifically on the development of PA toward peers and adults during early childhood. Three general patterns regarding the developmental roles of genetic and environmental factors in PA can be posited and tested. First, the most consensual and general point of view is that both sources of influence are ubiquitous and involved in the stability of PA (i.e. later referred to as the ‘ubiquitous ACE’ model). As posited in the twin design, environmental influences may be shared or non-shared by children of the same family (i.e. twins) as a result of various factors such as parental stress, divorce, coercive parenting, birth of a new sibling or relationships with peers (Snyder et al. Reference Snyder, Schrepferman, Oeser, Patterson, Stoolmiller, Johnson and Snyder2005; Granic & Patterson, Reference Granic and Patterson2006; Brendgen et al. Reference Brendgen, Boivin, Dionne, Barker, Vitaro, Girard, Tremblay and Perusse2011; Vitaro et al. Reference Vitaro, Brendgen, Boivin, Cantin, Dionne, Tremblay, Girard and Perusse2011; Burt & Klump, Reference Burt and Klump2013).
However, more restricted models are also possible when examining the stability of PA over time. The role of environmental factors could be more limited. According to a ‘genetic set point’ model, a single set of genetic factors could account for the level of PA across time. Many behavior genetic studies have indeed found that genetic factors substantially contribute to the stability of behavioral traits, including PA (van Beijsterveldt et al. Reference van Beijsterveldt, Bartels, Hudziak and Boomsma2003; Kuntsi et al. Reference Kuntsi, Rijsdijk, Ronald, Asherson and Plomin2005; Burt et al. Reference Burt, McGue, Carter and Iacono2007; Kandler et al. Reference Kandler, Bleidorn, Riemann, Spinath, Thiel and Angleitner2010; Petitclerc et al. Reference Petitclerc, Boivin, Dionne, Perusse and Tremblay2011). In these studies, environmental influences on stability are also detected, but these contributions are modest and tend to account for differences (i.e. E) rather than similarities (i.e. C) among twins. Generally, environmental factors have short-term effects, while genetic factors more strongly determine long-term stability of behavioral traits.
A third documented pattern postulates new sources of genetic and environmental influences with age. While the stability may be governed by early genetic factors, new genetic and environmental factors may start to play a role at various times. These ‘innovation effects’ could be restricted in time (i.e. observed at one time point only), or they could show some stability over time. When these innovation effects persist over time, they may signal additional enduring liabilities to PA. In line with the previous arguments regarding the role of genetic factors in the stability of PA, we posited that these persisting innovation effects would be essentially accounted for by new genetic factors. According to this ‘genetic maturation’ hypothesis, environmental contributions to PA are of short duration. Here, we first used the Cholesky decomposition model (McArdle & Hamagami, Reference McArdle and Hamagami2003) in order to test whether the same (i.e. transmission) or newly emerging (i.e. innovation) genetic and environmental factors explained the rank-order stability in PA at 20, 32 and 50 months. We then used a linear latent growth curve model to assess the contribution of genetic, shared and non-shared environmental factors to the initial level (intercept), the rate of change (slope) in PA, and their covariance, while controlling for age-specific factors and measurement error (Neale & McArdle, Reference Neale and McArdle2000). According to the first ubiquitous model of ACE etiology of PA, both genetic and environmental contributions would be found systematically on both the intercept and slope of PA. Under the genetic set point model, we would expect a strong genetic association between the intercept and the slope. On the other hand, the genetic maturity model would be supported if there was a weak association between the intercept and the slope, and if genetic factors were strongly related to the slope or to age-specific assessments, as this would imply genetic innovation.
Method
Participants were twins from the ongoing longitudinal Quebec Newborn Twin Study (Boivin et al. Reference Boivin, Brendgen, Dionne, Dubois, Perusse, Robaey, Tremblay and Vitaro2013a ). All parents of twins born between April 1995 and December 1998 in the Greater Montreal area (Canada) were invited to participate, using mail and phone contact information obtained from the Quebec Bureau of Statistics' computerized birth records. Of the 989 families of twins contacted, 672 (67.9%) accepted to participate. Zygosity was established for a total of 667 twin pairs [254 monozygotic (MZ) and 413 dizygotic (DZ) pairs, including 210 same-sex DZ pairs]. Information regarding children's PA was collected at three waves, when the twins were on average 19.6 (s.d. = 0.82, range 18–24), 31.9 (s.d. = 0.99, range 30–37) and 50.2 (s.d. = 1.90, range 47–55) months of age. Of the 667 families for whom we had zygosity information, 70 were lost through attrition and could not be included in the analyses. A total of 588 twin pairs had valid PA scores for at least one twin at one or more time points (1100 children at 20 months, 1039 at 32 months, and 880 at 50 months).
Measure
PA was assessed for each twin as part of a large questionnaire administered to mothers. The three items used to measure PA have been extensively used in many longitudinal studies with preschool children (Tremblay et al. Reference Tremblay, Nagin, Seguin, Zoccolillo, Zelazo, Boivin, Perusse and Japel2004; Côté et al. Reference Côté, Vaillancourt, LeBlanc, Nagin and Tremblay2006; Baillargeon et al. Reference Baillargeon, Zoccolillo, Keenan, Cote, Perusse, Wu, Boivin and Tremblay2007), as well as with older children (Nagin & Tremblay, Reference Nagin and Tremblay1999; Broidy et al. Reference Broidy, Nagin, Tremblay, Bates, Brame, Dodge, Fergusson, Horwood, Loeber, Laird, Lynam, Moffitt, Pettit and Vitaro2003). Mothers were asked how many times (0 = never; 1 = sometimes; 2 = often) the child: hits, bites, kicks; fights; and attacks another. Cronbach's α for mother ratings varied between 0.58 and 0.73. The Cronbach's α reliability estimate is modest at the first time point, but it gets better with age. This is somewhat expected for a scale that has only three ordinal items. However, since we had access to the nine-item version of the CBCL ‘aggression’ scale at each time point, we ran the statistical analyses again, and the results were robust and the stability coefficients were similar.
Statistical analysis
Phenotypic analyses
Pearson correlation coefficients were used to assess the degree of rank order stability of PA over time. Latent growth curve analyses were used to estimate the initial level and the rate of change in PA, as well as individual variations around these estimates. For the sake of interpretation, we subtracted 20 months at each wave and converted average ages, that were initially in months, into years. For this reason, slope factor loadings were fixed to 0 for the baseline assessment, and to 1 and 2.5 for the second and third assessment. Intercept paths were fixed to 1 for each assessment. Residuals were estimated at each wave, and they were allowed to covary between MZ and DZ twin pairs.
Biometric analyses
Biometric analyses are based on the assumptions that MZ twins share 100% of their genotype, whereas DZ twins share on average 50% of their genetic endowment. MZ and DZ twin intra-pair correlations can thus be compared to estimate the relative contributions of additive genetic effects (a2), shared environmental effects (c2) and non-shared environmental sources of variance in addition to measurement error (e2). Differences in MZ and DZ correlations provide a crude estimate of the general genetic contribution to a given phenotype.
Two complementary approaches were used. The first approach aimed to evaluate the etiology of stability through a Cholesky decomposition model of the phenotypic variance at each wave. This model tested to what extent genetic, shared environmental and non-shared environmental sources of variance were common or specific across ages. The second approach, a biometric latent growth curve model takes into account the patterns of means over time, and thus enables the description of the origins of intra-individual change over time. Separate latent growth components, each with a mean and variance, were specified at the phenotypic level: one representing the initial level in PA (i.e. intercept), and the other characterizing linear increases or decreases as a function of age (i.e. linear change). The variance of these two latent components was also modeled using a Cholesky decomposition, such that the additive genetic influences (A) on the intercept and the genetic influence (A) on the linear change were allowed to covary, as were the shared environmental (C) influences and the non-shared environmental influences (E), respectively (McArdle & Hamagami, Reference McArdle and Hamagami2003). In addition, age-specific residuals were further decomposed into additive genetic (A), shared environmental (C) and non-shared environmental (E) sources of variance.
The Mplus version 7.1 full-information maximum-likelihood estimation (FIML) for raw data was used (http://www.statmodel.com/). We also estimated the confidence intervals (CIs) of the A, C and E variance components through bootstrapping because some parameters were close to their boundaries and the sample was relatively small (Efron, Reference Efron1986, Thai et al. Reference Thai, Mentre, Holford, Veyrat-Follet and Comets2013). Nested models were compared using the χ 2 difference test and non-nested models were compared using Akaike's Information Criterion (AIC). Lower values reflect better model fit and parsimony. We also tested for sex differences in estimating genetic and environment parameters, but found no evidence for distinct genetic and environmental etiology in males and females.
Results
Phenotypic description
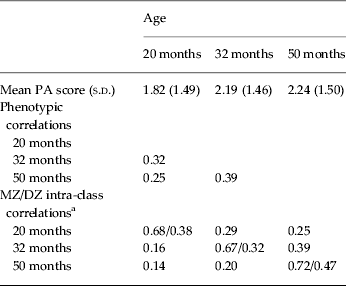
Table 1 presents the means, standard deviations and phenotypic correlations of the PA scores for each wave. These values (i.e. 1.82, 2.19, 2.24) suggest a small linear increase in PA between 20 and 50 months with variations around these means. The phenotypic stability coefficients for PA were moderate. Specifically, the correlation was r = 0.32 between the first and the second wave and r = 0.39 between the second and third wave. Intra-class correlation coefficients for the two zygosity groups showed that, at each wave, MZ intra-pair correlations (range 0.68–0.72) were greater than the DZ intra-pair correlations (range 0.32–0.47). Stability coefficients were also larger for MZ twins (range 0.25–0.39) than for DZ twins (range 0.14–0.20). This suggests some stability in the contribution of genetic factors to PA.
Descriptive data, and phenotypic and MZ/DZ intra-class correlations for PA as assessed by mothers at age 20, 32 and 50 months

MZ, Monozygotic twin pairs; DZ, dizygotic twin pairs; PA, physical aggression; s.d., standard deviation.
a MZ above the diagonal, DZ below the diagonal.
A linear latent growth curve model was used to evaluate the variations in the initial level and the rate of change over the three waves. In the saturated linear growth curve model, the initial level was significantly different from zero (I = 1.90, 95% CI 1.80–1.99), with significant variation around its mean (σ i 2 = 0.71, 95% CI 0.61–0.80). The rate of change was slightly positive (S = 0.17, 95% CI 0.12–0.23), with small but significant variation around its mean (σ s 2 = 0.10, 95% CI 0.06–0.15). The covariance between the initial level and the rate of change was not significant.
Biometric description
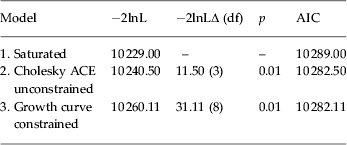
Fit statistics for the biometric Cholesky decomposition model and for the latent growth curve were compared with a baseline model in which variances, covariances and means were estimated. Then χ 2 goodness of fit and AIC were computed. All models fit the data very well. Goodness of fit statistics are presented in Table 2. The model with the lowest AIC has the better fit.
Test statistics for the Cholesky decomposition and latent growth curve models for physical aggression as assessed by mothers at age 20, 32 and 50 months

−2lnL, −2 Times the log likelihood; −2lnLΔ, differences in −2lnL values between the saturated model and each reduced model; df, degrees of freedom; AIC, Akaike's Information Criterion; A, additive genetic effects; C, shared environmental effects; E, non-shared environmental effects.
Cholesky decomposition model
The three-factor Cholesky decomposition model confirmed the results of the correlation analyses presented previously. The model also provided unstandardized estimates that were used to compute the relative contribution of A, C and E to age-specific variances and to stability coefficients. The saturated Cholesky model revealed significant genetic and non-shared environmental contributions, but only one marginally significant contribution of the shared environment at 50 months (c33 = 1.16, 95% CI 0.84–1.31). Genetic factors at 20 months (A1) were associated with PA at age 20 months (a11 = 1.16, 95% CI 0.84–1.31), 32 months (a12 = 0.50, 95% CI 0.24–0.77) and 50 months (a13 = 0.35, 95% CI 0.01–0.74). New genetic factors contributed to PA at age 32 months (a22 = 1.05, 95% CI 0.69–1.15), and explained stability at age 50 months (a13 = 0.49; 95% CI 0.08–0.91). New genetic factors also specifically accounted for PA at age 50 months (a33 = 0.88, 95% CI 0.22–1.09). Overall, stability of PA was mainly explained by early genetic factors (i.e. transmission effect) that tended to decline over time (i.e. attenuation effect), including some contribution of new genetic factors at each age (i.e. innovation effect). At each age, the contributions of genetic factors were significant and their effect sizes were of the same magnitude. Non-shared environmental variations (including measurement error) were strictly age-specific (e11 = 0.85, 95% CI 0.75–0.94; e22 = 0.84, 95% CI 0.75–0.94; e33 = 0.80, 95% CI 0.68–0.91). Standardized variance estimates are presented at the bottom of Fig. 1. At each wave, genetic factors explained at least half of the variance (60% at 20 months, 95% CI 34–74%; 63% at 32 months, 95% CI 37–71%; and 50% at 50 months, 95% CI 23–73%), with the remaining variance explained by non-shared environmental factors (31% at 20 months, 95% CI 24–41%; 33% at 32 months, 95% CI 26–43%; and 28% at 50 months, 95% CI 20–37%).
Unstandardized path diagram of a three-factor biometric Cholesky decomposition model for physical aggression (PA). The variance in PA at each wave is parsed into additive genetic effects (A1, A2 and A3) and shared environmental effects (C1, C2 and C3). The standardized non-shared environmental paths (e11, e21, etc.) are included at the bottom of the figure for ease of presentation. The proportion of variance in PA accounted for by genetic (A) and environmental (C and E) factors at each age are listed below the figure; statistically significant parameter and variance estimates are noted in bold text. A, Additive genetic effects; C, shared environmental effects; E, non-shared environmental effects; mth, months. + Parameters are significant at p < 0.10.

Latent growth curve model
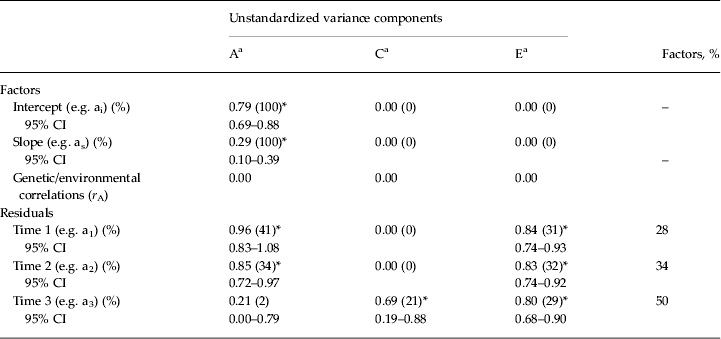
We used a similar Cholesky decomposition to assess the contribution of A, C and E components on the initial level (I), rate of change (S) and age-specific variations (Fig. 2). As shown in Table 3, individual differences in initial level (ai = 0.79, 95% CI 0.69–0.88), and rate of change (as = 0.29, 95% CI 0.11–0.39) were entirely explained by genetic factors, which is consistent with the Cholesky results. Age-specific variations were mostly explained by non-shared environmental factors (e11 = 0.84, 95% CI 0.74–0.93; e22 = 0.83, 95% CI 0.74–0.92; and e33 = 0.80, 95% CI 0.68–0.90), as well as by genetic factors at 20 months (a11 = 0.96, 95% CI 0.83–1.08), at 32 months (a22 = 0.85, 95% CI 0.72–0.97), and by common environmental factors at 50 months (c33 = 0.69, 95% CI 0.19–0.88). This is also coherent with the Cholesky results showing genetic innovation. PA appears volatile at these ages. The latent factors, that capture systematic stability and change, explained only 28, 34 and 50% of the variance of the three phenotypes.
Path diagram of the biometric latent growth curve model for physical aggression (PA). Variances in the intercept and linear slope factors are parsed into that which is due to additive genetic effects (A), shared environmental effects (C) and non-shared environmental effects (E). This path diagram represents only one twin in a pair, although the model is identical for the co-twin. The age-specific residual paths load directly onto PA at each assessment. Factor loadings for the intercept and slopes are fixed prior to analysis. mth, Months.

Biometric latent growth curve model results for PA a

PA, physical aggression; A, additive genetic effects; C, shared environmental effects; E, non-shared environmental effects; CI, confidence interval.
a A, C and E represent genetic, shared and non-shared environmental influences, respectively. The intercept factor is composed of the variance in PA that is common or stable across time. The slope factor captures systematic, linear change in PA over time. Unstandardized estimates are presented, followed by the proportion of variance accounted for (the latter in parentheses). Both factors were decomposed into their genetic and environmental components, and therefore each row sums to 100%. Genetic and environmental correlations between factors are also indicated, but they were fixed to 0.00 since they were not statistically significant. The residual estimates index the variance remaining in PA at each assessment after that contributed by the factors. For estimates greater than zero, 95% CIs are presented below the variance estimates.
* Statistically significant variance components (p < 0.05).
Discussion
The goal of the present study was to document the genetic and environmental underpinnings of PA development from infancy to school entry, using a combined approach of both variance-covariance analyses and latent growth curve modeling. At the phenotypic level, the analyses revealed a moderate general increase in PA between 20 and 50 months of age, as well as a moderate but increasing stability of individual differences in PA over this period. The gene–environment analyses revealed that early and new genetic factors were pervasive in accounting for developmental trends, explaining most of the inter-individual stability in PA, as well as both initial levels and growth of PA over this period. Non-shared environmental contributions were essentially age-specific, as were shared environmental contributions, but only at 50 months in this latter case. As discussed further in this section, these findings extend previous research by elucidating the gene–environment etiology of the onset and early development of PA during the preschool years (`Tremblay, Reference Tremblay2010).
The phenotypic findings of the present study are fairly consistent with previous research. The increase in the general frequency of PA from 20 to 50 months, that appeared to decelerate between 32 and 50 months, corroborates results from studies of singletons describing a similar increase in the mean frequency of aggression either through latent growth curve (Alink et al. Reference Alink, Mesman, van Zeijl, Stolk, Juffer, Koot, Bakermans-Kranenburg and van Ijzendoorn2006) or growth mixture modeling (Tremblay et al. Reference Tremblay, Nagin, Seguin, Zoccolillo, Zelazo, Boivin, Perusse and Japel2004; Côté et al. Reference Côté, Vaillancourt, LeBlanc, Nagin and Tremblay2006, Reference Côté, Boivin, Nagin, Japel, Xu, Zoccolillo, Junger and Tremblay2007). The moderate stability of individual differences in PA between the ages of 20 and 50 months is also in line with similar estimates from previous studies on disruptive behaviors during the same period (Cummings et al. Reference Cummings, Iannotti and Zahnwaxler1989; Shaw et al. Reference Shaw, Keenan and Vondra1994; Baillargeon et al. Reference Baillargeon, Zoccolillo, Keenan, Cote, Perusse, Wu, Boivin and Tremblay2007; Petitclerc et al. Reference Petitclerc, Boivin, Dionne, Perusse and Tremblay2011). As expected, the stability estimates of PA were lower than those found in studies of older children, adolescents and adults (Olweus, Reference Olweus1979; Stattin & Magnusson, Reference Stattin and Magnusson1989; Tremblay et al. Reference Tremblay, Loeber, Gagnon, Charlebois, Larivee and LeBlanc1991; van Beijsterveldt et al. Reference van Beijsterveldt, Bartels, Hudziak and Boomsma2003). Finally, also consistent with previous research, individual differences in initial PA (i.e. at 20 months) were substantial, and literally dwarfed the variation in the rate of change (Tremblay et al. Reference Tremblay, Nagin, Seguin, Zoccolillo, Zelazo, Boivin, Perusse and Japel2004).
These patterns of results suggest that individual differences in PA appear early in development, and tend to progressively consolidate during the preschool years, but never to a point of establishing highly crystallized trajectories (at least not before the age of 4 years). Previous studies have indeed shown that there is substantial heterogeneity in developmental trends from early childhood to late adolescence, with a minority of children showing stable high PA, while most others desist from the use of PA (Broidy et al. Reference Broidy, Nagin, Tremblay, Bates, Brame, Dodge, Fergusson, Horwood, Loeber, Laird, Lynam, Moffitt, Pettit and Vitaro2003; Côté et al. Reference Côté, Vaillancourt, LeBlanc, Nagin and Tremblay2006; Nagin & Tremblay, Reference Nagin and Tremblay1999). Rapid changes in physical, psychological and social maturation could account for the moderate stability. Environments can also change significantly and interact with early individual differences. For example, the birth of a new sibling, entry into child-care or other time-varying stressful life events could moderate the development of PA (Côté et al. Reference Côté, Boivin, Nagin, Japel, Xu, Zoccolillo, Junger and Tremblay2007).
Most importantly, the present study offers new and important information concerning the genetic and environmental underpinnings of these early developmental trends in PA. Genetic factors clearly appeared as a pervasive force in PA, both initially and across early development. The results of the gene–environment analyses provided some support for the ‘genetic set point’ hypotheses, but mostly for the ‘genetic maturation’ hypotheses. The ‘ubiquitous ACE’ model did not fit the data adequately. Genetic factors always explained a substantial part of individual differences in PA at 20 (60% of the variance), 30 (60%) and 50 (50%) months, and the latent growth curve analysis confirmed the predominant role of genetic factors in initial level and systematic change in PA. However, the Cholesky decomposition indicated that the genetic factors initially associated with PA (at 20 months) only modestly accounted for later PA (at 32 and 50 months). New sources of genetic variance appeared at 32 and 50 months, with some of these factors at 32 months extending into 50 months. In other words, a dynamic process of successive ‘genetic innovations’ seemed to be at play in the early development of PA.
In contrast to the pervasive role of genetic factors, environmental sources of variance were essentially age-specific. Non-shared environment was substantial at all waves, but did not account for any form of stability in PA, nor did it account for any systematic growth in PA. The predominant genetic variance in latent growth curve results suggests that an important proportion of the non-shared environment estimates found in the Cholesky model reflect measurement error. However, given the lack of further measure in preschool, it is not clear if those factors were still at play at later times. Finally, a small contribution of shared environment was also found at 50 months.
These patterns of findings offer some similarities with those previously reported for the construct of disregard for rules with the same sample of subjects (Petitclerc et al. Reference Petitclerc, Boivin, Dionne, Perusse and Tremblay2011). Genetic contributions were also pervasive and accounted for most of the stability in disregard for rules. However, they differed slightly in that shared environmental factors were significantly associated with age-specific variations in disregard for rules. This difference is consistent with recent reviews suggesting that the development of PA might be more genetically influenced than other forms of disruptive behaviors (Burt, Reference Burt2009; Tuvblad & Baker, Reference Tuvblad and Baker2011).
More generally, the limited role of shared environmental factors in PA clashes with the results of studies of singletons in which many family- or parent-level factors were found to predict developmental trajectories of PA during preschool (NICHD Early Child Care Research Network, 2004, Tremblay et al. Reference Tremblay, Nagin, Seguin, Zoccolillo, Zelazo, Boivin, Perusse and Japel2004; Côté et al. Reference Côté, Vaillancourt, LeBlanc, Nagin and Tremblay2006, Reference Côté, Boivin, Nagin, Japel, Xu, Zoccolillo, Junger and Tremblay2007). For example, children were found to be more likely to follow a high PA trajectory if their mother self-reported high levels of antisocial behavior and early childbearing (Tremblay et al. Reference Tremblay, Nagin, Seguin, Zoccolillo, Zelazo, Boivin, Perusse and Japel2004), as well as symptoms of depression, low family income and high family dysfunction (Côté et al. Reference Côté, Boivin, Nagin, Japel, Xu, Zoccolillo, Junger and Tremblay2007).
This apparent lack of congruencies could be due to a combination of various forms of gene–environment interplay. First, these family/parent factors could partly reflect genetic propensity; in other words, some of these conditions could be partly associated with genetic propensities in parents (e.g. self-regulation difficulties) that put them at risk for various adjustment problems, and which are then passed on to their offspring. Second, it may also be that children respond differently to the conditions associated with these family/parent factors; there could be an interaction between the conditions indexed by these family factors and the child genotype (i.e. genetic–environment interaction or G × E). Such a putative gene × shared environment interaction may generate an increased similarity in MZ versus DZ pairs, and consequently an inflated heritability component (in contrast to a gene × non-shared environment interaction, which would make all twins more unique, thus resulting in a higher E). Third, the environment may also have an overall impact on how genes are expressed, and bolster or constrain gene expression above a given threshold of environmental adversity (Ouellet-Morin et al. Reference Ouellet-Morin, Boivin, Dionne, Lupien, Arsenault, Barr, Pérusse and Tremblay2008, Reference Ouellet-Morin, Dionne, Perusse, Lupien, Arseneault, Barr, Tremblay and Boivin2009). Such potential G × E effects involving specific measured shared and non-shared environment factors, such as peer and parent–child relationships, should be explored in future studies on early PA. This approach has been successful in studies with older twins (van Lier et al. Reference van Lier, Boivin, Dionne, Vitaro, Brendgen, Koot, Tremblay and Perusse2007; Brendgen et al. Reference Brendgen, Boivin, Vitaro, Bukowski, Dionne, Tremblay and Perusse2008; Kendler et al. Reference Kendler, Jacobson, Myers and Eaves2008b ; Burt & Klump, Reference Burt and Klump2013).
The results of the present study are important to understand the developmental process of PA. They suggest that there is a pervasive early genetic propensity to PA, and that the source of this genetic propensity changes over time. However, it should be emphasized that these genetic associations do not imply that the early trajectories of PA are set and unchangeable. Long-term studies of PA developmental trajectories clearly show that most children, adolescents and adults eventually learn to use alternatives to PA (Tremblay, Reference Tremblay2010). However, because these early child propensities may evoke negative responses from parents and peers, and consequently create contexts where the use of PA is maintained and reinforced, early PA needs to be dealt with care (Granic & Patterson, Reference Granic and Patterson2006; Barker et al. Reference Barker, Boivin, Brendgen, Fontaine, Arseneault, Vitaro, Bissonnette and Tremblay2008; Tremblay, Reference Tremblay2010; Boivin et al. Reference Boivin, Brendgen, Vitaro, Forget-Dubois, Feng, Tremblay and Dionne2013c ).
Evocative gene–environment correlations with respect to PA have been documented for harsh and reactive parenting (Boivin et al. Reference Boivin, Perusse, Dionne, Saysset, Zoccolillo, Tarabulsy, Tremblay and Tremblay2005), and for victimization and rejection by peers (Boivin et al. Reference Boivin, Brendgen, Vitaro, Dionne, Girard, Perusse and Tremblay2013b , Reference Boivin, Brendgen, Vitaro, Forget-Dubois, Feng, Tremblay and Dionne c ). These cycles of aggression between children and their parents, as well as between children and their peers, could support the development of chronic PA. The same process could also apply to interactions among biological siblings that also share genotypes. These negative feedback processes should be further documented.
This study has a number of positive features. It is the first genetically informative study to focus on the early development of PA using a specific measure of this construct (versus aggregated externalizing behavior scales). It uses repeated measures during early childhood enabling us to assess developmentally stable and dynamic effects. It investigates etiological factors underlying stability and change with both a Cholesky decomposition and a latent growth curve approach, thus providing a more complete view of complex developmental processes.
The study also has a few limitations. First, only one informant, generally the mother, was interviewed to assess the frequency of PA in both twins. The shared informant may inflate the intra-familial similarity, which leads to an overestimation of the shared environmental effects over genetic effects. Future research should try to use multiple methods for the independent assessment of each twin's PA in multiple settings. Second, ACE modeling within twin studies relies on some important assumptions such as the equal environment assumption and the assumption that genetics and environment have additive contributions. Many studies have shown that the equal environment assumption is tenable for many behavioral traits (Kendler et al. Reference Kendler, Neale, Kessler, Heath and Eaves1993; Derks et al. Reference Derks, Dolan and Boomsma2006). However, failing to meet this assumption may result in inflated or deflated heritability estimates depending on the nature of the G × E interactions involved. Furthermore, it is important to remember that the estimates derived from these models do not necessarily reflect the causal pathways, but rather are an indication of the etiological forces at work. Third, given the sample size, the limited statistical power may have limited the detection of small effects. Lastly, twins may differ from singletons on PA. Having a co-twin can provide unique opportunities of socialization and aggression that might not be found in other families (Tremblay et al. Reference Tremblay, Nagin, Seguin, Zoccolillo, Zelazo, Boivin, Perusse and Japel2004).
These limitations notwithstanding, our results show that PA develops through a dynamic genome generating transmission, innovation and attenuation effects from infancy to preschool (Kendler et al. Reference Kendler, Gardner, Annas, Neale, Eaves and Lichtenstein2008a ). Genetic factors play an important role in the stability and change in PA among preschoolers. Future studies should assess genetic and environmental effects at different levels of the PA spectrum (e.g. pathological v. normative), where stability might be greater at the lower and upper end of the spectrum and the gene–environment etiology might differ. Different forms of disruptive behaviors may also follow different etiological patterns, as the present findings on PA and a previous report on disregard for rules suggest (Petitclerc et al. Reference Petitclerc, Boivin, Dionne, Perusse and Tremblay2011). Multivariate longitudinal analyses of hyperactivity, opposition and PA could provide valuable information on their respective etiology (Tremblay, Reference Tremblay2010). Finally, as in most studies, there were no sex differences regarding the gene–environment etiology of early disruptive behavior (Tuvblad & Baker, Reference Tuvblad and Baker2011). However, future research should investigate potential sex differences in the later developmental course of PA behavior.
Acknowledgements
This research was supported by grants from the National Health Research Development Program, the Social Sciences and Humanities Research Council of Canada, the Quebec Ministry of Health and Social Services, the Canadian Institutes of Health Research, the Canada Research Chair program, the Fonds Québécois de la Recherche sur la Société et la Culture, and the Fonds de la Recherche en Santé du Québec. We are grateful to the parents and twins of the participating families. Jocelyn Malo, MA, coordinated the data collection, and Hélène Paradis, MA, Bei Feng, MA, Bernadette Simoneau, MA, and Jacqueline Langlois, MA, provided assistance in data management and preparation.
Declaration of Interest
None.