Over the years, researchers have investigated the link between emotions and perception (see Zadra & Clore, Reference Zadra and Clore2011 for a review). In this context, the most studied topic has been probably the way that current moods influence processing styles. In general, it has been accepted that positive emotions encourage a global processing style or ‘focus on the forest’ whilst negative emotions facilitate a local processing style or ‘focus on the trees’ (i.e. Basso, Schefft, Ris, & Dember, Reference Basso, Schefft, Ris and Dember1996; Derryberry & Reed, Reference Derryberry and Reed1998; Easterbrook, Reference Easterbrook1959; Fredrickson & Branigan, Reference Fredrickson and Branigan2005; Gasper & Clore, Reference Gasper and Clore2002). Fredrickson (Reference Fredrickson1998, Reference Fredrickson2003) proposed the Broaden-and-Build Model to explain these links. According to this approach, positive emotions broaden the scope of attention, cognition and action to enlarge perception, thoughts and mental actions, whereas negative emotions, on the contrary, do “narrow” or reduce the attentional focus, thus improving the ability of perceiving more details of the scene or objects. However, although the idea that positive and negative mood respectively promotes a broadened or a narrowed attentional focus has been well established in the literature, recent studies have pointed out that the impact of moods on processing styles is not as fixed as thought. Instead, both positive and negative moods can promote either local or global processing depending on factors such as task requirements, stimulus characteristics or the style that is more suitable in a current context (i.e. Baumann & Kuhl, Reference Baumann and Kuhl2005; Huntsinger, Reference Huntsinger2012; Huntsinger, Clore, & Bar-Anan, Reference Huntsinger, Clore and Bar-Anan2010; Hunsinger, Isbell, & Clore, Reference Hunsinger, Isbell and Clore2012).
Apart from the fixed or flexible influence of mood on processing styles, whether adopting one style necessarily implies or not impairment in the processing related to the other style is something debatable. There is some evidence that global preference do not necessarily entail an impoverished local processing (Baumann & Kuhl, Reference Baumann and Kuhl2005; Gasper & Clore, Reference Gasper and Clore2002), however, the results have not been always conclusive mainly because of some methodological discrepancies in the tasks used to measure both processing styles, in which participants have either the chance of freely choosing between global or local processing, or they are directly asked to focus on one specific processing level when the other is simultaneously presented. For example, one of the tasks traditionally employed to measure the processing styles is the Navon test (1977), in which a large letter (global level) made up of smaller ones (local level) is presented to participants who have to focus on either the global or the local level while they are encouraged to ignore the other level. The most common finding is that participants in a positive mood show shorter reaction times in detecting letters appearing at the global level than at the local level, so they show a better performance when a global processing style is required.
In a similar vein, Kimchi and Palmer (Reference Kimchi and Palmer1982) developed a visual matching test where participants had to indicate which one of two sample figures looked more like a target figure, and each sample figure resembles the target from either a global or a local perspective. In this task, people in a positive mood are more prone to freely choose the figure that is more similar to the target in its global features (i.e. Fredrickson & Branigan, Reference Fredrickson and Branigan2005; Gasper & Clore, Reference Gasper and Clore2002). This task have provided very valuable information about global vs. local processing styles in general and in relation to emotions. However, with this approach it is not clear whether positive moods just benefit global processing and negative moods just benefit local processing, or moods bias the system in such a way that one processing style is enhanced at the same time that the other processing style is hindered. Therefore, in order to know whether positive and negative moods have independent effects on both global and local processing, different tasks measuring each processing style seem necessary.
The face recognition task has largely shown to be a suitable tool to obtain a global processing measure (Diamond & Carey, Reference Diamond and Carey1986; Farah, Wilson, Drain, & Tanaka, Reference Farah, Wilson, Drain and Tanaka1998; Gao, Flevaris, Robertson, & Bentin, 2010; Van Belle, De Graef, Verfaillie, Busigny, & Rossion, Reference Van Belle, de Graef, Verfaillie, Busigny and Rossion2010). It is still unclear, however, whether moods influence face recognition affecting only at the encoding stage or also involving later processes such as elaboration, retrieval, or even emotion identification of faces. Most studies have focused on how people in a positive or in a negative mood encode and recognize faces, but other studies have pointed out that positive moods can affect more broadly this process, for example in terms of reproduction of material related to faces. Thus, Gasper and Clore (Reference Gasper and Clore2002) used the method of serial reproduction to examine how mood modulates the global attentional focus. Participants in a sad or happy mood had to reproduce the previous person’s drawing of an African shield with the title “Portrait d’homme”. Results showed that individuals in happy moods reproductions were increasingly facelike, probably due to their attention was guided by the global concept suggested in the title; on the contrary, participants in a sad mood were more focused on perceptual details of the previous drawing. These findings suggest that the preference of positive mood for a global focus in faces processing, can have a more general effect than strictly modulating perception and encoding. On the other hand, the role of the valence information in the relationship between moods and global-local focus, is another point that is worth considering. The great majority of studies on this topic have used neutral information in the tasks, but it has been shown that participants in a positive mood look for longer and make more fixations at peripheral pictures with a positive and neutral valence than with negative valence, even when participants are simply asked to look at the stimuli (Wadlinger & Isaacowitz, Reference Wadlinger and Isaacowitz2006). Recently, Srinivasan and Hanif (Reference Srinivasan and Hanif2010) have shown that people in normal conditions (without any mood induction) are better able to identify happy faces when a global processing is primed, whereas a local processing facilitates identification of sad faces. So, it is relevant to further investigate whether the information valence by itself can influence the processing style, especially in different mood conditions.
Apart from this relationship with emotions, the global-local processing approach has been quite used in other contexts such as individual differences studies, eyewitnesses’ recognition, or at the clinical level. For example, participants with a global processing bias perform better eyewitnesses’ recognition tasks (Darling, Martin, Hellmann, & Memon, Reference Darling, Martin, Hellmann and Memon2009), and it has been shown that right hemisphere brain damaged patients have impaired their ability to process global configurations (Robertson & Lamb, Reference Robertson and Lamb1991) while disorders as schizotypal personality have been linked to a global processing advantage (Granholm, Cadenhead, Shafer, & Filoteo, Reference Granholm, Cadenhead, Shafer and Filoteo2002). On the contrary, individuals with autism, schizophrenia or obsessive-compulsive personality disorder have a local focus preference (Happé & Frith, Reference Happé and Frith2006; Landgraf et al., Reference Landgraf, Amado, Purkhart, Ries, Olié and van der Meer2011; Yovel, Revelle, & Mineka, Reference Yovel, Revelle and Mineka2005, respectively). Undoubtedly, the study of how emotions influence the processing styles and the role of the affective information on this relationship is also important to the extent that it can be generalized to all these contexts.
We carried out two experiments in order to check whether positive vs. negative mood state respectively favours a global vs. local attentional focus, but at the same time we wanted to take into account the three aspects mentioned above. First, as global measure we used a face recognition task, but our participants received the mood induction after the presentation of the materials (i.e., a video about a bank robbery). Participants watched the video without being told they would be asked later about it. Only after the video presentation, they received a positive, negative or neutral induction and were asked to recognize the bank robber among other faces. According to the literature, if face recognition require a holistic or global processing and positive emotions induce a bias toward this kind of processing, we should expect participant’s performance with positive induction to be superior to participants with negative affective state. Furthermore, if negative mood only affects local processing leaving global processing unaffected no effect should be observed in this task in the negative induction group, as compared to the control group.
Second, we used a spot-the-difference task as a local processing measure. Participants had to detect differences between neutral scenes in Experiment 1, and between positive, negative and neutral scenes in Experiment 2. If negative mood does induce an analytic processing style, in this task we expected participants in a negative mood to outperform those in a positive or neutral mood. In addition, with Experiment 2, we will know whether the information valence has a role by itself in the global-local focus preference, and if it can affects differently to the groups. It may be possible that negative stimulus accentuate the local processing style increasing the negative group advantage in this task, or even facilitating performance in the positive group in spite of this mood encourages a global preference. Furthermore, if positive mood only affects global processing leaving local processing unaffected no effect should be observed in this task in the positive induction group, as compared to the control group.
Third, in order to know how strong are the links between positive and negative moods respectively with global and local focus, and given the hypothesis that face recognition should be impaired by priming local processes (Macrae & Lewis, Reference Macrae and Lewis2002), in Experiment 2 we presented the recognition task before and after the local task. Furthermore, we timed how long it took to find differences by measuring the differences found in three consecutive time intervals.
Finally, note that we included a neutral mood induction group in both experiments, as a baseline, to ensure that results are due to the bias induced by the affective state. The lack of control groups (neutral mood) in most of the studies carried out in this context is an important aspect to take into account, as people in normal conditions show a global focus preference (see Kimchi, Reference Kimchi1992, for a review) and tend to have a positive mood (Diener & Diener, Reference Diener and Diener1996). Thus, including a neutral mood group instead of assuming an opposite effect on cognition by negative and positive states is very relevant to that kind of studies (Fredrickson & Branigan Reference Fredrickson and Branigan2005; Isen, Reference Isen1987, Reference Isen, Lewis and Haviland-Jones2000).
EXPERIMENT 1
Method
Participants
One hundred students (mean age = 19.7, 13 males) with normal or corrected-to-normal vision from three different classes of the Universidad de Granada took part on this study for course credits. Mood was manipulated between classes, so that students from one class (32) took part in the negative induction group, students from another class (25) in the positive induction group and those from a third class (43) in the neutral induction group. The mood induction type was randomly assigned to each class. Informed consent was obtained from all participants.
Materials and Measures
For the recognition task, a 40-second videotape segment used by Schooler and Engstler-Schooler (Reference Schooler and Engstler-Schooler1990) depicting a bank robbery was used, together with Schooler’s eight photos including the robber. The video was presented without audio, to prevent participants from trying to translate the robber’s commentaries into Spanish. For the recognition phase, numerated faces were shown together on the same slide for 1 minute.
The mood-induction procedure included three sets of 10 pictures selected from the International Affective Picture System (IAPS; Lang, Bradley, & Cuthbert, Reference Lang, Bradley and Cuthbert2005) on the basis of the Spanish normative population in valence and arousal [see Note 1] (Vila et al., Reference Vila, Sánchez, Ramírez, Fernández, Cobos, Rodríguez and Moltó2001). One set of pictures had a negative valence (i.e. people seriously ill or victims of natural disasters), another one had a positive valence (i.e. triumphant athletes or attractive landscapes), and the third one had a neutral valence (i.e. furniture or objects). Each picture was shown for 6 seconds always preceded by a brief text alluding to the content, which was also shown for 6 seconds prior to the image and remained on screen when the image appeared. In the negative induction, the texts emphasized the lack of control in those circumstances, sentences in the positive were optimistic, referring to the possibilities in life of achieving goals, and information about neutral pictures was related to characteristics and utility of these objects. The induction procedure for positive and negative mood has been successfully used in previous studies (e.g. Pacheco-Unguetti, Acosta, Callejas, & Lupiáñez, Reference Pacheco-Unguetti, Acosta, Callejas and Lupiáñez2010; Pacheco-Unguetti, Acosta, Lupiáñez, Román, & Derakshan, Reference Pacheco-Unguetti, Acosta, Lupiáñez, Román and Derakshan2012).
The mood manipulation check consisted of two questionnaires: the state-anxiety subscale of the State–Trait Anxiety Inventory (STAI; Spielberger et al., Reference Spielberger, Gorsuch, Lushene, Vagg and Jacobs1983) ranging from 20 to 80, and a Spanish scale for mood assessment (Escala de Evaluación del Estado de Ánimo, EVEA; Sanz, Reference Sanz2001), an instrument that offers information about emotional states of anxiety, sadness, anger and happiness in a Likert scale ranging from 0 to 10.
Four pictures were used for the ‘spot-the-difference’ task: two were a coloured picture representing a street with 16 differing elements between them (i.e. windows, flagstones); the other two pictures were a black and white vignettes of Little Red Riding Hood with 9 differing elements (i.e. flowers, parts of the wolf’s body).
Procedure
In the three classes, participants sat separately from each other and were asked to leave the provided material face downwards and to follow the experimenter instructions. At first, participants watched the video excerpt on a screen visible for everybody without any further information about the purpose of the video. The mood induction procedure followed after the video, in order to avoid participants watching the video or paying attention to different aspects depending on their mood state, and with the aim of knowing the effects of mood on the recognition rather than on the encoding process. Participants were shown the Power Point presentation with pleasant, unpleasant or neutral pictures (depending on the group) accompanied by commentaries that they had to read silently while trying to get emotionally involved with the pictures. Following the mood induction, participants completed the STAI-State and the EVEA in order to check the effect of the induction procedure.
After finishing, participants were shown a slide with eight numerated faces, among which they were asked to recognize the robber by checking the corresponding box in the notebook, or to note down the option “None of the faces belongs to the robber”, in case they thought it was the right answer. In addition, they had to indicate their confidence level (from 1-guessing to 9-certain) in their choice. Finally, they performed the ‘spot-the-difference’ task. They had four minutes to find differences in the rather difficult street picture and two for the easier Little Red Riding Hood vignette.
Results
Mood Manipulation check
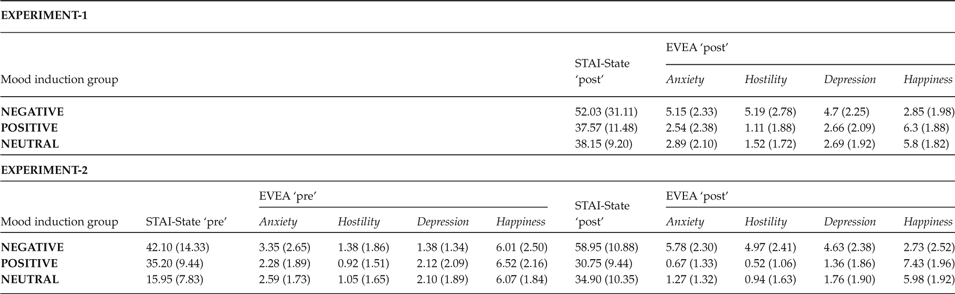
A comparison of the STAI-State scores yielded significant differences between
groups (see Table 1),
F(2, 99) = 18.77, p <
.0001,
 $\eta _p^2$
= .27. As we expected, after the mood induction
participants in the negative group showed higher levels in STAI-State than in
the positive group, F(1, 56) = 23.54,
p < .0001,
 $\eta _p^2$
= .29, and in the neutral induction group,
F(1, 74) = 31.36, p <
.0001,
 $\eta _p^2$
= .29, which did not differed between them
(F < 1).
Mean scores and standard deviation (in brackets) in the state-anxiety subscale of the STAI (range 20–80) EVEA subscales (range 0–10) before the mood induction in the Experiment-1 (‘post’), and before and after the mood induction in the Experiment-2 (‘pre’ and ‘post’) for the different groups

The same analysis was performed for each EVEA subscale scores, showing
differences between groups in all of them, Anxiety,
F(2, 99) = 12.58, p <
.0001,
 $\eta _p^2$
= .20, Hostility, F(2, 99)
= 34.59, p < .0001,
 $\eta _p^2$
= .41, Depression, F(2, 99)
= 10.59, p < .0001,
 $\eta _p^2$
= .17, and Happiness, F(2, 99)
= 31.44, p < .0001,
 $\eta _p^2$
= .38. The negative group had significantly higher
scores than the positive, F(1, 56) = 17.56,
p < .0001,
 $\eta _p^2$
= .24 and neutral group, F(1, 74)
= 19.53, p < .0001,
 $\eta _p^2$
= .20, in Anxiety. In the
Hostility subscale they also reported higher levels than
the positive and neutral groups, F(1, 56) = 40.46,
p < .0001,
 $\eta _p^2$
= .41, and F(1, 74) =
50.02, p < .0001,
 $\eta _p^2$
= .40, respectively. The same happened with
Depression, as participants in the negative group scored
higher than those of the positive and neutral groups respectively,
F(1, 56) = 12.73, p =
.0007,
 $\eta _p^2$
= .18 and F(1, 74) =
17.77, p < .0001,
 $\eta _p^2$
= .19. In none of these analyses the difference
between positive and neutral groups was significant (F
< 1). The pattern was different in the Happiness
subscale, the positive group reported higher levels compared to the negative
group, F(1, 56) = 45.07, p
< .0001,
 $\eta _p^2$
= .44, and also compared to the neutral group
although this difference was not significant (F <
1).
Recognition accuracy and confidence in judgments
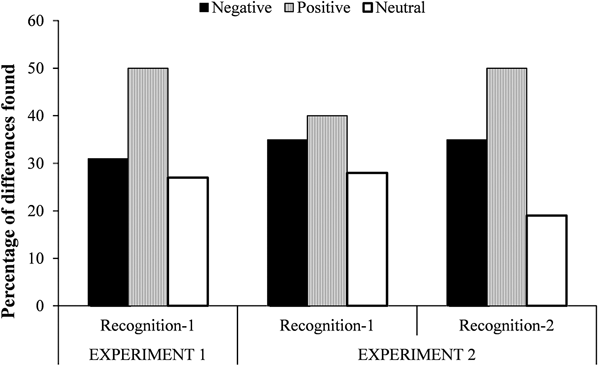
The target face was correctly identified by 50% of subjects in the positive group. In the negative and neutral groups, recognition level was lower and similar between them, being 31% and 27% respectively. Since there were nine possible responses (8 faces and the option “None belongs to the robber”), the expected recognition percentage by chance was 11.11%, much lower than the recognition shown by participants in the three groups.
Two Chi-Squared tests were carried out to compare the proportion of correct recognition between positive and negative groups with the neutral one. These analyses revealed that the proportion of correct recognition was statistically superior in the positive than in the neutral group, χ2(1) = .030, not being it different in the negative vs. neutral groups, χ2(1) = .353 (see Figure 1).
Percentage of correct face recognition for each induction group and experiment.

With regard to the confidence level in the elections, no differences were observed between the negative, positive and neutral groups, F < 1 (M = 5.0, 4.7 and 4.5 respectively).
‘ Spot-the-difference’ task
The differences in performance between groups were analyzed by a unifactorial
ANOVA for each picture. The analysis of performance with the Red Ridding
Hood scene showed significant differences between groups,
F(2, 99) = 6.03, p =
.0033,
 $\eta _p^2$
= .10. Participants in the negative group found
significantly more differences than the positive F(1, 56)
= 8.05, p = .0063,
 $\eta _p^2$
= .12, and the neutral group, F(1,
74) = 10.91, p = .0014,
 $\eta _p^2$
= .12 (M = 7.62 vs.
6.61 vs. 6.54), which did not differ from each other (F
< 1). However, the Street scene turned out to be very
difficult for all groups in spite of having more time and a total of 16
differences to search, and there were no significant differences between groups
(F < 1). The negative group found a mean of 4.75
differences, 4.80 was the mean for the neutral group, and 4.42 for the positive
group.
To summarize, these findings are in line with our hypothesis that a positive mood would improve the recognition task given its link with the global processing style, whereas a negative mood would encourage the local processing style required for the spot-the-difference task, although this improvement was shown only for the Red Ridding Hood scene. It seems the Street scene turned out to be too difficult for all groups leading to a floor effect. In general, we noticed that participants stopped searching shortly, probably because they considered unlikely to find all the differences even knowing the total number of each scene. Therefore, in the following experiments we tried to also take into account time in the performance measures of this task.
EXPERIMENT 2
As we mentioned in the overview, we carried out a second experiment with the aim of replicating the effects found in Experiment 1. At the same time, we introduced some improvements and manipulated the valence of the material used in the spot-the-difference task. Participants’ mood was checked before and after the induction. Given that anxiety, mainly trait-anxiety, has been related to a reduction of the attentional focus (i.e. Derryberry & Reed, Reference Derryberry and Reed1998), participants also filled out the Trait subscale of the STAI to control for this factor. The pictures used for the ‘spot-the-difference’ task had different valence (positive, negative and neutral), and were selected from a previous pilot study to avoid ceiling and floor effects. Additionally, we timed how long it took to find differences by measuring the differences found in three consecutive time intervals. Note that if the effect observed in the Experiment 1 was due to participants in the negative induction group being more persistent in performing the local task than the other two groups, in the new experiment all the groups should show similar results in the first period of time. On the contrary, if the effect was due to a change in the processing style induced by the emotional state, we should replicate the group differences from the first period of time and the negative group should show better performance in all the time intervals.
Method
Participants
Sixty-one Psychology students (mean age = 21.45, 9 males) from the Universidad de Granada participated in this study for course credits. Mood was manipulated between groups, so there were 20 participants in the negative induction group, 20 in the positive group and 21 in the neutral induction group. The experiment was run in small groups for which groups of 10–11 participants were randomly selected. Then, the mood induction type was randomly assigned to each of these small groups of participants. Informed consent was obtained from all of them.
Materials
The recognition task materials, mood induction procedure and the questionnaires to check its effectiveness were the same as in Experiment 1. Additionally, we added the trait-anxiety subscale of the STAI (Spielberger et al., Reference Spielberger, Gorsuch, Lushene, Vagg and Jacobs1983). The positive, negative and neutral pictures for the ‘spot-the-difference’ task were selected from the IAPS (see Table 2 for picture numbers, valence and arousal details), and edited with Adobe Photoshop CS.8.0.1 to include 10 differences between the two copies. A preliminary study with 9 pictures from each valence was carried out to select one picture per valence with intermediate levels of difficulty, in order to avoid ceiling and floor effects.
Original and our participants’ evaluation mean values and standard deviation (in brackets) in valence and arousal of each picture used in the spot-the-difference task in Experiment 2

Procedure
Participants arrived to the laboratory in groups of 10–11 people. First, the same video as in experiment 1 was projected on the wall visible for everybody. After the video, participants filled out the trait and state subscales of the STAI and the EVEA questionnaires, and they received the negative, positive or neutral mood induction depending on the group. Afterwards, participants filled out the questionnaires again to test mood changes. After finishing, they did the recognition task-1 with numerated faces as in Experiment 1 or with a different order, also indicating the confidence level in their election. After finishing, they performed the spot-the-difference task, starting all groups for the neutral picture and following with either the positive or negative picture in random order. Participants had 2 minutes to find differences per picture, and they were asked to mark them using three different colour pens, one for the first minute, a different one for the following 30 seconds and another one for the remaining 30 seconds. After finishing, participants had to evaluate each picture according to valence, arousal and subjective difficulty in finding the differences. Finally, they carried out again the recognition task-2, in which faces had different a number than in recognition-1.
Results
Mood Manipulation Check
A different unifactorial ANOVA with the variable group was performed for each
STAI-State and EVEA’s subscales scores with the measures taken before
and after the mood induction as dependent variable (see Table 1). Negative, positive and neutral groups showed
similar levels of STAI-State before mood induction, F(2, 58)
= 2.44, p = .0953,
 $\eta _p^2$
= .07, but they differed in post-induction levels,
F(2, 58) = 44.35, p <
.0001,
 $\eta _p^2$
= .60. The negative group showed significantly
higher levels than the positive, F(1, 38) = 76.56,
p < .0001,
 $\eta _p^2$
= .66, and the neutral group, F(1,
39) = 52.55, p < .0001,
 $\eta _p^2$
= .57. The difference between positive and neutral
group was not significant, F(1, 39) = 1.79,
p = .1879,
 $\eta _p^2$
= .04.
Regarding the EVEA pre-induction scores, groups did not show differences in
Anxiety F(2, 58) = 1.32, p
= .2742,
 $\eta _p^2$
= .04, Depression, F(2, 58)
= 1.08, p = .3437,
 $\eta _p^2$
= .03, Hostility or
Happiness (both Fs < 1), but they
differed in post-induction scores in all the subscales,
Anxiety, F(2, 58) = 53.65,
p < .0001,
 $\eta _p^2$
= .64, Depression, F(2, 58)
= 15.09, p < .0001,
 $\eta _p^2$
= .34, Hostility, F(2, 58)
= 37.86, p < .0001,
 $\eta _p^2$
= .56, and Happiness, F(2, 58)
= 25.05, p < .0001,
 $\eta _p^2$
= .46. Participants in the negative group showed
higher levels in Anxiety than those in the positive,
F(1, 38) = 73.61, p <
.0001,
 $\eta _p^2$
= .65, and neutral group, F(1, 39)
= 59.94, p < .0001,
 $\eta _p^2$
= .60, which did not differ from each other,
F(1, 39) = 2.07, p =
.1572,
 $\eta _p^2$
= .05. The same pattern was found for
Depression, the negative group had higher levels than the
positive, F(1, 38) = 23.44, p
< .0001,
 $\eta _p^2$
= .38, and the neutral group, F(1,
39) = 18.27, p = .0001,
 $\eta _p^2$
= .31, without significant differences between
these two (F < 1). In the Hostility
subscale, the negative group also reported higher levels than the positive,
F(1, 38) = 56.80, p <
.0001,
 $\eta _p^2$
= .59, and the neutral group, F(1,
39) = 39.50, p < .0001,
 $\eta _p^2$
= .50. Again, the difference between positive and
neutral groups was not significant (F < 1). The
happiness subscale showed the opposite pattern, the
positive group scored significantly higher than the negative,
F(1, 38) = 43.14, p <
.0001,
 $\eta _p^2$
= .53, and the neutral group, F(1,
39) = 5.69, p = .0219,
 $\eta _p^2$
= .12, which showed higher levels than the negative
group, F(1, 39) = 21.60, p
< .0001,
 $\eta _p^2$
= .35. The analysis with the trait-anxiety scores
did not yield significant differences between groups, F(2, 58)
= 1.78, p = .1765,
 $\eta _p^2$
= .05.
Recognition accuracy and confidence in judgments
In the recognition-1, 40% of participants in the positive group picked correctly the target face, 35% in the negative group and 28% in the neutral group. Although there was a trend towards a better recognition in the positive group as in experiment-1, this group did not differ significantly from the negative, X2(1) = .2110, and the neutral group, χ2(1) = .3160. The recognition percentage was also similar between the positive and the negative groups, χ2(1) = .3729 (see Figure 1). However in the recognition-2, even it was carried out after the local task, the difference between groups was significant, and participants in the positive group picked more often the correct face than participants in the neutral group, χ2(1) = .0215 (50 vs. 19%), which did not differ from the negative one (35%), χ2(1) = .127.
The ANCOVA on the participants confidence levels in the recognition-1, with the
group as a between-group factor and trait-anxiety as a covariate did not show a
significant effect of group, F(2, 57) = 1.90,
p = .1588,
 $\eta _p^2$
= .06 (M = 5.2, 3.5 and
4.2 for negative, positive and neutral group respectively), although as in
experiment 1, participants in the negative group had greater confidence levels
than those in the positive group, F(1, 37) = 4.86,
p = .0337,
 $\eta _p^2$
= .11. The differences between negative and neutral
groups, and between positive and neutral groups were not significant (both
Fs < 1).
The same analysis was carried out with the scores in the recognition-2, showing a
significant effect of group, F(2, 57) = 3.35,
p = .0418,
 $\eta _p^2$
= .10. Participants in the negative group had
greater confidence levels than those in the positive group,
F(1, 37) = 9.18, p =
.0044,
 $\eta _p^2$
= .19. Although the differences between negative
and neutral groups (F < 1), and between positive and
neutral groups, F(1, 38) = 1.63, p
= .2087,
 $\eta _p^2$
= .04, were not significant, the response patterns
were the opposite; the negative group was more convinced in its elections than
the neutral group, and this last was also more than the positive group
(M = 5.0, 4.3 and 3.4 respectively).
‘Spot-the-difference’ task
First, we analyzed the emotionality ratings of the pictures that were used. The affective judgments remained stable according to the normative values (see Table 2). Correlations in valence and arousal ratings across figures were equivalent to the originals in the negative group (r = 1.00), and highly similar in the positive and neutral groups (.98 in both).
One ANCOVA was performed on the overall differences found in each picture
(neutral, positive and negative), with the group as a between-group factor and
trait-anxiety as a covariate. This analysis showed significant effects of group,
F(2, 57) = 16.77, p <
.0001,
 $\eta _p^2$
= .37, and valence of pictures,
F(2, 114) = 6.65, p =
.0018,
 $\eta _p^2$
= .10. Participants in the negative group found
more differences (M = 8.24) than participants in the
positive (M = 6.85), F(1, 37)
= 20.87, p < .0001,
 $\eta _p^2$
= .36 and in the neutral group (M
= 6.75), F(1, 38) = 22.94,
p < .0001,
 $\eta _p^2$
= .37, which did not differ from each other
(F < 1). The same difference was observed for the
three valences of pictures. More differences were reported in general for the
positive (M = 7.76) than for the neutral
(M = 7.19), F(1, 57) =
3.22, p = .0776,
 $\eta _p^2$
= .05, and negative (M
= 6.89) images, F(1, 57) = 13.68,
p < .0001,
 $\eta _p^2$
= .19, which did not differ significantly from each
other.
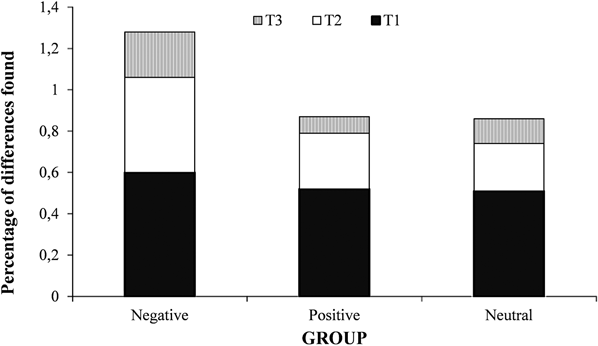
In order to investigate the temporal pattern of participants in this task, we
computed the next three indices: T1 (% of total number of differences found
during the first minute), T2 (% of the unfound differences, found during the
next 30 seconds), and T3 (% of unfound differences, found during the last 30
seconds). Given that the three images showed the group effect, these indices
were computed collapsing across images and considering the total number of
differences that was 30. We carried out an ANCOVA with each index, with the
group as a between-group factor and trait-anxiety as a covariate (see Figure 2). The ANCOVA performed on the T1
Index revealed a significant effect of group, F(2, 57)
= 6.36, p = .0032,
 $\eta _p^2$
= .18. Bonferroni post hoc comparisons showed that
the negative group found significantly more differences than the positive
(p = .010), and the neutral group
(p = .007), with no significant differences between
these two groups (F < 1). The analysis performed on
the T2 Index also revealed a significant effect of group, F(2,
57) = 15.47, p < .0001,
 $\eta _p^2$
= .35, Again, the negative group found
significantly more differences than the positive and the neutral group
(p = .0001 and p =
.00001 in the Bonferroni post hoc analysis, respectively, again with no
significant differences between these two groups (F <
1). The ANCOVA on the data from the last temporal moment (T3) also showed a
significant effect of group, F(2, 57) = 3.83,
p = .0274,
 $\eta _p^2$
= .11. The negative group found significantly more
differences than the positive group on the Bonferroni test (p
= .025), but the difference with respect to the neutral group was non
significant (p = .15). Again, the positive and the
neutral group did not differ from each other in this index (F
< 1).
Indices with the percentage of differences found within the three temporal intervals for each induction group in the Experiment-2. T1 = % of differences found in the first minute of the total of differences (30). T2 = % of differences found in the second time interval (30 seconds) of the remaining differences (30-differences found in the first period of time). T3 = % of differences found in the last time interval (30 seconds) of the remaining differences (30 - differences found in the two previous time intervals).

In this second experiment, we confirmed again our initial hypothesis that positive moods enhance a global processing style, even after performing a local task. Actually, it was in the recognition-2 when our participants showed significant differences between groups; in the recognition-1 we found only a trend toward a better recognition in the positive group as in the Experiment 1. Given that the only difference with respect to the first experiment is the time elapsed since participants watched the videotape until they carried out the recognition task, which was longer in the first experiment, a possible explanation for this is that, the positive mood effects on the global processing demands for the recognition task are related to processes that require a time to consolidate the information in a distinctive way. In both experiments, the positive mood induction was carried out after presenting the video about which they would be asked for later on. Therefore, the fact that participants who were induced a positive mood recognized better the robber implies that mood can also influence processes such as memory consolidation and reactivation, not only encoding. Importantly then, the global processing style influenced by the positive mood may act as a mediator on early processes as encoding, but also on later and more elaborated processes of information processing.
Concerning the spot-the-difference task, the negative group showed again better performance compared to the positive and neutral group regardless of emotional valence of the stimuli. Thus, the local processing style was favoured by the negative mood induction and not by the information valence. Importantly, this advantage to find differences by the negative group was observed from beginning to end, thus eliminating any possible explanation in terms of greater persistency in this group. It seems like the negative mood directly had an online influence on the current information encoding process, contrary to the positive mood, which had its influence on later processes.
General discussion
Taken together, the findings of our two experiments demonstrate a double dissociation between moods and global-local processing styles. Specifically, experiencing a positive mood appeared to favour a global processing style, which was measured with a face recognition task, but negative mood had no effect on this task; whereas experiencing a negative mood seemed to enhance a processing style more focused on local characteristics, as shown in the spot-the-difference task, while positive mood had no effect on this task. These findings support the broaden-and-build theory (Fredrickson, Reference Fredrickson1998, Reference Fredrickson2003) that positive emotions broaden the scope of attention and facilitate holistic attentional processes required in tasks such as face recognition, whereas negative emotions narrow the attentional focus (Basso et al., Reference Basso, Schefft, Ris and Dember1996; Derryberry & Tucker, Reference Derryberry, Tucker, Niedenthal and Kitayama1994; Macrae & Lewis, Reference Macrae and Lewis2002). It is important to point out that in our two experiments, the facilitation of a local processing in negative moods did not necessarily entail a reduced ability to process globally and vice versa, so positive and negative emotions have not opposite effects. The negative group performed better in the spot-the-difference task, but positive and neutral groups performed similarly. In the same way, the positive group had a better recognition performance than the negative and neutral groups, but they showed similar performance. It is important to note that this pattern of results, in which global and local attentional focus seems to be independently modulated by mood, goes against the recent proposal by Huntsinger (Reference Huntsinger2012) that mood, instead of generating a broadened vs. narrowed attentional focus, either reinforces the current (by default) global focus (positive mood) or lead participants to adopt the opposite local focus (negative mood).
As we hypothesized, the facilitation of a global processing style by positive mood seems to be not only restricted to early processes such as encoding, but also affect later processes. Contrary to most previous studies, our participants received the mood induction after encoding the information presented in the videotape, so the differences between groups ought to be due to the different cognitive strategies induced by mood to process differently the same information in order to recognize a target face. This fact suggests that the positive mood effects are not restricted to the current moment in which the information is being processed, but they can be retrospective. Thus, it is important to consider that positive mood have an influence on both, early processes such as encoding and perception, and late processes such as face discrimination and recognition, in order to use effectively this positive mood facilitation.
The improvement showed by the negative group in the local task was also expected, as people in a negative mood are more likely to focus on local elements (Derryberry & Reed, Reference Derryberry and Reed1998; Derryberry & Tucker, Reference Derryberry, Tucker, Niedenthal and Kitayama1994; Easterbrook, Reference Easterbrook1959; Gasper & Clore, Reference Gasper and Clore2002; Johnson & Fredrickson, Reference Johnson and Fredrickson2005). This result was clearly put forward in the spot-the-difference task, but it was also found in correlations analysis carried out between the STAI and EVEA questionnaires and the number of differences found by participants. In the Experiment–2 (where pre and post measures were taken regarding anxiety state), the total number of spotted differences showed a positive correlation with the post-values of the STAI-State (r = .35) and the anxiety (r = .45), hostility (r = .43) and depression (r = .29) subscales of the EVEA, and a negative correlation with the happiness subscale (r = –.35). However, as it could be expected, the correlation with the STAI-State pre-induction scores was non-significant (r = .10), as the correlations with the EVEA subscales (anxiety and hostility, r = .08, depression and happiness, r = –.07).
This preference for a local processing style in negative moods can be also explained from a different perspective. In a previous study using the same negative -anxiety- induction (Pacheco-Unguetti et al., Reference Pacheco-Unguetti, Acosta, Callejas and Lupiáñez2010), we measured the functioning of the alerting, orienting and cognitive control attentional networks. Participants in an anxiety mood, in contrast to those in a positive mood or with high trait-anxiety level, showed an over-functioning of the alerting and orienting networks. These networks are involved in establishing a vigilant state and maintaining a readiness state to react selectively to specific information among numerous sensory inputs. It is reasonable to think that the superiority exhibited in the differences search task by our negative group could be related with these attentional mechanisms, making easy to find the specific elements from the whole image that differ between images.
These findings are also relevant for the field of applied eyewitness-testimony research. It has been shown that manipulating global or local perceptual processing orientation influences eyewitness identification (i.e. Darling et al., Reference Darling, Martin, Hellmann and Memon2009; Macrae & Lewis, Reference Macrae and Lewis2002). Dodson, Johnson, and Schooler (Reference Dodson, Johnson and Schooler1997) pointed out that asking eyewitnesses of crimes to describe what they saw in the crime’s scene, or some of the perpetrator’s features can spoil their posterior recognition judgment. Also, Lewis (Reference Lewis2006) showed that doing a cryptic crossword have a detrimental effect on subsequent face recognition. According to our results, the affective state during the recognition session could be another important aspect to take into account in that context. People experiencing positive emotions improve the witness’s performance in an identity parade by using a broad attention rather than processing of local units. It is possible that asking participants to remember positive life events or doing some entertainment activities that require global processing before the recognition judgment, may lead to an improvement in a subsequent face processing. This is specially important as we take into account that, if nothing is done in this direction, by remembering their experience (which might be traumatic) eyewitnesses will inevitably succumb into an anxiety state that will make them less able to identify the perpetrator.
Finally, we want to mention another possible implication for our results. In an educational context, our results suggest that it is possible to improve the learning process using the mood states conveniently. For example, positive moods briefly induced by means of unexpected rewards, jokes or recreational activities into the teaching process, can be used to facilitate students paying attention to the global structure of the contents and working the materials from a holistic perspective. On the contrary, negative moods induced for example using time restrictions or highly demanding tasks, can improve the participants’ performance in tasks where a local processing style is required, such as mathematical problem solving or sentence structure rules.
In short, emotions constantly influence our thoughts and actions in daily life, since they are closely related to cognition and affect the way we attend to and perceive the world around us, and influence the way we process, and react to, the information we gather from a scene facilitating a particular processing style. People in a positive mood, more than those in a negative one, pay attention in a global way, being able to process more information and performing better tasks that require a wide scope of attention, such as face recognition in our experiment. Negative mood improve the skill of perceiving details of the available information to a greater extent than positive mood, something important from a survival point of view. Given that we are constantly recognising people faces and it is quite frequent that we pass time doing crossword puzzles or spot-the-difference tasks as a hobby, the fact that we had used day-to-day tasks to have a measure of the processing styles allow our results to be easily generalized to different applied fields.
This study was supported by a postdoctoral fellowship from the Universidad de las Islas Baleares (to A. P. Pacheco-Unguetti), and research grants funded by the Spanish Ministerio de Ciencia y Tecnología and the Junta de Andalucía (P07-SEJ-03299 to A. Acosta, CONSOLIDER-INGENIO2010 CSD2008–00048, PSI2011–22416 and PSI2008–03595PSIC to J. Lupiáñez).