I. INTRODUCTION
Friction welding is a solid state joining process which is the most economical and also a feasible method in joining similar and dissimilar metals. Reference Huang, Li, Preuss, Karadge, Bowen, Bray and Baxter1 It is used extensively due to its advantages such as low heat input, production efficiency, ease in manufacture, and environment cleanliness. Incoloy alloy 800H is an austenitic iron–nickel-based super alloy that has good strength and corrosion properties at high temperatures. Reference Gleeson and Li2 The Incoloy 800H has resistance to high temperature corrosion and it is used for many applications involving long-term exposure to elevated temperatures in corrosive atmospheres. Other applications of Incoloy 800H are in super heater tubes in power generation units, and in high temperature heat exchanger tubes in gas-cooled nuclear reactors. Reference Rahmel, Grabke and Steinkusch3 The Incoloy 800H derives its strength mainly from gamma prime (γ), an intermetallic compound that enhances the strength found in other kinds of iron–nickel-base alloys with the chemical formula Ni3 (Al, Ti). Precipitation of γ′ contributes to high temperature strength and creep resistance of the material, with the strength increasing as γ′ volume fraction increases. The volume fraction of γ′ in iron–nickel-base alloys is usually less than 25%. Reference Langevoort, Hanekamp and Gellings4,Reference Davis5 The composition of Incoloy 800H is very similar to that of alloy 800 with the difference that the carbon content of Incoloy 800H is more restrictive (0.05–0.10%) than the alloy 800 (0–0.10%). Incoloy 800H can also be heat treated to have a coarse grain size (average size of ASTM 5) suitable for high temperature applications. The higher carbon content and coarser grain size provide greater high-temperature strength to 800H. The excellent oxidation resistance of Incoloy 800H is attributed to high nickel and chromium content with the high nickel content ensuring good adherence of the protective chromia scale. Titanium is added to Incoloy 800H to act as a carbide- and nitride-former thereby encouraging the precipitation of titanium nitrides and titanium carbides. The formation of titanium carbide takes carbon out of the solution that could otherwise react with chromium to form chromium carbides in a process known as sensitization. Reference Davis6
At temperatures between 700 and 800 °C, both M23C6 and TiC are commonly present. Although TiC is more thermodynamically stable at these temperatures, the kinetics frequently favored the formation of M23C6. Reference Czyrska-Filemonowicz and Ennis7 One study showed that aging at 850 °C for 500 h resulted in the grain boundary precipitation of M23C6, which in turn reduced the notched impact strength of the alloy at temperatures between 20 and 800 °C. The same study showed that with an increasing degree of carburization, the impact strength of the alloy was progressively reduced. Other minor phases which were detected in small amounts in alloy 800 were sigma (σ) phase and G phase.
The resistance of Incoloy 800H to the formation of sigma (σ) phase is superior to that of alloy 310. After aging at 760 °C for 1000 h, alloy 310 showed a drastic reduction in toughness due to the formation of sigma phase, while Incoloy 800H remained almost unaffected. Reference Davis5
The weldability of nickel based super alloys by friction welding was established. Further the optimization of friction welding process parameters was carried using the temperature contours obtained from various parameters. Reference Wang, Li, Li and Vairis8 In general by the use of friction welding process, fusion process kind of defects can be avoided. Reference Luo, Li, Dong and Xu9 The presence of brittle intermetallic phases and also martensite reduced the toughness of dissimilar metal combinations on Inconel 718 nickel based superalloy and EN24 a Ni–Cr–Mo steel of friction weldments to a greater extent. Reference Lalama, Madhusudhan Reddy, Mohandasa, Kamaraj and Murty10 Sathiya et al. investigated the effect of different activated flux on A-TIG welding process of Incoloy 800H and concluded that SiO2 flux gave better depth of penetration but had led to sensitization issue in the grain boundaries. Reference Arun Kumar and Sathiya11 Anand et al. optimized the process parameters for friction welding of Incoloy 800H rod and concluded that artificial neural network was more specific than the response surface methodology model. The output taken for the optimisation was the tensile strength and burn-off length. Reference Anand, Shrivastava, Tamilmannan and Sathiya12 Sathiya et al. optimized the process parameters for friction welding of Incoloy 800H using a hybrid technique of ANN and different optimization algorithm. A robust comparison of the performances of five different algorithms employing standard statistical indices was made. Reference Anand, Kumar Barik, Tamilmannan and Sathiya13 Arun kumar et al. optimized the process parameters for laser welding of Incoloy 800HT and concluded that the welding speed was the most influential factor followed by focal position. Reference Arun Kumar, Shrivastava and Sathiya14
From these observations made out of the above literature, it is clear that only a very few research studies have been focused on the friction welding and other welding processes of Incoloy 800H nickel base super alloys.
In particular, a very few literature is available on friction welding of Incoloy 800H. Therefore the present work focuses on experimental study of friction welding of Incoloy 800H nickel base super alloys. Also in this study, Incoloy 800H material with the same composition was welded with different process parameters using the same procedure. The mechanical properties of the joints were determined by tensile test and impact test, and the results were compared with individual parameter effects. The tensile and impact fracture surface were analyzed through scanning electron microscope (SEM) and the hardness traverse was carried out by transverse cross-section of weldments. The microstructure and phase analysis in the welding zones were obtained. X-ray diffraction was adopted for phase identification in the weld zone. An experimental procedure was realized in laboratory conditions on friction welding of Incoloy 800H material. The potential applications of the friction welded Incoloy 800H joints are: in the hydrocarbon processing industry, these alloys are used in steam/hydrocarbon reforming for catalyst tubing, convection tubing, pigtails, outlet manifolds, and quenching-system piping; in ethylene production for both convection and cracking tubes, and pigtails; in oxy-alcohol production for tubing in hydrogenation heaters; in hydro de-alkylation units for heater tubing; and in the production of vinyl chloride monomer for cracking tubes, return bends and inlet and outlet flanges. Alloys 800H and 800HT are also used in power generation for steam superheating tubing and high-temperature heat exchangers in gas-cooled nuclear reactors. 15
II. EXPERIMENTAL WORK
A. Base material
Incoloy 800H, in the form of bars of diameter 12 mm and length 100 mm, was used in the friction welding trails. The tensile strength of the base metal at room temperature was 573 MPa. The chemical composition of the as-received material is shown in Table I.
Base material chemical composition (wt%).

B. Friction welding
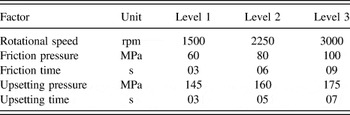
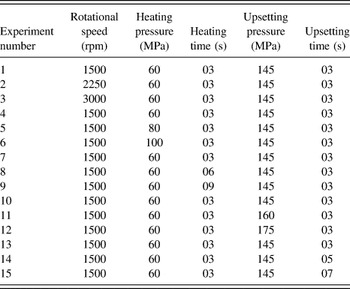
The friction welding machine used in this study is a continuous drive friction welding machine with a maximum thrust of four tons. The friction welding parameters are the rotational speed (S), the friction pressure (FP), friction time (FT), upset pressure (UP), and the upset time (UT). These friction welding parameters were selected to identify the effect of individual welding parameters. Several preliminary experiment trials were carried out to find the lower and upper levels of the process parameter. The main experiment was conducted by varying the levels of one parameter and keeping the levels of other parameters as constant. The parameters and levels are shown in Table II and the experimental design is shown in Table III. Before welding, each faying surface was cleaned with acetone to ensure cleanliness of the surfaces. In each set of welding trials, one parameter was varied while the other parameters were kept as constant. For each set of parameters three joints were prepared and their average values were taken.
Friction welding parameters.

Experiment design.

C. Friction weld experiments
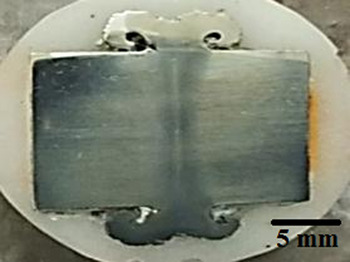
The friction weld samples were subjected to x-ray diffraction technique (XRD) to determine for any surface or sub surface defects. Based on the XRD results, it was ensured that the welds had absolutely defect free joints. Then the welded samples were further subjected to different metallurgical and mechanical characterization studies. The specimens were mounted and later flattened and then polished using SiC abrasive paper with grit ranges from 180 to 1200. Subsequently the samples were polished using 3 µm diamond paste. Samples were then washed, cleaned by acetone and then dried. It was followed by electrolytic etching in 10% oxalic acid at 9 V for 30 seconds as per ASTM E3-11. The typical macrograph of the friction joint is shown in Fig. 1.
Typical macrograph of the weld joints.

The mechanical characteristics of friction welds were evaluated from tensile tests at room temperature and hot tensile tests were performed at different temperatures namely room temperatures (RT), 550, 650 and 750 °C. These were carried out in a universal testing machine of 40 ton capacity. The tensile test was done according to ASTM E-21 standard. Three tensile samples were tested for each set of the welding experiments and their average values were noted. The Charpy test specimens were prepared according to the ASTM E-23 standard. The impact toughness of the joints was determined by pendulum impact testing machine at room temperature. Microhardness survey was carried out using a HMV-2000 Vickers microhardness tester (Wilson, Shanghai, China) at 500 g load for 10 s. The microhardness tests were performed on a transverse section of the weld centre to identify the possible effects of microstructural heterogeneities in the weld. Samples for characterization were prepared using standard metallographic techniques. The weld metal grain size was measured as per ASTM standard E112-89. The fractured surfaces were studied through JEOL JSM-5610 LV SEM (JEOL Ltd., Tokyo, Japan) equipped with energy dispersive spectrometer (EDS) to study the quantitative analysis of the welds. To identify the phases, XRD was carried out using Cu–Kα radiation on weld region. In addition, the microstructural characterization of the weld was also studied to understand the individual effect of friction welding parameters.
III. RESULTS AND DISCUSSION
A. Base metal microstructure
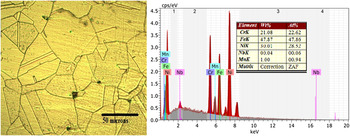
The base material microstructure and EDS result are shown in Fig. 2. The material was received in hot rolled and annealed at a temperature of approximately 1150 °C which enhances the grain growth and carbide dissolution. This leaves some carbon available for precipitation during service. The as-received microstructure revealed a heavily twinned austenitic grain structure with small amounts of intragranular titanium carbonitride [Ti(C,N)]. Incoloy 800H contains 0.56 wt% titanium and 0.06 wt% carbon; and hence there might be a tendency to form titanium carbide and titanium carbonitride during high temperature exposure. It was reported that titanium carbides and carbonitride did not dissolve easily during solution annealing even if high soaking temperatures were used. 15
Base material microstructures.

The average austenite grain size was estimated using linear intercept technique and found to be 60 μm. The internal oxidation at the grain boundaries could be observed in the base material microstructure.
B. Microstructure of weldments
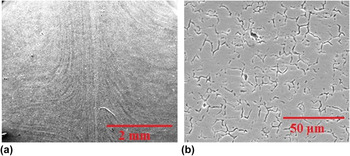
The unetched macrostructure of weldments showed uniform symmetric flash in the joint area. From Fig. 3(a), the material flow direction could be identified. This is a characteristic of similar friction welds. The SEM image showed skeletal type morphology of ferrite at the grain boundaries which could be observed in Fig. 3(b). Measurement of δ-ferrite using Fisher ferritoscope (Fisher, Sindelfingen, Germany) revealed the content around 1 ferrite number. The detailed descriptions of the weld metal (plasticized zone-PZ) and partially deformed zone (PDZ) microstructure are presented in the table form (Table IV). Since experiment number 1, 4, 7, 10, and 13 have same process parameters and produced similar results experiment number 1 alone is included for discussion.
Typical macro and microstructure.

Description of the weld and PDZ microstructures.

The all weld metal microstructure revealed very fine equiaxed grains than the PDZ microstructure. And the grains were uniformly distributed in the weld zone and some of the microstructure has significant presence of fewer amounts of γ′ phases. The grain size was measured using line intercept method for all the microstructures and the values are presented in Table V. The effect of the individual input parameters was also identified.

High friction and upsetting pressure could lead to very fine grain size. This is due to higher friction pressure that could induce higher amount of heat causing recrystallization at the joint interface resulting in fine grain size. Due to the higher amount of heat, the material got a softened state and it was easy for to flow the material in the rotating direction. Because of heat and flow direction of the materials the grain sizes were refined in weld and PDZ zone. The higher upsetting pressure caused more rubbing in the two contact surfaces and their grains were finer and also higher flash thickness was obtained. Due the low rotational speed, the heat generated in the two contact surfaces were less and also less bonding strength was obtained. Higher rotational speed can enhance the amount of heat at the joint interface that could lead to the formation of γ′ phase with homogeneous fine grain structure and more joint strength was obtained. The low friction time can produce insufficient amount of heat and it may form coarse grains without carbide precipitates. The higher friction time could produce sufficient amount of heat and good joint interface was obtained with very finer grains. At low upsetting time, the material flow direction could be controlled and also a very limited grain elongation occurred and finally the grains were coarser. High upsetting time and a sufficient amount of time could lead to elongated grains and very fine grains were obtained finally. The weld metal microstructures were homogenous with particles precipitated along the grain boundary. All the weld metal joint interface microstructure was mainly consisted of austenite phase. The weld joint interface grains were mainly elongated structures with a very few equiaxed grains. Table IV shows that low friction time and low upsetting time microstructures consisted of austenitic phase and some amount of M23C6 particles. As it is well known that due to faster cooling rate the friction weld had very fine sub grain structures. Niobium (Nb) had the tendency to increase the bulk of solidification temperature range during solidification. The substructure tended to change from cellular to the columnar dendritic, or change from columnar to equiaxed dendritic as the degree of constitutional super cooling increased. Reference DuPont, Robino and Marder16 To the authors' knowledge, no theories have so for quantitatively predicted sub grain structure solidification mode of transitions. Reference Luo, Li, Dong and Xu9 The PDZ is presented in Table IV. It is observed that, the PDZ had more coarse grains than the weld metal microstructure. It mainly consisted of austenite phase structure with a small amount of secondary phases.
C. XRD studies on the weld
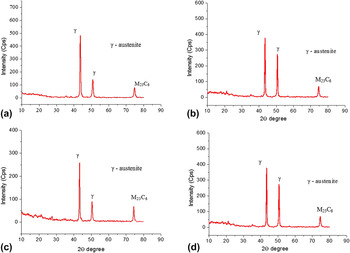
γ′ and M23C6 transformation were possible, if sufficient amount of heat was generated in the joint interface. However γ′ is not directly apparent by microstructure characterization techniques. To further investigate the possibility of γ′ and M23C6, XRD tests were carried out within the weld zone and the results are shown in Figs. 4(a)–4(d). γ′ formation in austenitic stainless steel is an interesting phenomenon and an important factor in the strengthening of materials.
X-ray diffraction diagram. (a) (Exp. no. 3), (b) (Exp. no. 4), (c) (Exp. no. 9), (d) (Exp. no. 10).

The x-ray diffractogram revealed the presence of γ phase and M23C6 precipitates. The less amount of heat generated in the weld interface (N-1500 rpm, FP-60 MPa, FT-3 s, UP-145 MPa, UT-3 s) might be the reason for more chances for the presence of' M23C6 and γ-phase. From Table IV it is seen that microstructures presented strong peak denoted as a M23C6 contained in a matrix of austenite due to less amount of heat occurring in the joint interface. From the above observations, it could be concluded that less amount of heat in the joint interface had significant influence on the formation of M23C6 and very less tendency to form γ′ phase. The chromium carbide precipitates in the alloy 800H at the temperature range of 540–1095 °C. 15 So the reduction of heat and lower cooling rate at the joint interface leads to the formation of M23C6. Also when these precipitates are formed in a much finer grain boundary enhances the fatigue and grain boundary strengthening. Reference He, Zheng, Sun, Hou, Guan and Hu17
D. Mechanical properties of weldments
1. Tensile strength of the welds
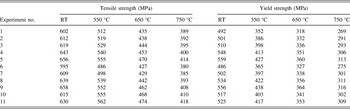
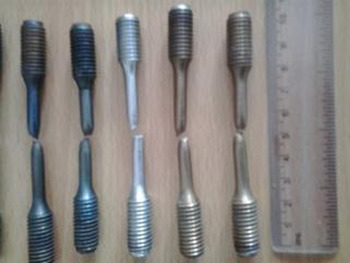
The tensile tests were conducted as per ASTM E 21 specification. The transverse tensile strength of friction welded joints was evaluated at different temperatures: RT, 550, 650, and 750 °C. In each condition, three specimens were tested and the average tensile strength values were reported in Table VI. From Table VI, it was clear that the weld metal tensile strength was much higher than the base metal tensile strength for all conditions. The tensile tested samples are shown in Fig. 5.
Tensile strength and yield strength of the welds.

Tensile tested sample.

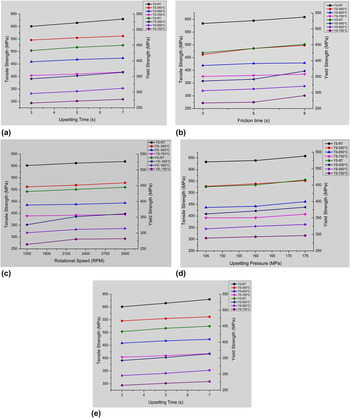
From Fig. 5, it is clearly seen that the fractures occurred approximately 3 mm distance away from the joint interface. The tensile tested experimental values are presented in Table VI. The tensile strength and yield strength of the joints were correlated with the individual effect of the parameters as shown in Figs. 6(a)–6(e). From figure it is seen that high friction pressure and upset pressure had better joint strength. High friction pressure and the employment of more amount of heat led to the formation of γ′ phase and it was helpful to obtain more amount of softened state condition in the faying surfaces. Due to the softened state, the materials could easily flow in the rotation direction and also the grains were more elongated. Hence, due to elongation, the grains could reduce the tendency of the original shape to a very fine size. Higher upsetting pressure could reveal more rubbing action and high amount of heat generated in the joint interface and the grains were more elongated in the joint interface and finally very fine grains occurred. Because of very fine grain size, the tensile strength of the joint interface was much higher than the other individual parameters. Low rotational speed could affect the joint interface, because of less heat produced in the interface the grains were coarser. Higher rotational speed that could lead to the formation of good bonding strength and fine grain sizes were also observed. Low heating and upsetting time can form less bonding strength. This was due to insufficient time for developing the bonding in the interface. Finally it led to the coarse grains. From Table VI the tensile properties of friction welding of 800H were evaluated at temperatures ranging from room temperature 30 °C to 750 °C. The results indicated that the tensile strength was reduced with increasing temperature.
Individual parameter effects with respect to the tensile and yield strength. (a) Upsetting time versus tensile strength. (b) Friction time versus tensile strength. (c) Rotational speed versus tensile strength. (d) Upsetting pressure versus tensile strength. (e) Friction pressure versus tensile strength.

From the experimental results, it was found that high heating pressure and upsetting pressure produced high tensile strength of the joints. The maximum tensile strength was obtained as follows: Exp. 9-room temperature (658 MPa), 550 °C (562 MPa-Exp. no. 11), 650 °C (474 MPa-Exp. no. 11), and 750 °C (418 MPa-Exp. no. 12) for higher upsetting pressure at 175 MPa because of enhanced grain refinement. When the temperature increased from room temperature to 750 °C, the tensile strength of weldment showed a little variation due to the formation of secondary phases at the weld joint. Figures 6(a)–6(e) presents the individual parameter effects with respect to the tensile strength and yield strength.
From Figs. 6(d) and 6(e), it was observed that as the upsetting pressure and friction pressure increased, there was an increase in tensile strength of 9.3% from the tensile test conducted at room temperature.
2. Fractography of weldments
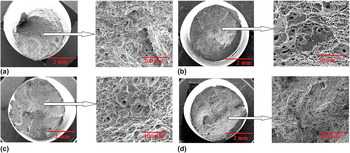
The SEM micrographs obtained with specimens tested in various temperatures and their failure surfaces are shown in Figs. 7(a)–7(d).
In Figs. 7(a)–7(d), the fractographs showed a mixed mode of cleavage and ductile fracture in all fracture samples. The fracture surface of Incoloy 800H exhibited a cleavage type of fracture associated with considerable amount of dimples [Fig. 7(a)]. While the hot tensile fracture surface under 550 °C showed a mixed mode cleavage facet along with dimples [Fig. 7(b)]. The carbides were qualitatively measured and γ′, M23C6 carbides found to be situated at the grain boundaries as well as in the matrix. These carbides were stable and enabled the alloy to have strong strengthening effect at high temperature. However, coarse carbide particles dispersed in the matrix can be postulated to initiate micro-voids at their interface with matrix which would lead to dimples in the ductile fracture process of the matrix. Further the cracks propagated along this path easily and hence the fracture appeared in partly cleavage mode.
Tensile tested SEM fracture surface. (a) Room temperature (Exp. no. 1), (b) 550 °C (Exp. no. 4), (c) 650 °C (Exp. no. 9), and (d) 750 °C (Exp. no. 11).

3. Toughness of the welds
Charpy V-notch specimens from the transverse cross-section of weldments with dimensions as per ASTM E-23 standard were prepared. The notch was located parallel to the direction of rotation. The toughness of the friction joints is presented in Table VII.
Experimental impact values of the weldments.

The base metal impact energy was 100 Joules. From Table VII, it was observed that the toughness values of all the friction joints were higher than the base metal toughness. And also the results indicated that the Charpy energy decreased with increasing upsetting pressure values. This was due to high upsetting pressure leading to the formation of fine grains resulting in increase in hardness, hence decrease in toughness. The higher impact energy was 144 J (Exp. no. 5). The volume fraction of M23C6 [Figs. 4(a)–4(d)] had an influence on the toughness of welds (Exp. no. 4 & 5). From the above observations, it was inferred that deformation formed γ′ and M23C6 had specific influence on the toughness of welds.
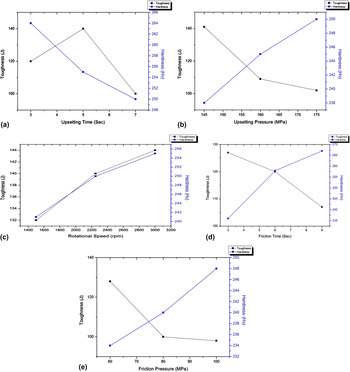
From Fig. 8(a) it was clear that when the upsetting time increased, the toughness increased to a certain extent and then reduced. At the same time hardness showed a decreasing trend. As the duration of upsetting time was increased the contact between the faying surfaces got increased. This led to the formation of finer grains. Effect of the upsetting pressure and hardness are presented in Fig. 8(b). From Fig. 8(b) it is clear that as the upsetting pressure increased, hardness values also increased (234 HV to 267 HV) due to the formation of finer grains.
Individual effect of parameters with respect to hardness and toughness. (a) Upsetting time versus toughness. (b) Upsetting pressure versus toughness. (c) Rotational speed versus toughness. (d) Friction time versus toughness. (e) Friction pressure versus toughness.

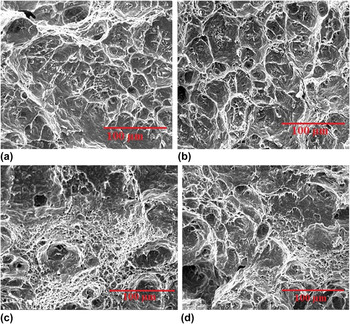
Figure 8(c) shows that by increasing rotational speed, toughness and hardness of welds were increased and due to the high rotational speed, high temperature was obtained and the combined effects of the friction pressure and upsetting pressure resulted in fine grains. From Fig. 8(d) it is inferred that an increase in friction time led to the increase in hardness. Figure 8(e) shows that an increase in the friction pressure of the joint led to the formation of higher temperature at interface region and fine grains were formed due to the increase the hardness of friction welded joint. The fractured surface of impact specimens was analyzed using SEM. The fractured surface of the impact tested fractrograph is shown in Figs. 9(a)–9(d).
Impact tested SEM fracture surface. (a) Exp. no. 1. (b) Exp. no. 4. (c) Exp. no. 9. (d) Exp. no. 11.

Figure 9(b) shows shallow dimples. Also a few microscopic dimples were located at the periphery of facet boundaries. Figures 9(a)–9(d) shows shallow fracture with fine dimples. A few large sized dimples along with fine dimples were noticed in the fractographs. Figure 9(d) shows similar kind of fracture features with similar level of toughness.
4. Microhardness of the welds
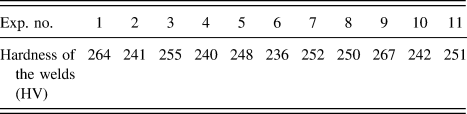
The Vickers hardness test was performed on the etched transverse cross-section of the friction welds using a load of 500 g, which was applied for duration of 10 s. Five measurements in each welded zone were taken at regular intervals and the values are presented in Table VIII.
Hardness of the weldments.

During friction welding, the material generally loses its original strength induced by strain hardening. The secondary phase formed in the weld increased the hardness of the welds. In general, there was a positive correlation between hardness and strength; the higher the hardness value, the higher was the strength. Therefore, if the weld zone hardness was higher than the base metal, the joining strength was also high. This propensity was obviously displayed in the tensile test results. The higher hardness values were 267 and 264 HV (Exp. no. 1 & 9). This might be due to fine grain size and partial amount of γ′ and M23C6 phase present in the weld zone.
IV. CONCLUSIONS
The following conclusions are drawn from the present investigation:
-
(1) Defect-free weld joints were obtained by continuous drive friction welding process.
-
(2) The weld metal microstructure revealed that the fine grains were uniformly distributed in the weld zone and the secondary phases (γ′ and M23C6) were also observed.
-
(3) The impact toughness of the weld was found to be influenced by microstructure and volume fraction of phases. As the volume fraction of M23C6 increased there was degradation on toughness of welds.
-
(4) Friction welds exhibited higher impact toughness than the base material. As the upsetting pressure increased there was reduction in toughness of welds.
-
(5) Friction welds produced higher tensile strength than the base material. As the testing temperature increased, the strength of welds was decreased.