Implications
Two-stage selection by ovulation rate (OR) and litter size (LS) could be a way to improve the number of commercial young rabbits more effectively than direct selection. This enhancement was due to an increase in prenatal survival and no changes in peri- and postnatal survivals in rabbits. These results could be explained by an improvement of uterine capacity.
Introduction
In rabbits, indirect selection for either uterine capacity or OR for increasing LS has not been more effective than direct selection (Santacreu et al., Reference Santacreu, Mocé, Climent and Blasco2005; Laborda et al., Reference Laborda, Mocé, Blasco and Santacreu2012). However, a higher response in LS was found in a two-stage rabbit selection by OR and LS (Ziadi et al., Reference Ziadi, Mocé, Laborda, Blasco and Santacreu2013), in agreement with previous results in pigs (Ruiz-Flores and Johnson, Reference Ruiz-Flores and Johnson2001). These results are in accordance with the theory developed by Bennet and Leymaster (Reference Bennett and Leymaster1989), which predicted that selecting both traits is more effective than selecting each of them separately.
In a two-stage selection experiment performed in pigs (Ruiz-Flores and Johnson, Reference Ruiz-Flores and Johnson2001), an increase in number of stillborn was found in a line previously selected by an index of OR and embryonic survival. In pigs, unfavourable genetic relationships between LS and perinatal and pre-weaning survivals were found (Lund et al., Reference Lund, Puonti, Rydhmer and Jensen2002; Rosendo et al., Reference Rosendo, Druet, Gogué, Canario and Bidanel2007; Su et al., Reference Su, Lund and Sorensen2007; Putz et al., Reference Putz, Tiezzi, Maltecca, Gray and Knauer2015), thus the improvement of LS has usually led to a decrease in these survivals. In rabbits, this adverse genetic relationship has not been investigated, but it is known that high OR increases uterine overcrowding and therefore competition among foetuses (Laborda et al., 2011 and Reference Laborda, Mocé, Blasco and Santacreu2012). A reduction in the development of foetuses and their placentas was observed in rabbits when the number of implanted embryos increased (Argente et al., Reference Argente, Santacreu, Climent and Blasco2006), which may affect perinatal and pre-weaning survivals.
The experiment of two-stage selection by OR and LS in rabbits by Ziadi et al. (Reference Ziadi, Mocé, Laborda, Blasco and Santacreu2013) did not estimated correlated responses for LS traits and survival traits. This experiment has been continued four generations more, until generation 17. The aim of this work is to estimate direct and correlated responses on prenatal and postnatal survival and LS traits in this line.
Material and methods
Animals and experimental design
Animals involved in this experiment came from a synthetic line (line OR_LS). Line OR_LS underwent 17 generations of selection. From base generation to generation six (first selection period), females were selected only for OR. From generation 7 to 17 (second selection period), a two-stage selection for OR and LS was performed. More details of the experimental procedure can be found in Ziadi et al. (Reference Ziadi, Mocé, Laborda, Blasco and Santacreu2013).
Breeding and feeding management
The first mating of females was performed at 18 to 20 weeks of age, and then 11 to 12 days after each parity. Females that did not accept males were mated again 7 days afterwards. Pregnancy was checked ~12 days after mating by abdominal palpation. Adult animals were housed at the farm of the Universitat Politècnica de València in individual cages (flat-deck) having extractable nest box with isolated plastic. Kits were housed in dam’s cages up to weaning (28 days of age) and then were placed in flat-deck cages during fattening, until 63 days of age (eight to nine rabbits per cage). Selected rabbits were placed in individual flat-deck cages from 9 to 18 weeks of age. During fattening, rabbits were fed ad libitum with a commercial diet (CP, 15.0%; crude fibre, 16.8%; crude fat, 2.4%; ash, 7.3% as fed basis; Nanta, S.A.®, Valencia, Spain). From 63 days old, rabbits were fed with a commercial diet (CP, 16.5%; crude fibre, 15.0%; crude fat, 3.0%; ash, 7.8% as fed basis; Nanta, S.A.®). Animals were reared under a photoperiod of 16-h light : 8-h dark and controlled temperature and ventilation.
Traits measured
1. Litter traits recorded in up to five parities
a. Ovulation rate: estimated as the number of corpora lutea, it was measured by laparoscopy at day 12 of second gestation. A second measurement of OR was done postmortem in the last gestation.
b. Litter size: measured as number of total born at parturition.
c. Number of kits born alive (NBA): NBA at parturition.
d. Number of kits born dead (NBD): NBD at parturition.
e. Number of kits at weaning (NW): number of kits at 28 days of age (weaning) per litter.
f. Number of young rabbits at slaughter (NS): number of young rabbits at 63 days of age (slaughter) per litter.
2. Survival traits
a. Prenatal survival (LS/OR): survival from ovulation to birth.
b. Survival from ovulation to slaughter (NS/OR) ((a) and (b) estimated from second gestation).
c. Perinatal survival (NBA/LS): survival at birth.
d. Survival at weaning (NW/NBA): survival from birth to weaning.
e. Survival at slaughter (NS/NW): survival from weaning to slaughter.
f. Survival from birth to slaughter (NS/LS) ((c), (d), (e) and (f) estimated in up to five parities).
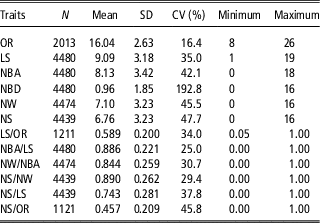
Data from 1210 laparoscopies and 4480 parities were analysed. Number of records for each trait is presented in Table 1 and were obtained from August 2001 to January 2014. The number of animals in the pedigree was 30 666.
Descriptive analysis for ovulation rate (OR, ova), litter size (LS), number of kits born alive (NBA), number of kits born dead (NBD), number of kits at weaning (NW), number of rabbits at slaughter (NS), prenatal survival (LS/OR), survival at birth (NBA/LS), survival at weaning (NW/NBA), survival at slaughter (NS/NW), survival from birth to slaughter (NS/LS) and survival from ovulation to slaughter (NS/OR) in OR_LS line

OR_LS line is a rabbit line selected for OR at second gestation from generation 0 to 6 and later for OR at second gestation and LS of the first two parities from generation 7 to 17.
Statistical analysis
Data from 17 generations (six from the first selection period and 11 from the second one) were analysed using Bayesian inference methods. The model used to analyse the data for all traits, except for LS/OR and NS/OR, was:
 $$y_{{ijkl}} {\equals}YS_{i} {\plus}L_{j} {\plus}a_{k} {\plus}p_{k} {\plus}e_{{ijkl}} $$
in which, y ijkl is the record of the trait, YS i the effect of year season (three months per each year season; 44 levels for OR and 49 levels for the other traits), L j the effect of lactation status at mating (four levels for OR; lactating primiparous, non-lactating primiparous, lactating multiparous and non-lactating multiparous; five levels for the other traits; nulliparous status was also included), a k the genetic additive value of the animal k, p k the permanent environmental effect of the female k and e ijkl the residual of the model. Number of kits born dead was analysed as a threshold trait, divided into three categories (zero; from one to three; more than three).
The model used to analyse survival from ovulation to birth (LS/OR) and survival from ovulation to slaughter (NS/OR) had no permanent environmental effect, since there was only data from the second gestation. For both traits, the effect of year season had 38 levels and the effect of lactation status at mating had two levels, lactating and non-lactating primiparous females.
Heritabilities and correlations between OR and LS were estimated using a bivariate analysis. Heritabilities and correlations for the other traits were estimated using a trivariate analysis including the selection criteria (OR and LS) and one of the remaining traits.
Random effects were considered independent between them. The joint prior distribution assumed for additive genetic effects was N(0, A
 $\,\otimes\,$
G
a
), where G
a
was the genetic (co)variance matrix between the additive effects of the traits and A was the additive genetic relationship matrix. The joint prior distribution assumed for permanent effects was N(0, I
 $\,\otimes\,$
G
p
), where G
p
was the (co)variance matrix between the permanent effects of the traits. The residual prior distribution for all traits was
 $$N\left( {{\bf 0},\,\,{\bf I\sigma }_{{\bf e}}^{{\bf 2}} } \right)$$
. Bounded uniform priors were used for all fixed effects and the (co)variance matrices.
Gibbs sampling algorithm was used to estimate marginal posterior distributions of all unknowns. Data augmentation were done to obtain the same design matrices (Blasco, Reference Blasco2017). The program TM (Legarra et al., Reference Legarra, Varona and López de Maturana2008) was used for Gibbs sampling procedures. Markov chains of 3000000 iterations and a burn-in period of 750 000 was used. In order to reduce autocorrelation between consecutive samples, one sample every 100th iterations was saved. Monte Carlo standard errors (MCse) were estimated and convergence was tested using the Z criterion of Geweke.
We considered a heritability to be irrelevant when it was lower than 0.10. In the case of correlation, we considered to be an irrelevant value all correlations in absolute value lower than 0.30, since the percentage of the variance explained by the other trait (r 2) is <10%. The features of the marginal posterior distributions used were: mean, high posterior density interval at 95% (HPD95%), probability of the mean being higher (or lower) than zero (P), probability of relevance (P r, probability of being higher (or lower) than the assumed relevant value), probability of similitude (P s, probability of being in absolute value lower than the assumed relevant value) and the guaranteed value (k) at 80% (value k of the interval [k, 1] containing the 80% of the probability). All these features are described in Blasco (Reference Blasco2017).
Results and discussion
Income in meat rabbit depends on the number of rabbits arriving at slaughter (Cartuche et al., Reference Cartuche, Pascual, Gómez and Blasco2014). We know that two-stage selection for OR and LS increase the number of total born (Ziadi et al., Reference Ziadi, Mocé, Laborda, Blasco and Santacreu2013) and it is important to assess the effect on LS and survival rate from birth to slaughter. Means, standard deviations and CV for LS traits and survival rates are shown in Table 1. These values are in the range of those published in maternal rabbit lines by García and Baselga (Reference García and Baselga2002a) and Laborda et al. (Reference Laborda, Mocé, Blasco and Santacreu2012). For NBD, the CV was extremely high because ~50% of data are zero. Survival from ovulation until slaughter were <50% of the number of ova shed and the 75% of this loss occurs before birth. Postnatal survivals were high, close to 0.90.
Similar genetic parameters and response to selection by generation were found for OR, LS and prenatal survival by Ziadi et al. (Reference Ziadi, Mocé, Laborda, Blasco and Santacreu2013) analysing the same experiment with four generations less.
Heritability
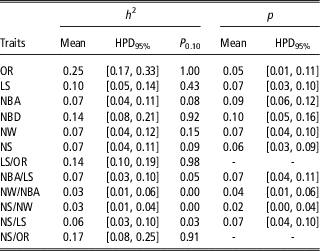
Features of the marginal posterior distributions of the heritability are shown in Table 2. All MCse were very small and lack of convergence was not detected by the Geweke test. Heritabilities were low and not relevant for NBA, NW and NS (0.07). These heritabilities for LS from birth to slaughter were in agreement with other studies in rabbit maternal lines (García and Baselga, Reference García and Baselga2002a; Ragab and Baselga, Reference Ragab and Baselga2011).
Features of the marginal posterior distributions of the heritability (h 2) and permanent effect (p) of ovulation rate (OR), litter size (LS), number of kits born alive (NBA), number of kits born dead (NBD), number of kits at weaning (NW), number of rabbits at slaughter (NS), prenatal survival (LS/OR), survival at birth (NBA/LS), survival at weaning (NW/NBA), survival at slaughter (NS/NW), survival from birth to slaughter (NS/LS) and survival from ovulation to slaughter (NS/OR) in OR_LS line

HPD95%=high posterior density interval at 95%; P 0.10=probability of the heritability being higher than 0.10.
OR_LS line is a rabbit line selected for OR at second gestation from generation 0 to 6 and later for OR at second gestation and LS of the first two parities from generation 7 to 17.
According to our knowledge, there are no heritability estimations for NBD and postnatal survival traits in rabbits. The heritability for NBD, analysed as threshold trait, was relevant (0.14), P 0.10=0.92. In pigs, similar heritability was found by Arango et al. (Reference Arango, Misztal, Tsuruta, Culbertson and Herring2005) analysing data from Large White sows using also a threshold model. However, Ruiz-Flores and Johnson (Reference Ruiz-Flores and Johnson2001) found a higher heritability (0.29±0.05) analysing the number of stillborn as a linear trait. Heritabilities for postnatal survival traits were low and not relevant, ranging from 0.03 (NW/NBA) to 0.07 (NBA/LS). For survival from birth to weaning and from weaning to slaughter, heritabilities were close to zero. Regarding survival at birth, Lund et al. (Reference Lund, Puonti, Rydhmer and Jensen2002) found the same heritability to our estimation in pigs, but slightly higher heritabilities were found by Damgaard et al. (Reference Damgaard, Rydhmer, Løvendahl and Grandinson2003) and by Su et al. (Reference Su, Lund and Sorensen2007), ranging from 0.10 to 0.13. In concordance to our results, Su et al. (Reference Su, Lund and Sorensen2007) found that heritability of survival at birth was higher than survival after birth. When these authors evaluated survival at birth as a piglet trait, lower heritability was obtained (Su et al., Reference Su, Lund and Sorensen2007; Kapell et al., Reference Kapell, Ashworth, Knap and Roehe2011). In general, heritabilities of LS and peri- and postnatal survivals at different times were low, although for NBD, LS/OR and NS/OR were relevant.
Permanent environmental effect
Features of the marginal posterior distributions of the permanent environmental effect are also shown in Table 2. The permanent environmental effects on LS traits and survival traits were of the same magnitude to the additive effects. Permanent effects for NBA, NW and NS were consistent with results obtained in rabbits, for example García and Baselga (Reference García and Baselga2002a) and Ragab and Baselga (Reference Ragab and Baselga2011). To our knowledge, there is no information about permanent environmental effect of NBD analysed with a threshold model in rabbits and pigs.
Regarding peri- and postnatal survival traits, survival at birth showed the highest permanent effect (0.07), decreasing at weaning and slaughter. No literature was found in relation to permanent environmental effects of peri- and postnatal survival traits in rabbits. In pigs, in general, Su et al. (Reference Su, Lund and Sorensen2007), Kapell et al. (Reference Kapell, Ashworth, Knap and Roehe2011) and Putz et al. (Reference Putz, Tiezzi, Maltecca, Gray and Knauer2015) obtained similar permanent effect for survival at birth and they observed that permanent effect decreased from birth to weaning.
Correlations between litter size and other traits
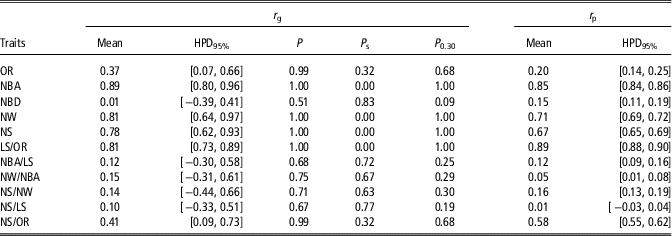
Features of the marginal posterior distributions of the phenotypic and genetic correlations between LS and other traits are shown in Table 3. We considered 0.30 as a relevant value because for a correlation of 0.30, the percentage of the variance explained by the other trait (r 2) is <10%. Therefore, the probability of similitude was defined as the probability of correlation being in the interval [−0.30, 0.30].
Features of the marginal posterior distributions of the genetic (r g) and phenotypic (r p) correlation between litter size (LS) and ovulation rate (OR), number of kits born alive (NBA), number of kits born dead (NBD), number of kits at weaning (NW), number of rabbits at slaughter (NS), prenatal survival (LS/OR), survival at birth (NBA/LS), survival at weaning (NW/NBA), survival at slaughter (NS/NW), survival from birth to slaughter (NS/LS) and survival from ovulation to slaughter (NS/OR) in OR_LS line

HPD95%=high posterior density interval at 95%; P=probability of the correlation being higher than 0; P s=probability of similitude, probability of the correlation being between −0.30 and 0.30; P 0.30=probability of the correlation being higher than 0.30 when correlation is higher than 0 or lower than −0.30 when correlation is lower than 0.
OR_LS line is a rabbit line selected for OR at second gestation from generation 0 to 6 and later for OR at second gestation and LS of the first two parities from generation 7 to 17.
All HPD95% for genetic correlations between LS and other traits were large, except for NBA, NW and NS. Nevertheless, we can distinguish when a genetic correlation is null for practical purposes (high P s), and when we do not have data enough to know whether the genetic correlation is null or not. The genetic correlation between LS and NBA was high and relevant, as expected. The guaranteed value (k) at 80% of this genetic correlation was also very high, 0.85 (data not shown). High genetic correlations between LS with NW and with NS were also obtained. Positive and high values for these correlations were also found by García and Baselga (Reference García and Baselga2002a and 2002Reference García and Baselgab) in rabbits. These findings show that LS from birth to slaughter is essentially determined by the same genes. Genetic correlation between LS and NBD was low, and we can say that it was null for practical purposes, since its probability of similitude was relatively high (0.83). In pigs, similar correlation between number of born alive and of stillborn was found by Arango et al. (Reference Arango, Misztal, Tsuruta, Culbertson and Herring2005). Besides, Ruiz-Flores and Johnson (Reference Ruiz-Flores and Johnson2001) also found a low correlation (0.20) between total number of piglets born and number of stillborn pigs.
No information about the genetic correlation between LS and peri- and postnatal survivals was previously published in rabbits and little is known in pigs. In our work, genetic correlations between LS and peri- and postnatal survivals were low, the HPD95% were large and the probability of similitude ranging from 0.63 to 0.77. In pigs, all genetic correlations between number of total born and survival at birth were low and with low accuracy, from positive (Rosendo et al., Reference Rosendo, Druet, Gogué, Canario and Bidanel2007; Kapell et al., Reference Kapell, Ashworth, Knap and Roehe2011) to negative values (Su et al., Reference Su, Lund and Sorensen2007; Kapell et al., Reference Kapell, Ashworth, Knap and Roehe2011; Nielsen et al., Reference Nielsen, Su, Lund and Madsen2013). For survival from birth to weaning, we found a positive and low correlation with LS. Low to moderate negative correlations were found in pigs by Su et al. (Reference Su, Lund and Sorensen2007), Rosendo et al. (Reference Rosendo, Druet, Gogué, Canario and Bidanel2007) and Putz et al. (Reference Putz, Tiezzi, Maltecca, Gray and Knauer2015).
Correlations between ovulation rate and other traits
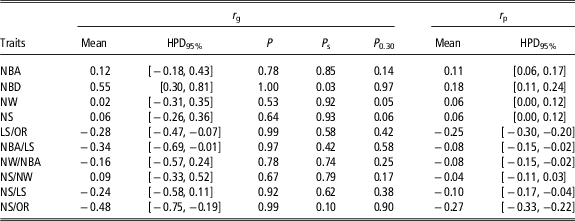
Features of the marginal posterior distributions of the phenotypic and genetic correlations between OR and other traits are shown in Table 4. These genetic correlations were estimated with low accuracy since it is difficult to have a large number of records of traits measured by laparoscopy. The genetic correlations for OR with NBA, NW and NS were irrelevant (P s>0.85); irrelevant correlation for OR with NBA was also found by Laborda et al. (Reference Laborda, Mocé, Santacreu and Blasco2011). Low (positive and negative) genetic correlations between OR and LS traits were found in pigs (Johnson et al., Reference Johnson, Nielsen and Casey1999; Ruiz-Flores and Johnson, Reference Ruiz-Flores and Johnson2001). On the other hand, a relevant positive genetic correlation between OR and NBD was observed (P 0.30=0.97). Similar to our result, positive and moderate-high genetic correlations between OR and number of stillborn pigs were found by Johnson et al. (Reference Johnson, Nielsen and Casey1999) and Ruiz-Flores and Johnson (Reference Ruiz-Flores and Johnson2001).
Features of the marginal posterior distributions of the genetic (r g) and phenotypic (r p) correlation between ovulation rate (OR) and number of kits born alive (NBA), number of kits born dead (NBD), number of kits at weaning (NW), number of rabbits at slaughter (NS), prenatal survival (litter size (LS)/OR), survival at birth (NBA/LS), survival at weaning (NW/NBA), survival at slaughter (NS/NW), survival from birth to slaughter (NS/LS) and survival from ovulation to slaughter (NS/OR) in OR_LS line

HPD95%=high posterior density interval at 95%; P=probability of the correlation being higher than 0; P s=probability of similitude, probability of the correlation being between −0.30 and 0.30; P 0.30=probability of the correlation being higher than 0.30 when correlation is higher than 0 or lower than −0.30 when correlation is lower than 0.
OR_LS line is a rabbit line selected for OR at second gestation from generation 0 to 6 and later for OR at second gestation and LS of the first two parities from generation 7 to 17.
A low and negative genetic correlation between OR and survival at birth was found. This result agrees closely with the relevant and positive genetic correlation between OR and NBD. Similar genetic correlation between OR and survival at birth was found by Rosendo et al. (Reference Rosendo, Druet, Gogué, Canario and Bidanel2007) in pigs. Low genetic correlations with low accuracy were obtained for OR and survival at weaning and also at slaughter. Genetic correlation between OR and survival from ovulation to slaughter was moderate (−0.48) and relevant (P 0.30=0.90).
Features of the estimated marginal posterior distributions of the phenotypic correlations of LS and OR with the other traits are also showed in Tables 3 and 4. Phenotypic correlations had the same size and sign as their relative genetic correlations.
Response to selection
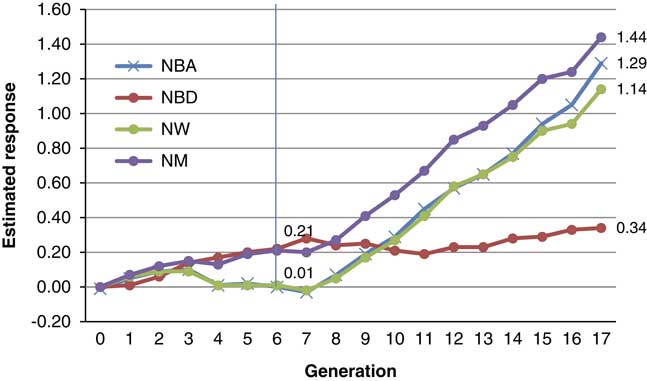
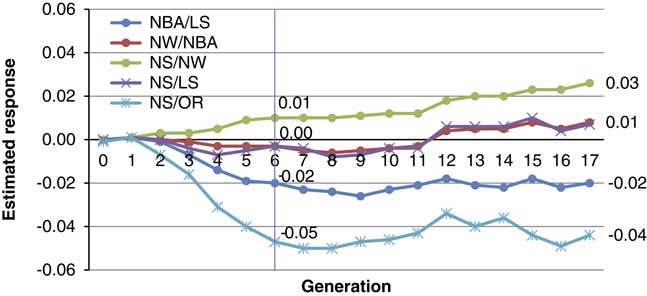
Genetic trends for litter size traits and survival traits are shown in Figures 1 and 2, respectively. Correlated responses to selection were estimated at the end of both periods of selection as the difference between the average breeding values at the end and beginning of each period. Both periods of selection were distinguished in all figures.
Genetic trends for number of kits born alive (NBA), number of kits born dead (NBD), number of kits at weaning (NW) and number of rabbits at slaughter (NS) of OR_LS line. OR_LS line is a rabbit line selected for ovulation rate at second gestation from generation 0 to 6 and later for ovulation rate at second gestation and litter size of the first two parities from generation 7 to 17. Values represent the mean of the estimated breeding value of the trait at the end of both selection periods.

Genetic trends for survival at birth (number of kits born alive (NBA)/litter size (LS)), survival at weaning (number of kits at weaning (NW)/NBA), survival at slaughter (number of rabbits at slaughter (NS)/NW), survival from birth to slaughter (NS/LS) and survival from ovulation to slaughter (NS/Ovulation rate) of OR_LS line. OR_LS line is a rabbit line selected for ovulation rate at second gestation from generation 0 to 6 and later for ovulation rate at second gestation and litter size of the first two parities from generation 7 to 17. Values represent the mean of the estimated breeding value of the trait at the end of both selection periods.

Selection only for ovulation rate
Selection for OR improved 1.44 ova after six generations of selection, although it did not cause the expected enhancement in LS (0.07 kits per generation) due to a decrease in prenatal survival as Ziadi et al. (Reference Ziadi, Mocé, Laborda, Blasco and Santacreu2013) observed. No correlated response was observed for NBA, whereas at the same time a slight increase in NBD (−0.04 kits per generation; Figure 1). At weaning, no correlated response was either observed, whereas low correlated response on NS was found (0.04 young rabbits per generation). Similar results on NBA and NW were observed in a rabbit selection experiment for OR (Laborda et al., 2011 and Reference Laborda, Mocé, Blasco and Santacreu2012) and also in pigs (Cunningham et al., Reference Cunningham, England, Young and Zimmerman1979; Rosendo et al., Reference Rosendo, Druet, Gogué, Canario and Bidanel2007).
A slight decrease in survival at birth (NBA/LS; Figure 2) was observed due to an increase in NBD (Figure 1), whereas survival at weaning was not modified and survival at slaughter was slightly modified (Figure 2). Due to the negative correlated response on prenatal and perinatal survival, a decrease on NS/OR was observed. There is no information about postnatal survival traits in selection experiments for OR in rabbits. In pigs, no correlated responses in percentage of stillborn and of survival from birth to weaning were found after six generations of selection by OR by Rosendo et al. (Reference Rosendo, Druet, Gogué, Canario and Bidanel2007).
Selection by independent culling levels for ovulation rate and litter size
As selection for OR did not increase LS more than direct selection, a two-stage experiment selection for OR and LS was proposed as another alternative way to improve LS in rabbits (Ziadi et al., Reference Ziadi, Mocé, Laborda, Blasco and Santacreu2013). Response per generation for LS, OR and prenatal survival after 11 generations of two-stage selection was similar to previous results published by Ziadi et al. (Reference Ziadi, Mocé, Laborda, Blasco and Santacreu2013) analysing seven generations. Correlated response for NBA (0.12 kit per generation; Figure 1) was similar to direct response for LS, in agreement to the high genetic correlation between them and to the lack of response for NBD. The improvement estimated during the second period of selection was 0.12 kits and 0.11 young rabbits per generation for NW and NS, respectively. In pigs, a higher response on the number of pigs born alive was obtained in two lines underwent of two-stage selection on OR and fully formed pigs at birth (0.21 and 0.24 piglets born alive; Ruiz-Flores and Johnson, Reference Ruiz-Flores and Johnson2001). Besides, these authors obtained a correlated response on number of stillborn (0.11±0.03 per generation) in the line with higher OR and no correlated response, as in our experiment, in the other selected line. Similar to our results, a positive correlated response on number of weaned in both lines of the two-stage selection experiment were obtained (0.09 and 0.16 weaned piglets). Besides, Lamberson et al. (Reference Lamberson, Johnson, Zimmerman and Long1991) observed a similar direct response on number of piglets at birth (0.13 piglets per generation) using a line selected for LS during eight generations. This line had high OR due to previous selection for OR.
Different correlated responses on prenatal and perinatal survival were observed in the second period of selection compared with the first one. Prenatal survival decreased until generation six and then increased around 1% per generation (data not shown) in the two-stage selection period in agreement with the results found by Ziadi et al. (Reference Ziadi, Mocé, Laborda, Blasco and Santacreu2013). Perinatal survival also decreased until generation six and no correlated response was observed in the second period (Figure 2). Two-stage selection did not modify survival at weaning and slaughter. Besides, no correlated response was also observed on NS/LS and NS/OR. After two-stage selection by OR and LS, an improvement in uterine capacity might have been achieved, which could account for the changes in NBD and in prenatal and perinatal survivals. Experiments of selection for uterine capacity highlight that increasing uterine capacity can modify several biological processes like an increase in the length of uterine horns (Argente et al., Reference Argente, Santacreu, Climent and Blasco2006 in rabbits; Lents et al., Reference Lents, Cushman and Freking2014 in pigs), a higher placental efficiency (review in pigs by Foxcroft et al., Reference Foxcroft, Dixon, Dyck, Novak, Harding and Almeida2009) or changes in protein level expression (e.g. progesterone receptor, Peiró et al., Reference Peiró, Herrler, Santacreu, Merchán, Argente, García, Folch and Blasco2010 in rabbits). Therefore, changes in the biological processes related to the uterine capacity improvement could explain the increase in prenatal survival and non-reduction of the peri- and postnatal survival found after two-stage selection by OR and LS.
In summary, selection for OR resulted in an improvement in ova shed but with a lower correlated response on number of kits at birth, weaning and slaughter. However, a slight negative correlated response on survival at birth was observed, whereas survivals at weaning and slaughter were not modified. Selection using independent culling levels for OR and LS resulted in an improvement not only of both traits but also the number of kits at birth, weaning and slaughter. Survival at birth was not reduced, possibly due to an improvement of uterine capacity. Besides, survival at weaning and slaughter were also unchanged.
Acknowledgements
This study was supported by the Ministerio de Economía y Competitividad (AGL2014-55921-C2-1-P) and by funds from Generalitat Valenciana research programme (Prometeo 2009/125). A.Y.B. was supported by a grant of the Egyptian Ministry of Higher Education.
Declaration of interest
The authors declare no conflicts of interest in this article.
Ethics statement
All experimental procedures involving animals were approved by the Universitat Politècnica de València Research Ethics Committee.
Software and data repository resources
None of the data were deposited in an official repository.