INTRODUCTION
In China, the Northeast Farming Region (NFR, Fig. 1) is one of the most important grain producing regions where maize (Zea mays L.), rice (Oryza sativa L.), soybean (Glycine max L. Merr.) and spring wheat (Triticum aestivum L.) are the four principal crops, accounting for >0·18 of China's total cereal grain production (PINC Archives 2011). Approximately 0·30 of China's maize, 0·40 of japonica rice and 0·33 of soybean are produced in NFR (Liu et al. Reference Liu, Yang, Hubbard and Lin2012; Zheng et al. Reference Zheng, Zhang and Kou2012b ). Normally, maize, soybean and wheat are grown under rain-fed conditions in NFR, while rice is always irrigated. With the increase in socioeconomic development, agricultural inputs and technology, crop production has changed considerably across NFR; maize, rice, soybean and wheat yields have all increased significantly during recent decades. Maize, rice and soybean growing areas have increased continuously, while wheat growing has decreased substantially (Li et al. Reference Li, Zhang and Chen2008; Chen et al. Reference Chen, Qian, Deng and Zhang2012; Liu et al. Reference Liu, Yang, Chen and Wang2013b ).
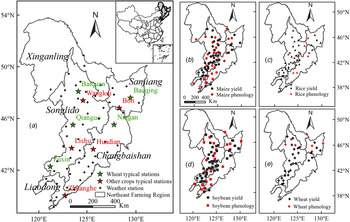
Location of (a) weather stations, yield stations and agro-meteorological experimental stations for (b) spring maize, (c) rice, (d) soybean and (e) spring wheat. In (b–e), the red points represent agro-meteorological experimental stations, and the black points represent yield stations. In (a), the red stars represent the typical yield stations of maize, rice and soybean, and the green stars represent the typical yield stations of wheat. Colour online.

Climate change has been observed across the world during the last 50 years, which has significantly affected crop production (IPCC 2013). The NFR is one of the areas in China that is most susceptible to climate change, where the annual temperature has increased by 0·38 °C per decade, precipitation has decreased at a rate of c. 3·3 mm per decade and daily sunshine duration has declined at a rate of 0·11 h every 10 years during the last few decades (Piao et al. Reference Piao, Ciais, Huang, Shen, Peng, Li, Zhou, Liu, Ma, Ding, Friedlingstein, Liu, Tan, Yu, Zhang and Fang2010; Chen et al. Reference Chen, Lei, Deng, Qian, Hoogmoed and Zhang2011; Jia & Guo Reference Jia and Guo2011; IPCC 2013; Liu et al. Reference Liu, Yang, Chen and Wang2013b ). Although crop yields have increased, climate change and variability have caused large fluctuations between years (Chen et al. Reference Chen, Lei, Deng, Qian, Hoogmoed and Zhang2011, Reference Chen, Qian, Deng and Zhang2012; Liu et al. Reference Liu, Yang, Chen and Wang2013b ; Tao et al. Reference Tao, Zhang, Shi, Liu, Xiao, Zhang, Zhu, Wang and Liu2013, Reference Tao, Zhang, Zhang and Rötter2014). Drought risk has always been considered to be the largest limitation for crop production in NFR. Increases in temperature and decreases in precipitation have been associated with more frequency of drought events during the last 50 years, which has caused substantial yield losses, especially for the rain-fed crops (maize, soybean and wheat) (Zhang Reference Zhang2004; Piao et al. Reference Piao, Ciais, Huang, Shen, Peng, Li, Zhou, Liu, Ma, Ding, Friedlingstein, Liu, Tan, Yu, Zhang and Fang2010; Xu et al. Reference Xu, Ge, Zheng, Dai, Zhang, He and Liu2013). Several studies have reported that increasing maximum temperature has significantly reduced yields of maize, soybean and wheat in NFR during recent decades (Ju et al. Reference Ju, Xiong and Xu2008; Tao et al. Reference Tao, Yokozawa, Liu and Zhang2008; Zheng et al. Reference Zheng, Chen and Han2009; Liu et al. Reference Liu, Yang, Hubbard and Lin2012).
Recent studies have indicated that temperatures above the optimum may lead to heat stress, thus resulting in significant yield reduction (Schlenker & Roberts Reference Schlenker and Roberts2009; Lobell et al. Reference Lobell, Bänziger, Magorokosho and Vivek2011, Reference Lobell, Sibley and Ortiz-Monasterio2012, Reference Lobell, Hammer, McLean, Messina, Roberts and Schlenker2013; Semenov & Shewry Reference Semenov and Shewry2011; Gourdji et al. Reference Gourdji, Sibley and Lobell2013). Heat stress greatly reduces crop yield and quality, especially during the flowering and grain filling periods, and heat stress can accelerate leaf senescence and affect final grain weight by shortening grain filling duration (Zhao et al. Reference Zhao, Dai, Jing, Jiang and Cao2007). High temperatures will also enhance evapotranspiration, thus exacerbating drought stress. To date, there are no reports on crop response to heat stress in NFR, except as part of global-scale studies (Gourdji et al. Reference Gourdji, Sibley and Lobell2013). It is projected that temperature may increase by 3–5 °C in the 21st century, and drought and heat stress may become more severe in NFR by the mid-21st century (Ding et al. Reference Ding, Ren, Shi, Gong, Zheng, Zhai, Zhang, Zhao, Wen, Wen, Luo, Chen, Gao and Dai2006; Zhao & Luo Reference Zhao and Luo2007; Piao et al. Reference Piao, Ciais, Huang, Shen, Peng, Li, Zhou, Liu, Ma, Ding, Friedlingstein, Liu, Tan, Yu, Zhang and Fang2010; Gourdji et al. Reference Gourdji, Sibley and Lobell2013; IPCC 2013; Teixeira et al. Reference Teixeira, Fischer, van Velthuizen, Walter and Ewert2013). Due to the important role of NFR for China's food security, it is crucial to understand how climate change affects crop production, especially the influences of extreme climatic events, such as drought and heat stress, on crop yield.
Weather will affect crop yield differently in different crop growth phases, particularly between the vegetative and reproductive phases (Hu & Buyanovsky Reference Hu and Buyanovsky2003; Kristensen et al. Reference Kristensen, Schelde and Olesen2011; Trnka et al. Reference Trnka, Brázdil, Olesen, Eitzinger, Zahradníček, Kocmánková, Dobrovolný, Štěpánek, Možný, Bartošová, Hlavinka, Semerádová, Valášek, Havlíček, Horáková, Fischer and Žalud2012; Lobell et al. Reference Lobell, Hammer, McLean, Messina, Roberts and Schlenker2013; Liu et al. Reference Liu, Liu, Tian, Cao, Zhu and Asseng2014). Normally, the crop growing season in NFR extends from early April to late September. Maize and soybean are sown in May and harvested in September, rice is sown in April and harvested in September, while spring wheat is sown in April and harvested in early August (Liu & Chen Reference Liu and Chen2005). Given the differences in extent of the growing season of the individual crops, particularly in the sowing and harvest dates, the effects of climatic variability on crop yield is also expected to differ among crops. However, the relationships between crop yield and climatic factors for specific growth phases have not yet been explored in NFR, except in global studies (Gourdji et al. Reference Gourdji, Sibley and Lobell2013; Deryng et al. Reference Deryng, Conway, Ramankutty, Price and Warren2014). In addition, little evidence is available to certify whether extreme climatic events such as drought and heat stress during specific crop growth phases have increased as a result of climate change in NFR during the last 50 years. Therefore, the purpose of the present study is: (1) to analyse whether climatic factors have changed in each crop growth phase over the period of 1961–2010 and (2) to investigate the effects of climatic factors in specific crop growth phases on crop yield across NFR.
MATERIALS AND METHODS
Area description
The study area is located in Northeast China, comprising the Northeast of Inner Mongolia, Heilongjiang, Jilin and most parts of Liaoning provinces (Fig. 1(a)). The area includes 304 counties, with 1·42 × 107 ha farmland. The NFR consists of five sub-regions: Xinganling, Sanjiang, Songliao, Changbaishan and Liaodong (Liu & Chen Reference Liu and Chen2005). The region is located between 40 and 54°N and is a temperate semi-humid zone, where the annual accumulated temperature above 10 °C is 1700–3600 °Cd and the frost free period normally starts around 28 March and ends around 2 October. The annual mean sunshine duration is 2400–2900 h. Annual precipitation is 500–800 mm, 0·80 of which falls during May–September (Li et al. Reference Li, Zhang and Chen2008; Chen et al. Reference Chen, Lei, Deng, Qian, Hoogmoed and Zhang2011). The climatic conditions of NFR are favourable for crop production due to the warm summers and abundant sunshine during the growing season.
Data sources
Data from 58 meteorological observation stations across NFR were used (Fig. 1(a)). Historical daily meteorological data for each station were obtained from the National Meteorological Network of China Meteorological Administration (CMA Archives 2011), including minimum, mean and maximum air temperature, precipitation, bright sunshine hours at a height of 2 m, wind speed at a height of 10 m and average relative humidity. Crop yield information over the period 1961–2010 was obtained from the Planting Information Network of China (PINC Archives 2011). A total of 44 maize yield stations, 42 rice yield stations, 45 soybean stations and 29 wheat yield stations were selected based on the completeness of records from 1 January 1961 to 31 December 2010 (Figs 1(b–e)) and the crop yield record was the mean value of each station every year. The yield data were used to analyse changes of crop yield and to analyse the effects of weather conditions on crop yield. Five representative stations across NFR were selected to demonstrate temporal changes of yield for each crop (Fig. 1(a)), and the average crop yield for the whole NFR was used to analyse the temporal trends in yield for the entire region.
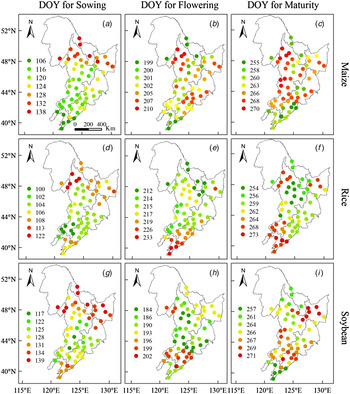
Records of crop phenology (sowing, flowering and maturity dates) of maize, rice, soybean and wheat during the period 1981–2010 were collected from the Chinese Meteorological Administration (CMA Archives 2011), which included data from 40 maize, 17 rice, 32 soybean and 11 wheat agro-meteorological experimental stations (Figs 1(b–e)). The temporal trends of sowing, flowering and maturity dates for maize, rice, soybean and wheat are shown in Figs 1S and 2S (available from http://journals.cambridge.org/AGS). For maize and rice, the trends for sowing dates were to be earlier in the north but later in the south; while for soybean, sowing dates tended to be later in most stations in NFR, although most of them are not significant. The variability in phenological dates makes it difficult to interpret the effects of climatic conditions on crop yield, if a different phenological date is used to calculate the crop growth duration each year. Therefore, the average dates of sowing, flowering and maturity for the period 1981–2010 were used for the entire period from 1961 to 2010. Figure 2 shows that there are considerable differences in the date of sowing, flowering and maturity for each crop across NFR, with earlier sowing in the south and later in the north; however, due to changes over time in varieties as well as the response of crops to day length, flowering and maturity dates vary less across NFR. For weather stations without crop phenology data, phenological dates from a nearby agro-meteorological experimental station were used. However, since there are only 11 wheat agro-meteorological experimental stations and most of them are concentrated in the northern NFR (Figs 1(e) and 2S (available from http://journals.cambridge.org/AGS)), the same phenological record for all 58 stations for spring wheat was adopted using the average of all 11 wheat agro-meteorological experimental stations (sowing on 16 April, flowering on 30 June and maturity on 2 August). Thus, fixed, but local-specific dates of sowing, flowering and maturity were used to calculate the climate indices in the present study.
Spatial distribution of average DOY (Julian day of year) for sowing, flowering and maturity dates for (a–c) maize, (d–f) rice and (g–i) soybean in NFR during 1981 and 2010. Colour online.

Data analysis
Climate factors, including mean minimum temperature, mean solar radiation (calculated from sunshine hours using the equation developed by Rietveld (Reference Rietveld1978)), accumulated precipitation, aridity and heat degree-days (HDD) were used to evaluate the impacts of climatic factors in different growth phases on crop yield. Thermal time was also calculated to describe the effects of temperature on development. In order to analyse climatic effects on crop yield in different growth phases, the crop growing season was divided into vegetative and reproductive periods. Since crops are generally more sensitive to climatic conditions around flowering, weather conditions in this phase may be of particular importance. Therefore the reproductive period was divided into flowering and post-flowering phases, so that three growth phases were included in the study: pre-flowering (from sowing to 10 days before flowering), flowering (20 days centred around flowering) and post-flowering (10 days after flowering to harvest). The average of the 58 stations of climatic factors was used to represent the climatic condition for the entire NFR.
Aridity is an index for assessing drought risk in the crop growing season that considers total precipitation and evapotranspiration, which has been widely used (Meng et al. Reference Meng, Ni and Zhang2004). It can be computed as:
 $$Aridity = 1 - P/ETo$$
Aridity was used to assess the drought risk in each crop growth phase, ETo is the reference evapotranspiration that was calculated by the SIMETAW model, which is based on the Penman–Monteith equation (Snyder et al. Reference Snyder, Orang, Geng, Matyac and Sarreshteh2005) and P is precipitation during each crop growth phase. If the aridity is <0, it means that precipitation exceeds crop demand, and 0 is used to replace all negative values. If the aridity is >0, it means that drought may occur, and the greater the value, the more severe the drought.
The HDD index was considered to include the frequency of heat stress as well as the heat duration and intensity in each crop growth phase, which has been suggested as the most suitable single heat stress index for crops in previous studies (Lobell et al. Reference Lobell, Bänziger, Magorokosho and Vivek2011; Liu et al. Reference Liu, Liu, Tian, Cao, Zhu and Asseng2014). It was calculated by accumulating daily maximum temperatures above a threshold temperature:
 $$\eqalign{HDD &= \sum\limits_{t = 1}^N {HDD_t}, \;HDD_t \cr & = \left\{ \matrix{{0}, \,\,\,\,\,\,\,\,\,\,\,\,\,\,\,\,\,\,\,\,\,\,\,\,\,\,{\rm if}\,\,T_{\max} \le T_{th} \hfill \cr \matrix{ {{\rm (}T_{\max} {\rm -} T_{th} {\rm ), if}\,\,T_{\max} {\rm \gt} T_{th}} & {} \cr} \hfill} \right.}$$
where T max is daily maximum temperature, T th is the threshold temperature for crop growth, HDD t represents the HDD on day t, and N is the number of days in each growth phase. According to previous studies, the threshold temperature for maize and soybean growth is 30 °C (Schlenker & Roberts Reference Schlenker and Roberts2009; Lobell et al. Reference Lobell, Hammer, McLean, Messina, Roberts and Schlenker2013), while that for spring wheat growth is 27 °C (Semenov & Shewry Reference Semenov and Shewry2011; Olesen et al. Reference Olesen, Borgesen, Elsgaard, Palosuo, Rotter, Skjelvag, Peltonen-Sainio, Borjesson, Trnka, Ewert, Siebert, Brisson, Eitzinger, van Asselt, Oberforster and van der Fels-Klerx2012). Tashiro & Wardlaw (Reference Tashiro and Wardlaw1989) reported that the threshold maximum temperature for rice grain production is 35 °C, while other studies have reported that rice grain yield is reduced by about 10% per 1 °C temperature increase above 25 °C (Baker & Allen Reference Baker and Allen1993; Peng et al. Reference Peng, Huang, Sheehy, Laza, Visperas, Zhong, Centeno, Khush and Cassman2004). The historical maximum temperature in NFR has not reached 35 °C during recent decades (Chen et al. Reference Chen, Lei, Deng, Qian, Hoogmoed and Zhang2011; Sun & Huang Reference Sun and Huang2011), so considering the above points, the threshold temperature for rice growth was set to 30 °C in the present study.
Thermal time (TH) was estimated from daily mean temperature at each site as:
 $$\eqalign{TH & = \sum\limits_{t = 1}^N {TH_t\comma} \;TH_t \cr & = \left\{ \matrix{{\rm 0\comma}\hfill &{\rm if}\ T_{mean}\; \le \;T_{base} \hfill \cr \left( {T_{mean} - T_{base}} \right){\comma}&{\rm if}\ T_{mean}\; \gt \;T_{base} {\rm} \hfill} \right.}$$
where T mean is daily mean temperature, T base is the base temperature for crop growth, TH t represents the TH on day t and N is the number of days in each growth phase. The base temperature for maize, rice and soybean growth is 10 °C in NFR (Li et al. Reference Li, Yang, Tang, Wu, Chen, Zhou, Zou and Zhang2011; Chen et al. Reference Chen, Qian, Deng and Zhang2012; Liu et al. Reference Liu, Yang, Chen and Wang2013b ) and the base temperature for wheat growth is 4 °C (Olesen et al. Reference Olesen, Borgesen, Elsgaard, Palosuo, Rotter, Skjelvag, Peltonen-Sainio, Borjesson, Trnka, Ewert, Siebert, Brisson, Eitzinger, van Asselt, Oberforster and van der Fels-Klerx2012).
Crop yield is influenced by several technological and environmental factors and showed increasing trends due to improvements in genetics, fertilizer application and management (Hu & Buyanovsky Reference Hu and Buyanovsky2003; Chen et al. Reference Chen, Lei, Deng, Qian, Hoogmoed and Zhang2011). Crop yield time series were measured using a broken linear method (Olesen et al. Reference Olesen, Bøcher and Jensen2000), which can be described as in Eqns (4) and (5). After the removal of the trend yield, the remaining part can be assumed to reflect climate effects.
 $$\left\{ {\matrix{ {Y_n} = a + {b_1}x,\hfill & x \le {x_b} \hfill \cr {Y_n} = a + {b_1}{x_b} + {b_2}(x - {x_b}),\hfill & x \gt {x_b} \cr \hfill }}\right.$$
 $$Y_{cn} = Y_{an} - Y_n $$
where Y n is the predicted crop yield, x is year, and x b is constrained to 1965 < x b < 2005 to reduce risk of spurious estimates of x b . Ycn and Y an are the yield anomaly and the actual yield of the year n, the yield anomaly is the difference between annual yield and predicted yield over the period 1961–2010. The parameters of Eqn (4) were estimated using the NLIN procedure of SAS 9·3 software (SAS Institute Inc., Cary, USA). Yield anomaly can be assumed to reflect the impacts of climatic variation (Fig. 3).
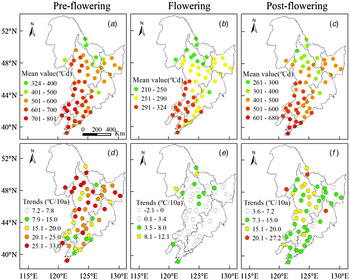
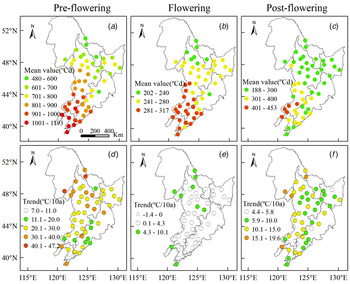
Spatial distribution of mean thermal time (accumulative mean temperature above 10 °C) and the temporal trends of thermal time in each maize growth phase over 1961–2010. In (d–f), the empty cycles indicate that the temporal trend is not significant, while the cycles with colours show that the temporal trend is significant (P < 0·05). Colour online.

The linear relation was used to estimate the relationships between climate factors and crop yield in each growth phase in the study. It was assumed that climatic factors in each growth phase may have different effects on crop yield, and a mixed linear regression model was used to evaluate climate effects on the crop yield in the study (Zuur et al. Reference Zuur, Ieno and Elphick2010; Kristensen et al. Reference Kristensen, Schelde and Olesen2011). For crop yield stations without corresponding weather stations, the best-fitted nearby weather station was used in the analysis. Given that aridity is calculated using precipitation, precipitation was excluded from the final mixed model. Drought in the previous phase may also affect crop growth in the next phase, thus the interactions of aridity in sequential growth phases were also considered. Therefore, the minimum temperature, solar radiation, aridity and HDD were included in the mixed model. Since there was no information about varieties or technology, year was also included in the model to represent the development of varieties and technology, and the station was used as the random effect in the model. Multi-collinearity commonly occurs when a large number of independent variables are incorporated in a regression model; therefore the variance inflation factor (VIF) was used to evaluate multi-collinearity of the mixed model in the study (Zuur et al. Reference Zuur, Ieno and Elphick2010). According to Montgomery et al. (Reference Montgomery, Peck and Vining2012), if VIF is <10, multi-collinearity should not be a problem in the mixed model, otherwise multi-collinearity would influence the results and measures should be taken to reduce collinearity between variables. The VIF values for each mixed model are shown in Table 1S (available from http://journals.cambridge.org/AGS). Since the interactions of aridity between sequential growth phases were considered, there could be multi-collinearity between aridity in the interactions and the separate growth phase, but this multi-collinearity will not influence other variables in the mixed model. Thus, multi-collinearity is not a problem in the present study. Finally, the mixed model can accurately reflect the effects of climatic factors in most cases (Tables 2 and 2S (available from http://journals.cambridge.org/AGS)). The mixed model can be written as follows:
 $$\eqalign{Y = & Y_0 + \alpha_{s}Y_{r} + \beta_ {pre}T_ {pre} + \beta_{ flow}T_{flow} + \beta _{post}T_{post} \cr & + \chi _{pre}R_{pre} + \chi _{flow}R_{flow} + \chi _{post}R_{post} \cr & + \delta_{ pre}A_{pre} + \delta_{ flow}A_{flow }+ \delta_{ pre} \times\ _{flow}\!A_{{pre} \,\times\, flow} \cr & + \delta_{ flow} \times \,_{post}A_{flow \,\times\, post} + \delta_{ post}A_{post} \cr &+ \eta_{ pre}H_{pre} + \eta _{flow}H_{flow} + \eta _{post}H_{post} + X_s + \varepsilon} $$
where Y represents actual crop yield, Y 0 is the model intercept, Y r is year, αs is the coefficient for year at station s; T, R, A and H represent the minimum temperature, solar radiation, aridity and HDD, respectively; β, χ, δ and η are coefficients for each climate variable in specific phases, X s is a random error associated with station, and ε is the residual error. The subscripts ‘pre’, ‘flow’ and ‘post’ represent the pre-flowering, flowering and post-flowering phases, respectively. There were 2200, 2100, 2250 and 1340 observations in the maize, rice, soybean and wheat mixed model, respectively. All the analyses were made with SAS 9·3 software (SAS Institute Inc., Cary, USA).
RESULTS
Changes of climatic factors during crop growing season
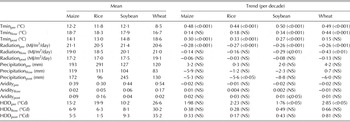
Minimum temperature increased significantly in all three growth phases over the period 1961–2010. Minimum temperature increased at a rate of 0·44–0·50 °C per decade in the pre-flowering phase, which was faster than for the other phases. Minimum temperature in the pre-flowering phase of wheat was much lower compared with the same phase of the other three crops because of the earlier start of the growth phase for wheat (Table 1). The HDD increased significantly (P < 0·05) in the pre-flowering phase of soybean and wheat (Table 1). Solar radiation decreased significantly (P ⩽ 0·01) in the seeding phase for all crops and in the flowering phases of soybean and wheat, and it decreased at a rate of 0·28, 0·27, 0·26 and 0·26 MJ/m2/day per decade in the pre-flowering phase of maize, rice, soybean and wheat, respectively, and declined by 0·29 and 0·43 MJ/m2/day per decade in the flowering phase of soybean and wheat, respectively (Table 1). Aridity was highly related to precipitation, with higher rainfall resulting in less aridity and vice versa. Precipitation decreased at a rate of 5·6 mm per decade in the post-flowering phase of rice (Table 1). Aridity tended to increase in the post-flowering phase of rice and soybean, while it decreased in the pre-flowering phase of wheat (Table 1).
Mean and temporal trends of mean minimum temperature, average solar radiation, accumulative precipitation, aridity index and heat degree-days (HDD) index in the pre-flowering, flowering and post-flowering phases over 1961–2010 in Northeast Farming Region (NFR)

The subscript ‘pre’ represents the pre-flowering, ‘flow’ represents the flowering, and ‘post’ represents the post-flowering phase. The values in brackets show the P values. NS, not significant.
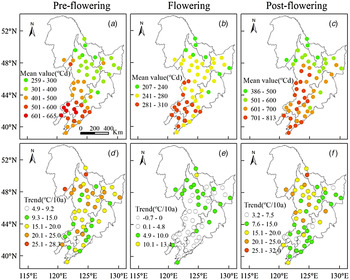
During the period 1961–2010, the average thermal time decreased from south to north in each growth phase for each crop (Figs 3–6). The mean thermal time was highest in the pre-flowering phases of maize, rice and wheat because of the long growing period (Figs 3, 4 and 6), while for soybean it was highest in the post-flowering phase (Fig. 5). Thermal time increased significantly (P < 0·05) in most parts of NFR in the pre-flowering phase of each crop, and it increased faster in the north than in the south (Figs 3–6). Thermal time increased considerably both in the northern parts of NFR in the flowering phase of soybean and in the eastern parts of NFR in the flowering phase of wheat (Figs 5 and 6). Similar to the spatial temporal trends of thermal time in the pre-flowering phase, thermal time increased significantly (P < 0·05) in the post-flowering phases of maize, rice and soybean (Figs 3–5).
Spatial distribution of mean thermal time (accumulative mean temperature above 10 °C) and the temporal trend of thermal time in each rice growth phase over 1961–2010. In (d–f), the empty cycles indicate that the temporal trend is not significant, while the cycles with colours show that the temporal trend is significant (P < 0·05). Colour online.

Spatial distribution of the mean thermal time (accumulative mean temperature above 10 °C) and the temporal trend of thermal time in each soybean growth phase over 1961–2010. In (d–f), the empty cycles indicate that the temporal trend is not significant, while the cycles with colours show that the temporal trend is significant (P < 0·05). Colour online.

Spatial distribution of the mean thermal time (accumulative mean temperature above 4 °C) and the temporal trend of thermal time in each wheat growth phase over 1961–2010. In (d–f), the empty cycles indicate that the temporal trend is not significant, while the cycles with colours show that the temporal trend is significant (P < 0·05). Colour online.

Changes in crop yield
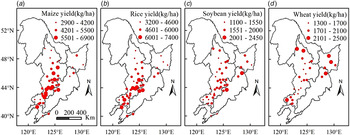
The mean maize yield over the 50-year period varied from 2900 to 6900 kg/ha across NFR (Fig. 7(a)). It was lower in the north NFR than the south, with the highest yields in Central Songliao. The mean rice yield over the whole period varied from 3200 to 7400 kg/ha across NFR (Fig. 7(b)). Spatial distribution of the mean rice yield was similar to maize. Mean soybean yield for the last 50 years was 1100–2500 kg/ha across NFR. The lower yielding counties were mainly in the west NFR, with higher yields in Central Songliao and Sangjiang (Fig. 7(c)). The mean wheat yield for the last 50 years was 1300–2500 kg/ha across NFR. The higher wheat yield counties were located in the north NFR and Southwest Songliao, whereas yields in other parts were lower (Fig. 7(d)).
Spatial variation of mean (a) maize yield, (b) rice yield, (c) soybean yield and (d) wheat yield during 1961 and 2010. Colour online.

Maize
Average maize yield increased from 1400 kg/ha in 1961 to 7700 kg/ha by 2010. However, the rate of increase slowed in the 2000s (Fig. 8(f)). Maize yield among the five stations was highest in Lishu, which increased at a rate of 310 kg/ha/year from 1961 to 2005 but fluctuated during the period 2006–2010 (Fig. 8(c)). However, the increases in maize yield were stable in the other four stations during the last 50 years (Fig. 8(a, b, d, e)).
Temporal changes of actual yield, predicted yield and yield anomaly of maize for typical stations and NFR during 1961 and 2010. All the linear models are significant (P < 0·001), where (a–f), respectively, represents Wangkui, Boli, Lishu, Huadian, Zhuanghe and NFR, and NFR is the average maize yield of all 44 maize yield stations across NFR. The slope of the functions represents yield gain per year after 1961, x represents the year since 1961, and the breaking point was tested by the broken linear method, which is the key point that divides the yield trend into two different periods. It is the same for Figs 9–11.

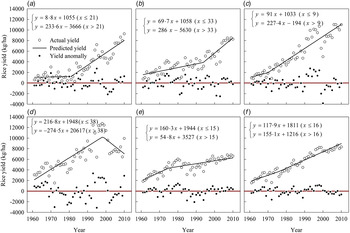
Temporal changes of actual yield, predicted yield and yield anomaly for rice production for typical stations and NFR during 1961 and 2010. All the linear models are significant (P < 0·001), where (a–f), respectively, represents Wangkui, Boli, Lishu, Huadian, Zhuanghe and NFR, and NFR is the average rice yield of all 42 rice yield stations across NFR.

Rice
Average rice yield increased consistently over the 1961–2010 period (Fig. 9(f)). It was highest in Lishu and Huadian and increased considerably over the whole period of 1961–2010 in all five stations except in Huadian (Figs 9(a–e)), where it increased significantly (P < 0·001) from 1961 to 1999, but decreased considerably (P < 0·001) from 1999 to 2010 (Fig. 9(d)).
Soybean
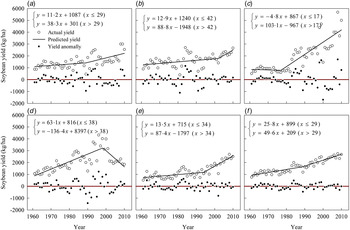
Average soybean yield increased consistently over the entire 50-year period (Fig. 10(f)). Figure 10 shows that soybean yield was highest in Lishu and Huadian, and increased fastest in Lishu at a rate of 103 kg/ha/year from 1978 to 2010. However, soybean also showed a decreasing trend in Huadian between 1999 and 2010 (Figs 10(c and d)).
Temporal changes of actual yield, predicted yield and yield anomaly for soybean production for typical stations and NFR during 1961 and 2010. All the linear models are significant (P < 0·001), where (a–f), respectively, represents Wangkui, Boli, Lishu, Huadian, Zhuanghe and NFR, and NFR is the average soybean yield of all 45 soybean yield stations across NFR.

Wheat
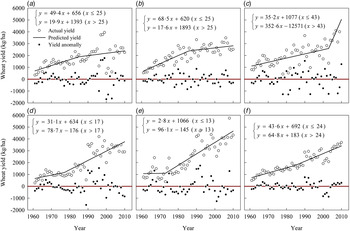
The increase in average wheat yield was stable during the 1961–2010 period (Fig. 11(f)). It increased at all selected stations during the last 50 years and it increased fastest in Baoqing, at a rate of 353 kg/ha/year from 2004 to 2010 (Figs 11(a–e)).
Temporal changes of actual yield, predicted yield and yield anomaly for wheat production for typical stations and NFR during 1961 and 2010. All the linear models are significant (P < 0·001), where (a–f), respectively, represents Baiquan, Ningan, Baoqing, Qianguo, Fuxin and NFR, and NFR is the average wheat yield of all of 29 wheat yield stations across NFR.

Climatic effects on crop yield
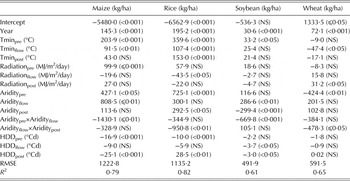
When considered together with solar radiation, aridity and HDD in the mixed model, results show that higher minimum temperature in each growth phase would have positive effects on maize, rice and soybean yield (Table 2). A 1 °C increase of minimum temperature in the pre-flowering phase would lead to increases of 204, 360 and 33 kg/ha in maize, rice and soybean yield, respectively, and a rise of 1 °C in minimum temperature during the flowering phase would lead to an increase of 92 and 107 kg/ha in maize and rice yield, respectively. An increase of 1 °C in minimum temperature during the post-flowering phase would also lead to an increase of 153 kg/ha in rice yield. However, a higher minimum temperature would have negative effects on wheat yield, especially in the flowering phase, and 1 °C increase in minimum temperature in this phase would reduce yield by 47 kg/ha (Table 2).
Parameter estimates for the mixed model on crop yields and minimum temperature, solar radiation, aridity and heat degree-days (HDD) in crop growing season across the Northeast Farming Region (NFR) of China during the period 1961–2010

The subscript ‘pre’ represents the pre-flowering, ‘flow’ represents the flowering and ‘post’ represents the post-flowering phase. The interactions of aridity were measured in the mixed model. The values in brackets show the P values.
NS, not significant.
When solar radiation was considered together with minimum temperature, aridity and HDD (Table 2), a 1 MJ/m2/day increase in solar radiation would lead to an increase of 100 kg/ha in maize yield in the pre-flowering phase, and a rise of 1 MJ/m2/day in solar radiation in the post-flowering period would increase wheat yield by 31 kg/ha. However, for rice, a 1 MJ/m2/day increase of solar radiation in the flowering phase would reduce yield by 44 kg/ha (Table 2).
When considering aridity together with minimum temperature, solar radiation and HDD in a mixed model (Table 2), the interactions of aridity had the greatest effect in reducing yield during the pre-flowering and flowering phases for maize and soybean, but during the flowering and post-flowering phases for rice and wheat.
When considering HDD together with minimum temperature, solar radiation and aridity in the analyses, HDD had no significant effects on wheat yield in any growth phase (Table 2). In maize and rice, a 1 °Cd increase of HDD in the pre-flowering phase would lead to losses of 16·9 and 10·0 kg/ha, respectively, while an elevation of 1 °Cd in HDD in the flowering phase would lead to yield loss of 3·7 kg/ha in soybean, and a rise of 1 °Cd HDD in the post-flowering phase would lead to yield losses of 25·1 and 3·0 kg/ha in maize and soybean, respectively. However, higher HDD in the post-flowering phase increased rice yield significantly (P < 0·01) (Table 2).
DISCUSSION
Influences of temperature on crop phenology
Increasing temperature has meant that the date of first effective temperature for crop growth (T mean ⩾ 10 °C) during the 1961–2010 period occurs earlier in the year, thus leading to earlier sowing (Chen et al. Reference Chen, Qian, Deng and Zhang2012). In addition, increased temperature also delayed the first frost in autumn, thus prolonging the potential growing season (Chen et al. Reference Chen, Lei, Deng, Qian, Hoogmoed and Zhang2011; Li et al. Reference Li, Yang, Tang, Wu, Chen, Zhou, Zou and Zhang2011). Therefore, the increasing temperature provided warmer sowing and harvest conditions in NFR, which could be beneficial for crop production. The present results show that the thermal time increased significantly in both pre-flowering and post-flowering phases of maize, rice and soybean in most parts of NFR within the identified growth phases, which means that crop varieties with longer growing seasons can now be cultivated in a larger area of NFR (Chen et al. Reference Chen, Qian, Deng and Zhang2012; Zhang et al. Reference Zhang, Chen, Xu, Chen, Deng, Qian and Dong2012; Liu et al. Reference Liu, Yang, Chen and Wang2013b ). However, the changes in length of actual crop growth duration are not the same as the changes in thermal time. The observed sowing dates of crops advanced (i.e. happened earlier) in few stations during the 1981–2010 period; however, the sowing dates of maize and soybean were significantly delayed for most stations. This is because the actual sowing date was not only affected by temperature, but also influenced by crop variety, management and other climatic conditions, such as precipitation (Tao et al. Reference Tao, Zhang, Shi, Liu, Xiao, Zhang, Zhu, Wang and Liu2013, Reference Tao, Zhang, Zhang and Rötter2014). The increased temperature should lead to earlier flowering and maturity through accelerating crop development; however, the flowering dates for maize, rice and soybean showed a trend towards being delayed, while the maturity date was also delayed, particularly for maize and rice. It seems that changes of crop varieties and management have counteracted the effects of general changes in temperature. The present results show that the actual length of the crop growing season of maize, rice and soybean did not change much during the 1981–2010 period, even though thermal time increased during the same period in each crop growing season.
The significant increase in thermal time during the pre-flowering phase of wheat indicates that increasing temperature should also be beneficial for wheat sowing in NFR. However, since spring wheat prefers cool environments, the significant increase in thermal time in most parts of NFR during the flowering phase of wheat should accelerate wheat development, thus negatively affecting wheat yield through shortening the crop life-cycle.
Effects of minimum temperature on crop yield
The present results show that minimum temperature increased significantly in all growth phases of all four crops, especially in the pre-flowering phase. Statistical analyses showed that higher minimum temperature in all growth phases is beneficial for rice yield, especially for the pre-flowering and post-flowering phases. Tao et al. (Reference Tao, Yokozawa, Liu and Zhang2008) also reported that rice yields in NFR increased 4·5–14·6% per °C in response to an increase in minimum temperature. The present results also indicated that maize and soybean yield would benefit from higher minimum temperatures, particularly in the pre-flowering and flowering phases, which is in agreement with previous studies (Chen et al. Reference Chen, Lei, Deng, Qian, Hoogmoed and Zhang2011, Reference Chen, Qian, Deng and Zhang2012). Increased minimum temperature during the pre-flowering phase will be beneficial for germination, emergence and seedling growth, while the increase of minimum temperature in the flowering phase will be beneficial for pollination and higher minimum temperature in the post-flowering phase will provide better conditions for grain filling, which helps to avoid the chilling stress caused by early frost (Chen et al. Reference Chen, Lei, Deng, Qian, Hoogmoed and Zhang2011; Sun & Huang Reference Sun and Huang2011; Yuan et al. Reference Yuan, Guo, Ye and Zhao2012). However, there is some indication that an increase of minimum temperature in the flowering phase would have negative effects on wheat yield, which indicates that spring wheat is sensitive to warmer conditions in the flowering phase.
Influence of solar radiation on crop yield
Solar radiation decreased over time in all crop growth phases, in line with other studies showing decreasing sunshine hours in NFR (Jia & Guo Reference Jia and Guo2011). Surprisingly, even considered together with other climatic factors, solar radiation in the flowering phase still had negative effects on rice yield. The positive effect of solar radiation is linked to its effects on crop photosynthesis and net assimilation (Trnka et al. Reference Trnka, Rötter, Ruiz-ramos, Kersebaum, Olesen, Žalud and Semenov2014). Higher solar radiation correlates with high temperature, which may reduce the length of critical periods, such as flowering. In addition, solar radiation may increase canopy temperature, thus reducing yield through decreased assimilation.
Impacts of aridity on crop yield
Most studies have shown a decline in precipitation over time during the crop growing season in NFR (Chen et al. Reference Chen, Lei, Deng, Qian, Hoogmoed and Zhang2011; Jia & Guo Reference Jia and Guo2011). However, in the present study no significant change in precipitation was found in the pre-flowering and flowering phases for all four crops; however there was a tendency to decrease in the post-flowering phase of rice, soybean and wheat. Although aridity did not show any significant trend over time, it was much higher for the pre-flowering compared with the other two phases (Fig. 3S, available from http://journals.cambridge.org/AGS). Drought in the pre-flowering phase can damage crop establishment and thus reduce subsequent yield potential (Ma et al. Reference Ma, Wang, Zhang, Yu, Xu and Ji2014), while water deficit in the pre-flowering phase can accelerate crop development thus shortening the growing season, and drought in the late pre-flowering and early flowering phase may influence grain setting, leading to considerable yield loss (Muchow & Carberry Reference Muchow and Carberry1989; Ji et al. Reference Ji, Che, Zhu, Liang, Feng, Yu and Zhang2012). However, a significant positive effect of aridity was found in the pre-flowering phase for rice, which may be because rice is always irrigated in NFR. Dry conditions in the pre-flowering phases would to some extent be beneficial for rice cultivation, because dry periods are associated with more sunshine and provide less favourable conditions for many fungal diseases. The interactions between aridity in the flowering phase and that in the post-flowering phase can represent the effects of aridity in the reproduction period on crop yield; the present results showed that rice and wheat are both highly affected by drought risk at this time. Aridity in the post-flowering phase also damaged soybean yield. This is because the crop is very sensitive to water deficit in the flowering and post-flowering phases, and drought would decrease pollination and also affect photosynthesis and grain filling, resulting in considerable yield loss (Çakir Reference Çakir2004; Ji et al. Reference Ji, Che, Zhu, Liang, Feng, Yu and Zhang2012). For maize and soybean, interactions between aridity in the pre-flowering and in the flowering phases are the most damaging for yield, indicating that these crops are most sensitive to drought in the growth phases up to and including flowering.
Impacts of HDD on crop yield
Even though the mean minimum temperature was lowest in the pre-flowering phase for all crops, HDD was the highest in this phase. This is because the pre-flowering phase was considerably longer than the flowering and post-flowering phases, especially for maize, rice and soybean (Fig. 4S, available from http://journals.cambridge.org/AGS).
The present results indicate that higher HDD especially in the post-flowering phase, caused yield loss in maize. Similar results have been reported for Africa, France and the USA (Lobell et al. Reference Lobell, Bänziger, Magorokosho and Vivek2011, Reference Lobell, Hammer, McLean, Messina, Roberts and Schlenker2013; Hawkins et al. Reference Hawkins, Fricker, Challinor, Ferro, Ho and Osborne2013). Previous studies also reported that temperature above 30 °C increasingly damages cell division and amyloplast replication in maize kernels, and thus reduced grain sink strength and yield (Commuri & Jones Reference Commuri and Jones2001; Tubiello et al. Reference Tubiello, Soussana and Howden2007). Heat stress damage could be particularly severe when high temperature occurs at critical crop development stages, particularly in the reproduction stage (Teixeira et al. Reference Teixeira, Fischer, van Velthuizen, Walter and Ewert2013). In general, HDD would shorten the crop life-cycle, hasten senescence and reduce the length of the growing season, thus leading to yield loss (Porter Reference Porter2005). It also enhances drought stress through greater evapotranspiration caused by the greater vapour pressure deficit at higher maximum temperatures. Higher HDD would increase demand for soil water to sustain assimilation and with constraints on soil water supply, thus reduce crop yield (Lobell et al. Reference Lobell, Hammer, McLean, Messina, Roberts and Schlenker2013).
Similarly, the present study found that HDD had significant negative effects on soybean yield, in particular in the flowering and post-flowering phases, which is in line with Zheng et al. (Reference Zheng, Chen and Han2009) who also showed negative effects of higher maximum temperature on soybean yield in NFR. Similar observations were made by Schlenker & Roberts (Reference Schlenker and Roberts2009) in the USA. A previous study in soybean also indicated that the pre-flowering phase was tolerant of high temperature, but that reproductive growth failed at high temperatures, and the grain yield and harvest index declined as mean temperature exceeds 26 °C (Boote et al. Reference Boote, Allen, Prasad, Baker, Gesch, Snyder, Pan and Thomas2005). Furthermore, Salem et al. (Reference Salem, Kakani, Koti and Reddy2007) examined the growth of soybean under two temperature regimes (38/30 v. 30/22 °C) and found that the increased temperature reduced pollen production by 34%, pollen germination by 56% and pollen tube elongation by 33%.
The present results indicated that maximum temperatures in excess of 30 °C (HDD) would lead to rice yield loss in NFR in the pre-flowering phase. It has been reported that rice is most sensitive to high temperature at the heading stage, and at about 9 days before heading, which was observed in the pre-flowering and flowering phases by Yoshida (Reference Yoshida1981). In contrast, the present study found that higher HDD was associated with greater rice yield in the post-flowering phase, which means that higher maximum temperature above 30 °C in the post-flowering phase would not damage rice yield in NFR. This is in agreement with observations by Sun & Huang (Reference Sun and Huang2011).
Previous studies reported that higher temperature around flowering would damage seed setting and thus affect reproductive growth in spring wheat in NFR (Ju et al. Reference Ju, Xiong, Xu and Lin2005, Reference Ju, Xiong and Xu2008). This was also reported by other studies where high temperatures around or after flowering would lead to large reductions in wheat yield (Semenov & Shewry Reference Semenov and Shewry2011; Asseng et al. Reference Asseng, Foster and Turner2011, Reference Asseng, Ewert, Martre, Rötter, Lobell, Cammarano, Kimball, Ottman, Wall, White, Reynolds, Alderman, Prasad, Aggarwal, Anothai, Basso, Biernath, Challinor, De Sanctis, Doltra, Fereres, Garcia-Vila, Gayler, Hoogenboom, Hunt, Izaurralde, Jabloun, Jones, Kersebaum, Koehler, Müller, Naresh Kumar, Nendel, O'Leary, Olesen, Palosuo, Priesack, Eyshi Rezaei, Ruane, Semenov, Shcherbak, Stöckle, Stratonovitch, Streck, Supit, Tao, Thorburn, Waha, Wang, Wallach, Wolf, Zhao and Zhu2015; Lobell et al. Reference Lobell, Sibley and Ortiz-Monasterio2012; Liu et al. Reference Liu, Liu, Tian, Cao, Zhu and Asseng2014; Vignjevic et al. Reference Vignjevic, Wang, Olesen and Wollenweber2015). In contrast to other crops, the effects of higher temperature are negative for wheat, particularly in the flowering phase. Therefore, the observed warming trends during the last 50 years would have influenced wheat yield in NFR. Although correlations between HDD and wheat yield were not significant in each growth phase, Fig. 4S (available from http://journals.cambridge.org/AGS) shows that the average HDD was extremely high in each growth phase, and it increased significantly in the pre-flowering phase.
Implications
There was a considerable increase in yield over time related to improved varieties, higher inputs and better technology. However, this trend may potentially interact with changes in climatic conditions. Thus, there has been a change in varieties of maize towards varieties adapted for a longer growing season (Tao et al. Reference Tao, Zhang, Zhang and Rötter2014), which probably determines some of the temperature responses observed. Occurrence of drought also interacts with crop management, since increased fertilization will enhance the size of the canopy leading to higher water consumption, which then increases susceptibility to drought and high temperatures as shown by Liu et al. (Reference Liu, Hu, Olesen, Ju, Yang and Zhang2013a ). Such interactions need to be further explored to better understand climate effects under different crop management.
The present results show that higher minimum temperature will be beneficial for maize, rice and soybean production, and drought risk and heat stress will damage all four crops studied in the future. Therefore, adaptation measures should be considered to cope with projected climate change, such as changing cultivation dates and using longer-season varieties, which are suggested means of adaptation against global warming (Chen et al. Reference Chen, Lei, Deng, Qian, Hoogmoed and Zhang2011, Reference Chen, Qian, Deng and Zhang2012; Liu et al. Reference Liu, Yang, Hubbard and Lin2012). More irrigation and drainage systems are also needed, and crop varieties with drought tolerance should be adopted to cope with increasing frequency of drought events. New varieties with higher heat tolerance and better crop management have been suggested as adaptation measures to cope with increasing heat stress under future climate change in previous studies (Challinor et al. Reference Challinor, Wheeler, Craufurd, Ferro and Stephenson2007; Luo Reference Luo2011; Olesen et al. Reference Olesen, Trnka, Kersebaum, Skjelvåg, Seguin, Peltonen-Sainio, Rossi, Kozyra and Micale2011; Zheng et al. Reference Zheng, Chenu, Dreccer and Chapman2012a ; Liu et al. Reference Liu, Liu, Tian, Cao, Zhu and Asseng2014; Sánchez et al. Reference Sánchez, Rasmussen and Porter2014). These options would also be relevant in NFR where heat stress already occurs in the flowering phase for most crops.
This study was financially supported by the Ministry of Agriculture of China (Special Fund for Agro-scientific Research in the Public Interest: Grant No. 201103001) and the Ministry of Science and Technology of China (National Basic Research Program of China: Grant No. 2010CB951502). Support by FACCE MACSUR project funded by the Danish Innovation Foundation (contract 0603-00507B) is gratefully acknowledged.
The supplementary material for this paper can be found at http://dx.doi.org/10.1017/S0021859616000149