INTRODUCTION
Since the first studies of DiSalvo (Reference DiSalvo1971) and Sorokin (Reference Sorokin1973), corals are known to be associated to a dynamic microbiota (Herndl & Velimiroz, Reference Herndl and Velimiroz1986; Ritchie & Smith, Reference Ritchie, Smith, Lessios and Macintyre1997; Rohwer et al., Reference Rohwer, Breitbart, Jara, Azam and Knowlton2001). The mucus layer, in particular, which is a carbon-rich compound, is an important substrate for bacterial growth (Ferrier-Pagès et al., Reference Ferrier-Pagès, Leclercq, Jaubert and Pelegri2000; Brown & Bythell, Reference Brown and Bythell2005). Nowadays, there is an increasing interest for coral-associated microbes, because corals are more and more threatened by environmental changes and pollution, which induce bacteria-mediated diseases (Harvell et al., Reference Harvell, Kim, Burkholder, Colwell, Epstein, Grimes, Hofmann, Lipp, Osterhaus, Overstreet, Porter, Smith and Vasta1999).
A lot of studies have therefore examined pathogenic bacteria, in order to identify microbes involved in diseases (Frias-Lopez et al., Reference Frias-Lopez, Zerkle, Bonheyo and Fouke2002; Pantos et al., Reference Pantos, Cooney, Tissier, Barer, O'Donnell and Bythell2003; Bourne, Reference Bourne2005). Conversely, marine microbial systems associated with healthy corals have been poorly characterized (Rohwer et al., Reference Rohwer, Breitbart, Jara, Azam and Knowlton2001, Reference Rohwer, Seguritan, Azam and Knowlton2002; Frias-Lopez et al., Reference Frias-Lopez, Zerkle, Bonheyo and Fouke2002; Bourne & Munn, Reference Bourne and Munn2005), especially because culture-independent techniques (e.g. PCR, DGGE, ARISA and TRFLP) have not been employed until recently. However, more than 400 bacterial ribotypes, most of them observed only once, were found in 14 coral samples from Bermuda and Panama (Rohwer et al., Reference Rohwer, Seguritan, Azam and Knowlton2002). Some studies have suggested that corals might host specific bacteria, different from those living in the surrounding seawater or on biofilms associated to rocks (Frias-Lopez et al., Reference Frias-Lopez, Zerkle, Bonheyo and Fouke2002). Coral–bacterial associations were even found to be maintained across distant locations, such as the PA1 gamma-proteobacterium detected on Porites spp. from Panama and Bermuda (Rohwer et al., Reference Rohwer, Seguritan, Azam and Knowlton2002). Microbes were suggested to have several roles, such as nitrogen fixation (Williams et al., Reference Williams, Viner and Broughton1987; Shashar et al., Reference Shashar, Cohen, Loya and Sar1994; Rohwer et al., Reference Rohwer, Seguritan, Azam and Knowlton2002), antibiotic production (Ritchie, Reference Ritchie2006), mucus recycling and food supply (Ferrier-Pagès et al., Reference Ferrier-Pagès, Leclercq, Jaubert and Pelegri2000). In addition, it has also been shown that bacterial composition might strongly be influenced by external factors, such as the distance to coastal pollution (Klaus et al., Reference Klaus, Janse, Heikoop, Sanford and Fouke2007), or seasonal changes in the seawater physico-chemical parameters (Hong et al., Reference Hong, Yu, Chen, Chiang and Tang2009). Garren et al. (Reference Garren, Smriga and Azam2008) suggested some interaction between seawater microbial communities and coral-associated communities along a trophic gradient in Philippines waters. However, the relative impact of species specificity and environmental factors vary widely among coral species and is difficult to assess due to a high number of changing parameters (Hong et al., Reference Hong, Yu, Chen, Chiang and Tang2009; Littman et al., Reference Littman, Willis, Pfeffer and Bourne2009).
Most of the above studies performed on coral–bacterial associations are in situ studies, collecting corals and comparing/analysing the associated microbial diversity. Information on the temporal and spatial variations in the composition of bacterial communities is therefore accumulating, but remains insufficient. We can get another view of the functioning of the system, by analysing it under experimental conditions, where only one factor can be tested at a time. Even if bacterial diversity under these conditions may not reflect the true diversity, found on in situ corals (Kooperman et al., Reference Kooperman, Ben-Dove, Kramarsky-Winter, Barak and Kushmaro2007), it allows gaining further understanding on how the coral–microbe association can be affected by the environment (Ferguson et al., Reference Ferguson, Buckley and Palumbo1984). Moreover, results from the analyses of microbes associated to cultured corals can be a helpful indicator of coral health, during coral aquaculture and transplantation.
In this paper, we therefore analysed the bacterial community composition of three scleractinian coral species Galaxea fascicularis (Linnaeus, 1767), Pavona cactus (Forskål, 1775) and Turbinaria reniformis Bernard 1896, maintained in the laboratory under different culture conditions. In a first experiment, several colonies of the three coral species were maintained all together in the same aquarium without seawater renewal for three days. At the end of the incubation, the bacterial community composition of the tissue and skeleton of each coral species were analysed. The amount of dissolved organic carbon (DOC) excreted by each species, as well as the glycoconjugate composition of their mucus, were also assessed. The aims were to highlight: (1) intra or inter-species variability in the bacterial community composition; (2) differences in this composition between seawater and corals, or between coral tissue and skeleton; and (3) the relationship between bacterial community composition and mucus composition or DOC production. A second experiment tested the ‘tank effect’, to know if the bacterial community associated to the tissue of one coral species was conserved in replicated aquaria. A third experiment finally tested the effect of water renewal on the bacterial community composition of the three coral species, by comparing this composition in corals incubated either in a closed or an open system.
MATERIALS AND METHODS
DOC excretion and mucus composition
Release rates of DOC were assessed for the three coral species studied: Galaxea fascicularis, Pavona cactus and Turbinaria reniformis, originating from the Red Sea and maintained for several months in the aquaria of the Centre Scientifique de Monaco. For each species, three different colonies, with no apparent skeleton, were individually incubated during 5 hours in beakers filled with 0.45 µm filtered seawater, continuously stirred using a magnetic stirrer. Three additional beakers, without any coral colonies, served as controls, and were incubated under the same conditions. Beakers were maintained in a thermostat-controlled bath, heated to 26.0°C ± 0.5°C and under an irradiance of ~150 µmol photons m−2 s−1. At the end of the 5 hours incubation, 15 ml seawater samples were collected in combusted (450°C for 4 hours) glass tubes, preserved with 20 µl 85% phosphoric acid (H3PO4) and stored in the dark at 4°C. DOC concentrations were measured by high temperature oxidation with a Shimadzu TOC-Vcph analyser, using potassium phthalate calibration standards. Certified reference materials (Hansell Laboratory, University of Miami) were also used to assess the performance of the machine. DOC release rates were obtained by subtracting the amount of carbon measured in the control beakers (natural organic carbon content of the seawater) from the total amount of carbon measured in the beakers containing coral colonies. These rates were normalized either to the surface area, measured using the wax technique (Stimson & Kinzie, Reference Stimson and Kinzie1991), or to the protein content of the coral tissue, which is a more reliable standardization parameter in this experiment, since the coral species had different tissue amounts above the skeleton. Proteins were extracted at 90°C in 1 N NaOH for 30 minutes and measured using the BC Assay Kit (Interchim, Montluçon, France) (Smith et al., Reference Smith, Khrohn, Hermanson, Malia, Gartner, Provenzano, Fujimoto, Goeke, Olson and Klenk1985). The standard curve was established using bovine serum albumin and the absorbance was measured with a multiscan bichromatic spectrophotometer (Labsystem, Helsinki, Finland).
For the analysis of the glycoconjugate composition of the mucus, a large amount of mucus was needed. Thus, the three parent colonies from each species were suspended upside down above a beaker. The mucus obtained was transferred during 24 hours in a Spectra/Por 3 dialysis membrane (Spectrum Laboratories, Inc., Breda, The Netherlands) incubated into 5 l distilled seawater for desalting. The mucus was then freeze-dried and its composition in glycoconjugate was analysed by gas chromatography after methanolysis as heptafluoro-butyrate derivatives (Zanetta et al., Reference Zanetta, Timmerman and Leroy1999).
Experiments designed to assess the bacterial community composition associated to the three coral species
All experiments were carried out with nubbins (2 cm long and 1 cm large) prepared from different parent colonies of the three coral species and maintained under the same culture conditions. Nubbins were used only when the tissue entirely covered the skeleton. Light was provided by 400 watts HQI metal halide lamps and was set up to ~150 µmol photons m−2 s−1 (12:12 photoperiod). Tanks (32 l) were continuously supplied (at a rate of 2 l per hour) with unfiltered natural seawater pumped at 50 m depth and heated to 26.0°C ± 0.5°C using heaters connected to electronic controllers. This water had low nutrient and chlorophyll concentrations (Ferrier-Pagès et al., Reference Ferrier-Pagès, Leclercq, Jaubert and Pelegri2000).
The first experiment was designed to compare the bacterial community composition between and within species, between corals and seawater, or between coral tissue and skeleton. Six nubbins from three colonies (two nubbins per parent colony) of G. fascicularis, P. cactus and T. reniformis were prepared and incubated during three weeks in a 32 l tank under the above described conditions. Seawater renewal was then shut down during three days. All nubbins were then rinsed with 0.22 µm filtered and autoclaved seawater to remove any loosely-associated microbes, placed in a sterile bag, frozen in liquid nitrogen and kept at −80°C until extraction (see below). Three 1 l seawater samples were filtered through 0.22 µm nitrocellulose membranes (47 mm diameter, # GSWP04700, Millipore, Saint-Quentin-en-Yvelines, France) and were kept frozen at −80°C until analysis.
The second experiment tested the ‘tank effect’ on the bacterial community composition of the coral tissue, i.e. does the bacterial community of a given species change when corals are incubated in different tanks? Six nubbins were therefore prepared from three colonies (two nubbins per parent colony) of G. fascicularis and P. cactus and divided into two 32 l tanks (hereafter called Tank 1 and Tank 2). Nubbins were maintained three weeks under these conditions, before the seawater renewal was shut down during three days. Then, all nubbins were processed as described above. Two samples of 1 l seawater were also taken in each tank and treated as described below.
The third experiment tested the effect of seawater renewal rate on the bacterial community composition of the coral tissue. For this purpose, 11 nubbins were prepared for each species, from three parent colonies. They were then divided into two 32 l tanks (hereafter called open tank and close tank), and maintained as described above. The open tank contained six nubbins from each coral species and the close tank contained five nubbins. In the open tank, seawater was continuously renewed (at a rate of 2 l per hour) whereas seawater was shut down in the close tank. After three days under these conditions, nubbins, as well three seawater samples, were taken from each tank, and processed as described above.
DNA extraction, DGGE gels and sequencing
Total DNA was extracted from the coral samples using the Ultra Clean Soil DNA Kit (Mo Bio, Carlsbad, CA, USA), as described by Rohwer et al. (Reference Rohwer, Breitbart, Jara, Azam and Knowlton2001). Corals were airbrushed to collect the tissue, mucus and associated microbes using the extraction solution of the Ultra Clean Soil DNA Kit. Total DNA was then extracted as recommended by the manufacturer. For the first experiment, the skeleton was thoroughly washed in 0.22 µm filtered and autoclaved seawater, and ground in 200 µl TE buffer (40 mM Tris, 10 mM EDTA) with a sterile pestle and mortar. Total DNA from the skeleton powder was prepared as described above. Seawater filters were sectioned into quarters with flame-sterilized scissors and forceps, and DNA was extracted using the Ultra Clean Soil DNA Kit according to the manufacturer's instructions.
Optimization of PCR was performed for each sample by adjusting the amount of DNA in order to obtain a strong band on the agarose gel, without having non-specific products. Bacterial 16S rRNA was amplified using a Mastercycler gradient thermocycler and a nested PCR using the following procedure. The first PCR round was performed using the 27F bacterial-specific primer (5′–AGAGTTTGATCCTGGCTCAG–3′) and the 1492R universal primer (5′–GGTTACCTTGTTACGACTT–3′) (Lane, Reference Lane, Stackebrandt and Goodfellow1991) as follows: 1 to 2 µl of template, 0.5 µM of each primer, 1X Taq PCR Master Mix (Qiagen, Courtaboeuf, France) and the final volume was adjusted with sterile water at 25 µl. The cycles were as follow: 5 minutes at 94°C, followed by 20 cycles of: 30 seconds at 94°C, 1 minute at 56.6°C, 1 minute 30 seconds at 72°C and 7 minutes at 72°C. A positive and a negative control were also performed. The second PCR round was carried out according to Schäfer & Muyzer (Reference Schäfer, Muyzer and Paul2001) except that the extension time was reduced to one minute using the primers 341F–GC/907R. The first round products were diluted for the second round by 10 to 1000 fold for the tissue and skeleton and by up to 106 for water in 50 µl PCR reaction.
Denaturing gradient gel electrophoresis (DGGE) was performed following Schäfer & Muyzer (Reference Schäfer, Muyzer and Paul2001). PCR products were separated into bands by electrophoresis using an INGENYphorU DNA Mutation Detection System (Ingeny International, Goes, The Netherlands). The system was run during 18 hours at 100 V on 6% acrylamide gels prepared using a denaturing gradient from 30 to 70% (urea and formamide). A ladder of molecular mass standards (EasyLadder I; BioLine, London, UK) was used to assess the PCR product amounts. DGGE gels were stained with 10X SYBR Gold (# S11494, Molecular Probes, Cergy Pontoise, France) and photographed with a gel documentation system GelDoc EQ (Bio-Rad, Hercules, CA, USA). Analysis of band patterns was performed with the Quantity One Software (Bio-Rad, Hercules, CA, USA). The use of three standard samples per gel allowed the comparison of bands between gels.
For the first experiment only, the main bands on the DGGE gels were sequenced. For this purpose, the bands were excised using sterile blades, and DNA was eluted overnight at 4°C in RNAse-free H2O. This nucleic acid solution was diluted 102 to 105 fold and was amplified (5 minutes at 95°C, 30 cycles of: 30 seconds at 94°C, 1 minute at 56°C, 1 minute at 72°C and 10 minutes at 72°C) with the primers 341F–GC/907R. PCR products were purified with PCR clean-up NucleoSpin Extract II (Macherey-Nagel, Hoerdt, France). Sequencing was performed by MWG-Biotech (Ebersberg, Germany) using the primer 907R. The 16S rDNA sequences were then compared with those in the GenBank database with the basic alignment search tool (BLAST, http://blast.ncbi.nlm.nih.gov/Blast.cgi) network service. The NCBI environmental samples database was used. The submission of sequence to the GenBank was performed using Sequin and the accession numbers generated are EU847587 through to EU847611.
Statistics
Statistics were performed using Sas 9.1.3. Results from each species were expressed as mean ± standard error. DOC release rates were tested using a one-way analysis of variance (ANOVA). To test the bacterial community composition in the different situations, only DGGE bands with intensities >3.5% were kept in the analysis. The differences in bacterial community composition between species, compartments (skeleton and tissue) or tanks were tested using parametric factorial ANOVAs and the effect of seawater renewal rate was tested using a non-parametric Sheirer–Ray–Hare test. Data were checked for normality using a Shapiro–Wilk test. When normality was not fulfilled, data were log-transformed (e.g. DOC release transformed in ln) or a non-parametric test was used. Differences between factors were considered significant for a P value < 0.05. The P value for the Sheirer–Ray–Hare test was calculated with the NCSS Probability Calculator 6.0. To compare bacterial community compositions, similarity matrices of Bray–Curtis were constructed from percentage band intensities (Fromin et al., Reference Fromin, Hamelin, Tarnawski, Roesti, Jourdain-Miserez, Forestier, Teyssier-Cuvelle, Gillet, Aragno and Rossi2002). Cluster analyses using an unweighted-pair group average (UPGMA) were used to determine the relationship among samples.
RESULTS
DOC release and mucus composition in glycoconjugates
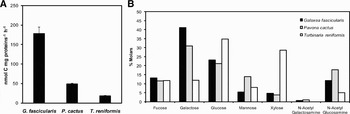
Dissolved organic carbon release rate, normalized per mg of protein, was significantly different for the three coral species (ANOVA, P < 0.0001). It was at least three times higher in Galaxea fascicularis (178.2 ± 17.4 nmol C mg protein−1 h−1) than in the two other species, and twice higher in Pavona cactus (48.4 ± 3.3 nmol C mg protein−1 h−1) than in Turbinaria reniformis (18.4 ± 1.4 nmol C mg protein−1 h−1) (Figure 1A). When normalized to the surface area, release rates were equal to 820.6 ± 174.2, 149.3 ± 13.9, and 112.2 ± 8.1 nmol C cm−2 h−1 or 9.8 ± 2.1, 1.8 ± 0.2 and 1.3 ± 0.1 µg C cm−2 h−1 for G. fascicularis, P. cactus and T. reniformis respectively. Concerning the composition of the mucus (Figure 1B), it mainly contained galactose and glucose for G. fascicularis and P. cactus, and glucose and xylose for T. reniformis.
(A) Amount of dissolved organic carbon excreted (nmol C mg protein−1 h−1) by the three coral species (Galaxea fascicularis, Pavona cactus and Turbinaria reniformis). Mean (N = 3) and standard error. Data normalized to the surface area conserved the same differences between species; (B) glycoconjugates produced by the three coral species Galaxea fascicularis, Pavona cactus and Turbinaria reniformis. Data are expressed in % molars of total glycoconjugate composition.

Bacterial community composition associated with the coral tissue and skeleton
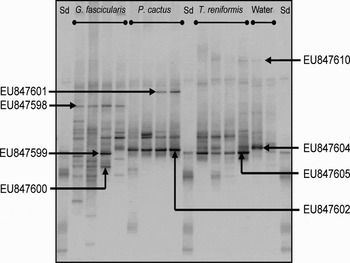
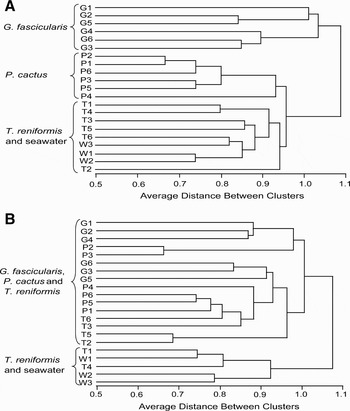
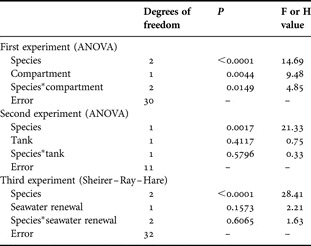
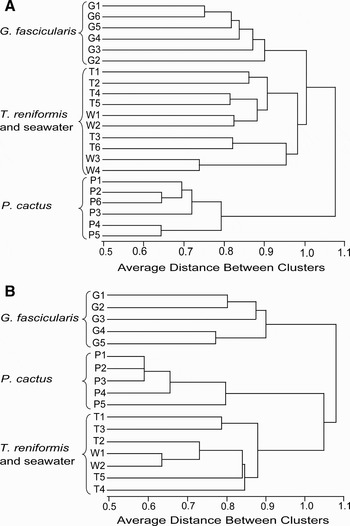
Concerning the first experiment, an example of a DGGE gel obtained with tissue samples is represented in Figure 2. There were between 4.7 ± 0.3 and 11.2 ± 0.9 bands detected according to the species and the compartment considered. The tissue and skeleton of G. fascicularis both presented the highest number of bands (11.2 ± 0.9 and 10.8 ± 0.7 respectively). Pavona cactus was the species with the lowest number of bands obtained both in the tissue (4.8 ± 0.3) and the skeleton (9.2 ± 1.2). Finally, only 4.7 ± 0.3 bands were detected in seawater, due to the closure of the system. Results of the factorial ANOVA showed a significant interaction between species and compartments (i.e. mucus/tissue and skeleton) (Table 1). The cluster analysis for the bacterial community composition associated with the corals tissue showed two main groups (Figure 3A). The first group was represented by G. fascicularis nubbins only. The second group included three sub-groups, the first one only containing nubbins of P. cactus, the second one containing nubbins of T. reniformis and seawater samples. One sample of T. reniformis constituted a group by itself. The cluster analysis of the bacterial community composition associated with the corals skeleton showed two groups. The first group represented nubbins from the three species mixed all together, including all G. fascicularis and P. cactus samples. The second group included all water samples and two replicates of T. reniformis (Figure 3B).
Example of denaturing gradient gel electrophoresis bacterial band pattern obtained for coral tissue and seawater. The main bands obtained in all samples from the same coral species or from seawater have been sequenced and identified.

(A) Cluster analysis (UPGMA) performed with (A) bacterial skeleton samples and (B) of the three species, Galaxea fascicularis, Pavona cactus, Turbinaria reniformis and the seawater in close system. Six nubbins from three parent colonies were used for each coral species and seawater samples were considered in triplicate. On the graph, G, P, T and W represent the G. fascicularis, P. cactus, T. reniformis and seawater samples. G1 to G6 represent the six replicates of G. fascicularis.

Results of the factorial analysis of variance (ANOVA) and the Sheirer–Ray–Hare test for number of bands detected with two factors.

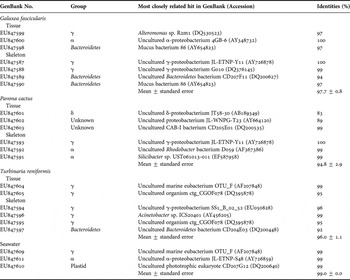
During this experiment, the most intense DGGE bands obtained for the corals tissue, corals skeleton and seawater samples were sequenced (Table 2). The range of similarity between the non-cultured bacteria observed in this study with known bacteria varied between 83% and 100% with a mean (±standard error) of 97.7 ± 0.8% for G. fascicularis, 94.8 ± 2.9% for P. cactus, 96.0 ± 1.1% for T. reniformis and 98.0 ± 0.0% for the seawater. Bacteria with a 16S rDNA similarity <98% with other bacteria are often considered to be different species and those with ≤90% homology are considered different genera (Stackebrandt & Ebers, Reference Stackebrandt and Ebers2006). Five of the eight 16S rDNA sequences retrieved from the tissue of the three coral species and five of the 11 sequences retrieved from the skeleton were novel phylotypes. In the tissue samples, among the five novel phylotypes, two proteobacteria sequences isolated from P. cactus were new genera (Table 2). Gamma-proteobacteria were found in all coral species and seawater samples except in the tissue of P. cactus. Turbinaria reniformis was lacking alpha-proteobacteria while P. cactus and seawater were lacking Bacteroidetes. Delta-proteobacteria were observed only in the tissue of P. cactus (Table 2). Some bacterial species were responsible for the main bands observed in the DGGE gels (as in Figure 2) and were specific to one coral species: the EU847598 (related to mucus bacterium 86) was specific to the tissue and skeleton of G. fascicularis, the EU847602 (related to uncultured proteobacterium JL-WNPG-T23) was specific to the tissue of P. cactus and the EU847605 (related to uncultured organism ctg_CGOF078) to the tissue and skeleton of T. reniformis (Table 2).
16S rDNA sequences of bacteria isolated from the tissue and skeleton of three coral species (Galaxea fascicularis, Pavona cactus and Turbinaria reniformis) and seawater. Bands were excised from denaturing gradient gel electrophoresis gels and sequenced.

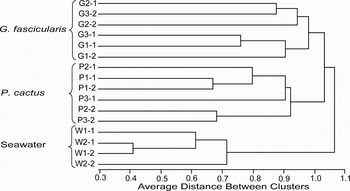
In the second experiment, testing the ‘tank effect’ on the bacterial composition of the tissue samples of G. fascicularis and P. cactus, there were between 4.7 ± 0.3 and 11.0 ± 1.5 bands detected according to the species and the tanks. The same pattern as described previously in the first experiment was observed. Seawater samples presented 6 bands. Results of the factorial ANOVA on this parameter did not show any tank effect (Table 1). The cluster analysis (Figure 4) clearly showed three groups: the first group was represented by all nubbins of G. fascicularis, either sampled in Tank 1 or Tank 2, while the second group was represented by all nubbins of P. cactus sampled in Tank 1 or tank 2 and the third group gathered seawater samples from both tanks.
Cluster analysis (UPGMA) performed with bacterial tissue samples of the two species, Galaxea fascicularis, Pavona cactus and the seawater. Three nubbins per tank (and two tanks) in close system were used for each coral species and seawater samples were considered in duplicate for each tank. On the graph, G, P and W represent the G. fascicularis, P. cactus and seawater samples. G1-1 to G3-1 represent the three replicates of G. fascicularis incubated in the Tank 1 and G1-2 to G3-2 represent the three replicates of G. fascicularis incubated in the Tank 2.

Finally, results from the third experiment, testing the effect of seawater renewal rate on the bacterial community composition associated to the coral tissue, are represented in Figure 5A for the open tank and Figure 5B for the close tank. The number of detectable bands ranged between 4.4 ± 0.2 and 14.3 ± 1.2. Galaxea fascicularis was the species that presented the highest number of bands in the open (14.3 ± 1.2) and in the close system (13.8 ± 1.2). Pavona cactus was the species with the lowest number of bands in the open (5.7 ± 0.3) and in the close system (4.4 ± 0.2). Finally, T. reniformis (10.3 ± 0.7 in open system and 6.2 ± 0.7 in close system) and seawater samples (13.3 ± 0.6 in open system and 6.5 ± 0.5 in close system) presented a different number of bands according to the seawater renewal. Results of the Sheirer–Ray–Hare test showed that seawater renewal rate did not have any effect on the bacterial community composition (Table 1). For both tanks, maintained under a close or open system, results of the cluster analyses were comparable to the results of the first and second experiment.
(A) Cluster analysis (UPGMA) performed with (A) bacterial tissue samples of the three species, Galaxea fascicularis, Pavona cactus, Turbinaria reniformis and the seawater in open system. Six nubbins from three parent colonies were used for each coral species and seawater samples were considered in four replicates. On the graph, G, P, T and W represent the G. fascicularis, P. cactus, T. reniformis and seawater samples. G1 to G6 represent the six replicates of G. fascicularis; (B) cluster analysis (UPGMA) performed with bacterial tissue samples of the three species and the seawater in close system. Five nubbins from three parent colonies were used for each coral species and seawater samples were considered in duplicate. G1 to G5 represent the five replicates of G. fascicularis.

DISCUSSION
This experimental study shows that the bacterial community associated to the coral tissue/mucus can be specific to each species, even under different culture conditions. Even if the bacterial community composition is different between laboratory and in situ conditions, and can change from one environment to the other (Kooperman et al., Reference Kooperman, Ben-Dove, Kramarsky-Winter, Barak and Kushmaro2007), or between experimental and natural reef conditions (Ainsworth & Hoegh-Guldberg, Reference Ainsworth and Hoegh-Guldberg2009), this study shows that it will change differently according to the coral species considered or compared to the seawater bacterial community. The DGGE was used here to assess differences between coral compartments and species, and was not used to investigate the ‘true’ diversity which is rather obtained using labour-intensive methods such as pyrosequencing or intense cloning (Curtis et al., Reference Curtis, Sloan and Scannell2002; Sogin et al., Reference Sogin, Morrison, Huber, Welch, Huse, Neal, Arrieta and Herndl2006). Therefore, the chance to discover rare phylotypes, which can play a significant ecological role, has shown to be quite small—but not absent—and, we do not know whether they are different between coral compartments and species. The following discussion will, therefore, likely deal with the comparatively abundant phylotypes.
Analyses of DGGE profiles obtained for the three coral species, Galaxea fascicularis, Pavona cactus and Turbinaria reniformis maintained under laboratory conditions confirmed that the bacterial community associated with the tissue was specific to each species and different from seawater for two out of the three species. This specificity remained even when the corals were maintained during three days under different environmental conditions, such as a close or an open seawater system, or in two different containers. Such specificity in the bacterial community composition of coral tissue has already been highlighted in previous in situ observations (Frias-Lopez et al., Reference Frias-Lopez, Zerkle, Bonheyo and Fouke2002; Rohwer et al., Reference Rohwer, Breitbart, Jara, Azam and Knowlton2001, Reference Rohwer, Seguritan, Azam and Knowlton2002). Rohwer et al. (Reference Rohwer, Seguritan, Azam and Knowlton2002) showed that the frequency of bacterial groups detected in clone libraries varied substantially between Montastreae franksi, Diploria strigosa and Porites asteroides collected from the same environment. Also, Frias-Lopez et al. (Reference Frias-Lopez, Zerkle, Bonheyo and Fouke2002) demonstrated that microbial communities inhabiting the tissue of three Caribbean coral species showed marked differences.
Analyses of the sequences retrieved from the main DGGE fingerprints also showed different bacteria associated with each coral species. The consistent occurrence of these bands in the coral tissue/mucus but not in the water suggests that these bacteria might be highly adapted to the considered coral species. Three particular bacterial phylotypes were found to be associated to all tissue/mucus samples of G. fascicularis (Oculinidae family) in our culture conditions: (i) EU847508 closely related (97%) to ‘mucus bacterium 86’, also found in the mucus of another Oculinidae, the coral Oculina patagonica (Rosenberg, unpublished results); (ii) EU847600, also retrieved from colonies of Montipora aequituberculata collected in the Great Barrier Reef, and related at 100% to the uncultured alpha-proteobacterium 4GB-6, close to Ruegeria and Silicibacter species (Jones et al., Reference Jones, Bowyer, Hoegh-Guldberg and Blackall2004); and (iii) EU847599 related at 97% to Alteromonas sp. R2m1, which was considered by Ritchie (Reference Ritchie2006) as associated to Acropora palmata and was showing antibiotic activity. Pavona cactus was the coral species containing in its tissue/mucus the two potentially new genera (<90%) of proteobacteria (EU847601 and EU847602). This could indicate that these bacteria are highly specialized for this species. EU847603 is closely related at 97% to uncultured CAB-I bacterium, which has been reported as being a unique and ecologically dominant coral-associated bacterium (Klaus et al., Reference Klaus, Janse, Heikoop, Sanford and Fouke2007). Concerning T. reniformis, the new bacterial species (EU847605) consistently found in its tissue was most closely related to the uncultured organism ctg_CGOF078, identified in the deep-sea bamboo corals (Penn et al., Reference Penn, Wu, Eisen and Ward2006). In common with seawater samples, it also contained the EU847604 closely related at 99% to the uncultured marine eubacterium OTU_F. This bacterium was retrieved in coastal marine bacterioplankton of the North Sea and was shown to be resistant to UV radiation (Winter et al., Reference Winter, Moeseneder and Herndl2001).
Conversely to the tissue/mucus layer, the bacterial diversity associated with skeletons was not species-specific and most sequences belonged to gamma and alpha-proteobacteria, groups also common in other coral species (Rohwer et al., Reference Rohwer, Seguritan, Azam and Knowlton2002). Despite this lack of specificity, some bands were consistently found in all nubbins corresponding to each coral species. The two first interesting phylotypes are the above-cited EU847598 and EU847595, respectively found in the tissue/mucus of G. fascicularis and T. reniformis and also retrieved in their skeletons, suggesting the specificity of these bacteria to their coral host. These corals also contained in their skeleton two potentially novel phylotypes of Bacteroidetes (EU847589 and EU847597). Their closest relatives were found in the tissue of Montastraea annularis from Curaçao at the Netherlands Antilles (Klaus et al., Reference Klaus, Janse, Heikoop, Sanford and Fouke2007). These bacteria are particularly adapted at breaking down complex polysaccharides, so that the skeletal endolithic composition might have attracted these bacteria. The last interesting bacterial phylotype sequenced from the skeleton of P. cactus was EU847591 closely related at 99% to alpha-proteobacterium Silicibacter.
Differences in the bacterial community observed for each coral species can be linked to the quality or/and quantity of mucus exuded, since mucus contains high concentrations of proteins, lipids and polysaccharides that favour bacterial growth (Ferrier-Pagès et al., Reference Ferrier-Pagès, Leclercq, Jaubert and Pelegri2000; Wild et al., Reference Wild, Rasheed, Werner, Franke, Johnstone and Huettel2004). The composition in glycoconjugates presented in this study (glucose, galactose, glucosamine and galactosamine) is usually found in many corals (Ducklow & Mitchell, Reference Ducklow and Mitchell1979; Meikle et al., Reference Meikle, Richards and Yellowlees1988; Wild et al., Reference Wild, Woyt and Huettel2005), except xylose, abundant in T. reniformis but not detected in the other species. Concerning the amount of dissolved organic carbon (DOC) released, P. cactus and T. reniformis were among corals that excrete low amounts, such as Acropora variabilis, Stylophora pistillata (0.4 µg C cm−2 h−1, (Crossland, Reference Crossland1987)) and Acropora millepora (1µg C cm−2 h−1 (Wild et al., Reference Wild, Woyt and Huettel2005)). Conversely, G. fascicularis released ten times more DOC than the other species, and in the same range as the rates measured for S. pistillata sampled in surface waters (between 5 and 11 µg C cm−2 h−1, (McCloskey & Muscatine, Reference McCloskey and Muscatine1984; Muscatine et al., Reference Muscatine, Falkowski, Porter and Dubinsky1984; Porter et al., Reference Porter, Muscatine, Dubinsky and Falkowski1984)) or Acropora acuminata (11.75 µg C cm−2 h−1, (Crossland et al., Reference Crossland, Barnes and Borowitzka1980)). Ducklow & Mitchell (Reference Ducklow and Mitchell1979) were one of the first to suggest that a difference in bacterial abundance in the mucus of different coral species could be explained by different rates of mucus release, or a different mucus structure. However, only three studies have tried to link mucus composition to the bacterial diversity (Ritchie & Smith, Reference Ritchie, Smith, Lessios and Macintyre1997, Reference Ritchie, Smith, Rosenberg and Loya2004; Klaus et al., Reference Klaus, Janse, Heikoop, Sanford and Fouke2007). The first two studies (Ritchie & Smith, Reference Ritchie, Smith, Lessios and Macintyre1997, Reference Ritchie, Smith, Rosenberg and Loya2004) showed that bacteria isolated and cultured from different coral species presented a selective utilization of carbon sources. Conversely, Klaus et al. (Reference Klaus, Janse, Heikoop, Sanford and Fouke2007) found no correlation between mucus composition and bacterial diversity associated with the tissue of Montastrea annularis. In this study, T. reniformis presented 3 to 10 times lower DOC excretion rates than the other species, and a high percentage of xylose (up to 25–30%) in its mucus. Xylose is one of the most abundant sugars in nature, after glucose, also highly representative in the mucus of T. reniformis. Most bacteria from seawater can use these two sugars, which may explain that the bacterial community composition of T. reniformis tissue was clustered to the seawater bacterial composition. Conversely to T. reniformis, G. fascicularis presented the highest DOC excretion rate, with high galactose content in the mucus. It was also the species presenting the highest number of bands detected and the highest degree of difference in bacterial communities compared to the other species or seawater. The high DOC production and the specific mucus composition of G. fascicularis could have resulted in several important niches and thus, in a high evenness.
In conclusion, the bacterial community composition associated to the coral tissue showed an interspecies variability in all experiments. This specificity was not retrieved in the coral skeletons. The tissue specificity could be linked, in part, to the glycoconjugate composition of the mucus as well as the amount of DOC excreted. Galaxea fascicularis indeed presented the highest production rates, the highest quantity of galactose, and also the highest number of DGGE bands detected. Moreover, sequencing of DGGE bands indicated that some bacterial phylotypes were consistently retrieved in all samples of a given species, suggesting that there might be a link between the amount of DOC released and the bacterial composition. The bacterial specificity was conserved even when corals were incubated in different containers or with different seawater renewal rates.
ACKNOWLEDGEMENTS
We thank M.-E. Kerros and M.-D. Pizay for laboratory assistance, D. Zoccola for molecular biology advice, D. Allemand for support and A. Caron for statistical advice. Funding for this project was provided by the Centre Scientifique de Monaco and the Observatoire Océanologique de Villefranche.