

1 Introduction
Two of the most important generalisations about the role of social factors in linguistic change that emerge from the sociolinguistic studies of speech communities conducted in the last few decades are as follows:
1. Women lead in linguistic change:
a. ‘In linguistic change from above,Footnote 2 women adopt prestige forms at a higher rate than men.’ (Labov Reference Labov2001: 274)
b. ‘In linguistic change from below, women use higher frequencies of innovative forms than men do.’ (Labov Reference Labov2001: 292)
2. The curvilinear hypothesis: Linguistic changes from below originate in the interior social classes, rather than the highest or the lowest-status group (Labov Reference Labov2001).
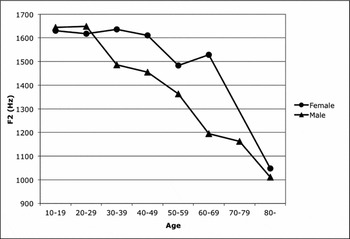
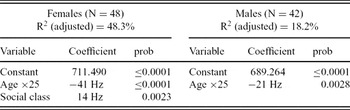
There is substantial evidence for the first generalisation, both for changes from above and for changes from below. Labov (Reference Labov1990, Reference Labov2001) summarises the evidence supporting the generalisation from numerous studies conducted in the twentieth century. Although there are exceptions, e.g. the raising of /ay/ before voiceless consonants in Philadelphia led by men (Conn Reference Conn2002), the majority tendency, i.e. the female lead, is clear. In addition, the male-led changes that have been found tend to be isolated shifts of individual sounds, as opposed to changes involving groups of sounds, as in chain shifts or parallel shifts. A recent example of a female-lead sound change in progress is the fronting of /ow/,Footnote 3 as in goat and so, in Charleston, South Carolina (figure 1).
Fronting of /ow/ in checked position (goat, boat, etc.) in apparent time by decade in Charleston, SC, based on separate multiple regression analyses for women (48) and men (42); expected F2 = regression constant + coefficient for each decade

There is less evidence supporting the second generalisation. There are relatively few studies showing a curvilinear effect of social class, as there are relatively few large-scale sociolinguistic studies covering the entire socioeconomic range of a city. In addition, some recent studies use a binary division of social class into lower vs higher, working vs middle, etc., which precludes the testing of the curvilinear hypothesis. Nonetheless, there are studies supporting the curvilinear hypothesis, such as the early exploration of Northern Cities Shift vowels in Detroit (Shuy et al. Reference Shuy, Wolfram and Riley1967; Fasold Reference Fasold1969), Labov's (Reference Labov2006) NYC study showing a curvilinear effect in the raising of /oh/, as in caught, Trudgill's (Reference Trudgill1974) study of Norwich English showing a curvilinear effect in the centralisation of /ɛ/ and backing of /ay/, and Cedergren's (Reference Cedergren1973) study of lenition of (ch) in Panama City. The most robust evidence comes from Labov's study of Philadelphia, based on 112 speakers analysed acoustically, showing a curvilinear effect of social class in a number of vowel shifts, e.g. the fronting and raising of /aw/, as in house and down, and the fronting and raising of /ey/ in checked position, as in gate and take; the evidence is summarised in figure 5.7 of Labov's (Reference Labov2001: 171) volume.
One question that arises given the evidence mentioned above is whether these two generalisations apply to mergers as well as sound shifts. Interestingly, almost all of the evidence for these two tendencies comes from the study of vowel shifts and lenition processes. Or put differently, whenever these generalisations are reported, as in, e.g., Ash (Reference Ash, Chambers and Schilling-Estes2013), the evidence presented in their support comes from vowel shifts or lenition processes, but never from mergers. In general, the evidence for the role of social factors in mergers is much less robust than in the case of vowel shifts and lenition processes. There have been quite a few studies of the low-back merger in North American English, for instance, but none report any robust evidence for the effect of social class. This includes Baranowski (Reference Baranowski2007), which, based on the acoustic analysis of 43 speakers, reports no significant social class effect for the cot–caught merger in Charleston, South Carolina.
The goal of this study is to investigate the role of social factors in vowel mergers by providing robust quantitative evidence on the basis of a larger data set, with a view to answering the question of whether mergers, like other changes from below, show a curvilinear effect of social class and a female advantage. The dialect of Charleston is undergoing six vocalic mergers (Baranowski Reference Baranowski2007) and is therefore particularly suitable for testing the two generalisations. This study looks at the two most vigorous mergers in progress in the dialect: the low-back merger and the pin–pen merger.
The low-back merger, also referred to as the cot–caught merger, is an unconditioned merger of the two low back vowels, /o/ and /oh/, as in cot–caught, Don–dawn, sod–sawed, etc. It is traditionally found in most of the West, Canada, western Pennsylvania and eastern New England (ANAE; Johnson Reference Johnson2010), and has been expanding into other areas, e.g. eastern Pennsylvania (Herold Reference Herold1997), Missouri (Majors Reference Majors2005; Gordon Reference Gordon, Murray and Simon2006), San Francisco (Hall-Lew Reference Hall-Lew2009) and Charleston, SC. The expansion of the merger into new dialect areas is in line with the generalisation known as Herzog's (Reference Herzog1965) principle, whereby mergers expand at the expense of distinctions, which, in turn, follows from Garde's (Reference Garde1961) principle, whereby mergers cannot be unmerged by linguistic means (Labov Reference Labov1994: 311–13).
In the Inland South, the merger has generally been inhibited by the presence of a back upglide on /oh/, as in caught, saw, etc. (Thomas Reference Thomas2001; ANAE), preventing the loss of the phonemic distinction despite possible F1–F2 overlap of the nuclei. When the upglide is lost, the low back merger may occur even in the South, as found by Irons (Reference Irons2007) in Kentucky. It should be noted that Charleston, a marginally Southern dialect, does not share this feature with the Inland South, i.e. there is usually no back upglide following the nucleus of /oh/ in Charleston (Baranowski Reference Baranowski2007).
The pin–pen merger is a conditioned merger of /ɪ/ and /ɛ/ before front nasals, as in pin–pen, him–hem, sinned–send, etc. It is found throughout the South (Brown Reference Brown1991; Montgomery & Elbe Reference Montgomery, Elbe, Curzan and Emmons2004; Tillery & Bailey Reference Tillery, Bailey, Schneider, Burridge, Kortmann, Mesthrie and Upton2004), though it is also present at scattered points across the US (Metcalf Reference Metcalf1972; Bigham Reference Bigham2005; ANAE). In the South, it has been found to be receding recently in large urban centres such as Houston (Koops et al. Reference Koops, Gentry and Pantos2008), Dallas and Atlanta (Tillery & Bailey Reference Tillery, Bailey, Schneider, Burridge, Kortmann, Mesthrie and Upton2004), likely due to a large influx of non-Southerners in the last few decades (Thomas Reference Thomas1997, Reference Thomas, Schneider, Burridge, Kortmann, Mesthrie and Upton2004).Footnote 4
2 Methods
The study investigates the progress of the low-back merger and the pin–pen merger in apparent time in Charleston, South Carolina. It is based on a sample of 100 European-American speakers recorded during sociolinguistic interviews, stratified by age (8–90), gender and socioeconomic status. Five socioeconomic levels are distinguished, ranging from working to upper class. Occupation was the primary indicator of socioeconomic status for levels 1–4, i.e. working to upper middle. The upper class of Charleston, following McDavid (Reference McDavid1955: 273), is defined primarily on the basis of ancestry and connections, and only then on wealth. The speakers representing this group all come from old Charleston families; they grew up in the historic part of downtown Charleston south of Broad Street, or on plantations owned by their families, had full-time maids and nannies when growing up, and attended private, often single-sex, schools (see Baranowski Reference Baranowski2007, Reference Baranowski2008 for a more detailed discussion of this social group).
The speech of 90 of the speakers has been analysed acoustically in Praat (Boersma & Weenink Reference Boersma and Weenink2008), with F1–F2 measurements of the speakers’ complete vowel systems, i.e. including all phonemes in different phonological environments (Baranowski Reference Baranowski, Bayley, Cameron and Lucas2013; ANAE: ch. 5). The measurements include spontaneous speech produced during sociolinguistic interviews, minimal-pair tests and word list tokens. The F1/F2 values have been normalised (Nearey Reference Nearey1977). The vowel plots below are produced with Plotnik 9.3 (Labov Reference Labov2010).
In addition, minimal-pairs tests were conducted with 97 of the speakers, using Don–dawn and cot–caught pairs for the low-back merger, and pin–pen and him–hem pairs for the pin–pen merger. The speakers read out each pair and said whether in their speech the two words sounded the same, close but slightly different, or different. The speakers’ judgements of each pair, i.e. their perception, were scored as 0, 1 or 2, respectively. Their actual production was scored (by the author) in the same way.
The results of the minimal-pair tests and the acoustic measurements are entered as dependent variables in a series of linear multiple-regression analyses in DataDesk 6.2.1, with gender, social class and age as independent variables. Social class is entered either as a continuous variable (1–5), or as factors representing five levels: working, lower middle, middle middle, upper middle and upper class; those are also grouped into three major classes, i.e. working, middle and upper. The tables below report the factors that have come out as significant.
3 Results and discussion
3.1 Low-back merger
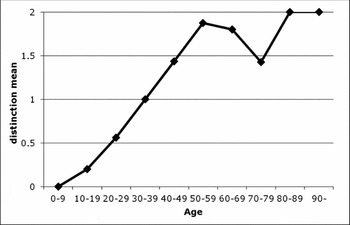
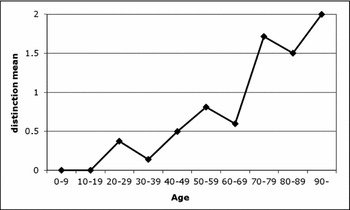
Figure 2 shows the progress of the low-back merger in Charleston in apparent time on the basis of minimal-pair tests. Speakers aged 50 and over are largely distinct, whereas for younger speakers there is a smooth progression towards merger, with children and teenagers being largely merged. There are no significant differences between the speakers’ production and their perception of the two vowels in minimal-pair tests.
Merger of cot and caught in production in apparent time by decade; minimal-pair test (0 = merged, 2 = distinct) mean values for 97 speakers

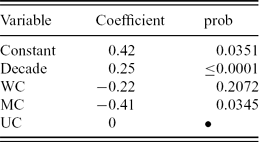
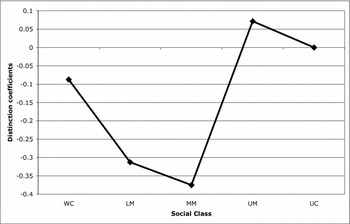
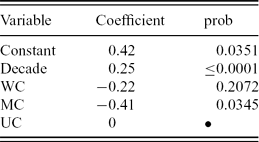
Social class plays a role, but it does not come out as significant when entered as a single continuous variable, indicating that the relationship may not be linear. Indeed, when social class is entered as three separate variables representing three major social class categories (working, middle and upper class as the residual categoryFootnote 5), a curvilinear pattern emerges, with the class in the middle of the scale leading the change (table 1). The lowest value of the regression coefficient for the middle class, −0.41, indicates that this group is expected to be 0.41 lower than the upper class (the residual category in the regression) on the distinction scale between 2 and 0, where lower values indicate less phonemic distinction, i.e. more merger. At the same time, table 1 also shows that the difference between the upper class (the residual category in the regression) and the working class is not statistically significant. The curvilinear effect is shown graphically for five social classes in figure 3.Footnote 6 The lower the value of the coefficient, the less distinction there is between the two vowels for a particular social class, that is, the more advanced the merger.
Multiple regression of cot–caught merger in minimal-pair tests; production; 97 speakers; R2 (adjusted) = 42.0%
Curvilinear pattern in cot–caught merger in minimal-pair tests; regression coefficients for five social classes (97 speakers)

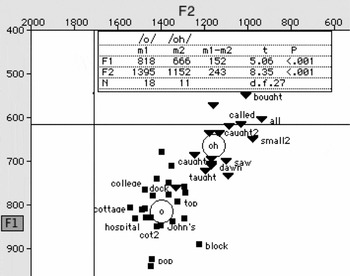
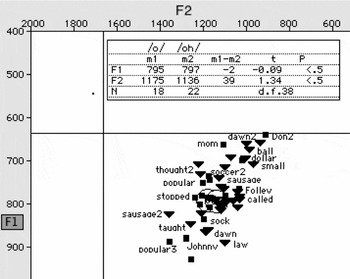
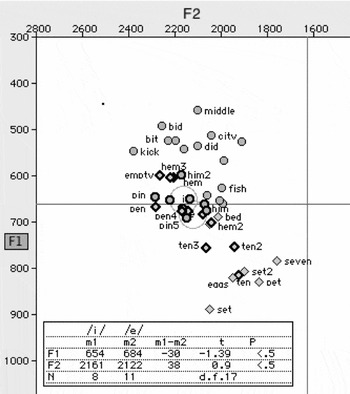
When the position of the two vowels is studied acoustically in apparent time, two changes emerge: the backing of /o/, as in cot, and the lowering of /oh/, as in caught, leading to what appears to be a merger by approximation (Trudgill & Foxcroft Reference Trudgill, Foxcroft and Trudgill1978; Labov Reference Labov1994: 321). The start and end points of the changes are illustrated in the next two figures, showing the position of the two low back vowels for an 82-year-old upper-class Charlestonian, Elizabeth O., 82 (figure 4), and her 15-year-old grandson (figure 5). The two phonemes show clear phonetic separation for Elizabeth O., with the means being significantly different in both F1 and F2 (confirmed by a t-test), and they show complete overlap for her grandson. Speakers in between these two generations show increasing acoustic approximation with decreasing age.
Elizabeth O., b. 1922, Charleston, SC, upper class (grandmother of Peter O. in figure 5)

Peter O., b. 1989, Charleston, SC, upper class (grandson of Elizabeth O. in figure 4)

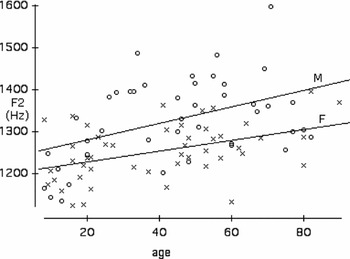
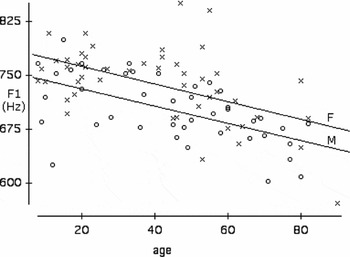
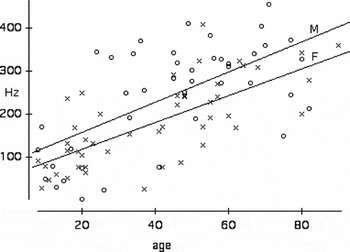
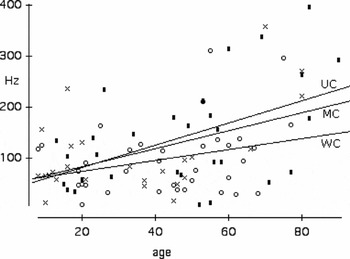
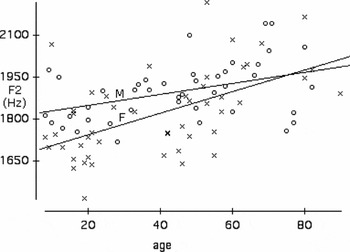
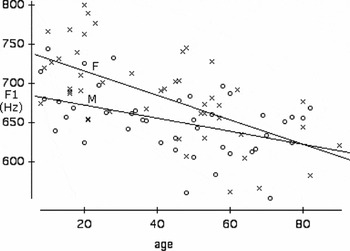
The change in the acoustic position of the two vowels is illustrated in figures 6 and 7, showing mean formant values for 90 speakers aged 8 to 90. F2 of /o/ is decreasing in apparent time (figure 6), and F1 of /oh/ is increasing in apparent time, i.e. the vowel is lowering (figure 7). Figure 8 combines the two shifts by showing the Cartesian distance between the two vowels decreasing in apparent time.
Backing of /o/ (cot, top, etc.) in apparent time by gender (90 speakers); females: crosses, males: circles

Lowering of /oh/ (caught, thought, etc.) in apparent time by gender (90 speakers); females: crosses, males: circles

Cartesian distance between /o/ (cot, top) and /oh/ (caught, thought) in apparent time by gender (90 speakers)

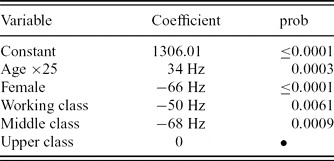
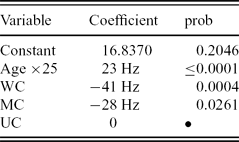
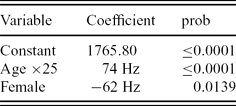
Figures 6–8 also show that both shifts are led by women, i.e. women are ahead of men in the acoustic approximation between the two phonemes. The female lead in the backing of /o/ is confirmed in a multiple-regression analysis reported in table 2, showing a significant female advantage. The negative value of the female coefficient in table 2 indicates that the expected F2 of /o/ for women is lower (by 66 Hz) than for men, i.e. the vowel is more retracted.
Backing of /o/ (cot, top, etc.); multiple regression of F2 of /o/ (90 speakers); age coefficient for each generation of 25 years; R2 (adjusted) = 39.0%

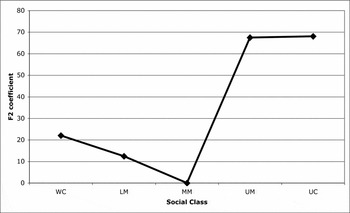
Table 2 also shows a strong effect of social class, displaying a curvilinear pattern with the class in the middle of the scale having the lowest expected F2, that is, leading the backing of the vowel. The curvilinear effect is presented graphically in figure 9, showing F2 coefficients for five social classes, with the middle-middle class as the residual category. The class in the middle of the social scale has the lowest expected F2, i.e. is leading the change. This is the same curvilinear pattern as the one seen above in the minimal-pair test results in figure 3. This time, however, the evidence is of a different kind – it is based on the acoustic shift of one of the vowels towards the other rather than on minimal-pair tests. The result is consistent: the social class in the middle is ahead in the acquisition of the merger. This gives us added confidence that this result, though subtle, as is often the case in changes from below which are still in progress, is nevertheless real.
Curvilinear pattern in the backing of /o/ (cot, top, etc.); F2 coefficients by social class (90 speakers)

Interestingly, the group leading the change in Charleston appears to be slightly higher on the socioeconomic scale than the ones identified in studies of vowel shifts showing a curvilinear pattern, e.g. the upper working class in Philadelphia (Labov Reference Labov2001) or the lower-middle class as in Norwich (Trudgill Reference Trudgill1974). This is most likely due to differences between the social structures of these communities, rather than differences between the types of changes, i.e. mergers vs vowel shifts. In contrast to most US cities today, Charleston has a distinctive high-status group that could be referred to as the upper class. Its distinctiveness is readily recognised both by members of the group itself and by other Charlestonians. As mentioned above, this group has traditionally lived in the historic downtown section of Charleston south of Broad Street, and is often referred to in the interviews as south of Broad or sometimes as bluebloods (see Baranowski Reference Baranowski2008). It could be argued, therefore, that Charleston's class structure is extended upwards in comparison with most other US cities, and, as a result, the group in the middle of the social scale leading changes from below appears to be somewhat higher on the socioeconomic scale than the groups responsible for the curvilinear effect in other communities.
3.2 Pin–pen merger
Figure 10 shows the acquisition of the merger in Charleston in apparent time on the basis of minimal-pair tests. Most speakers in their 70s and older have a distinction, whereas most younger speakers are largely merged, with children and teenagers completely merged. Although there is a clear progression towards merger in apparent time, it is not as smooth as in the case of the low-back merger (cf. figure 2). There is more variation, which turns out to be largely due to the effect of social class.
Merger of him and hem in production by decade; minimal-pair test (0 = merged, 2 = distinct) mean values for 96 speakers

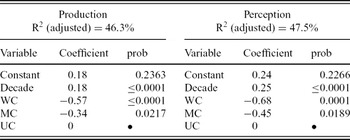
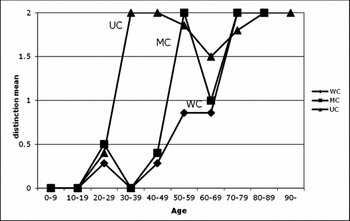
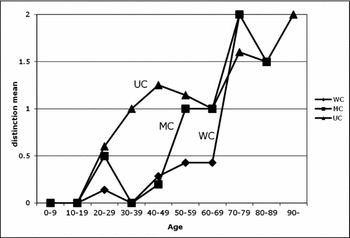
It is worth noting that the social class effect is different from that found in the low-back merger in the same community. A regression analysis reveals that the social class pattern is not curvilinear (table 3). Rather, it is a decreasing monotonic relationship, i.e. the higher the social class, the lower the degree of merger. In other words, the change is led by the lowest-status group rather than by a group in the middle of the social scale. This social class effect is significant in both perception and production, but the differences between the social classes are greater in the informants’ perception than in their actual production. Perception lags behind production in the pin–pen merger in Charleston, especially for the highest social class, which can be seen in figures 11 and 12.
Multiple regression of him–hem merger in minimal pairs in perception and production

him–hem merger in apparent time by social class; perception of minimal pairs (96 speakers)

him–hem merger in apparent time by social class; production of minimal pairs (96 speakers)

The lag of speakers’ perception behind their production in the pin–pen minimal pairs is intriguing in that it goes against the generalisation that in mergers in progress, perception tends to precede production. This tendency is most likely due to the mechanism by which speakers, while maintaining a difference in their pronunciation, stop relying on the phonemic contrast for the interpretation of meaning when faced with large numbers of speakers with no phonemic distinction (Di Paolo Reference Di Paolo, Ferrara, Brown, Walters and Baugh1988; Herold Reference Herold1990). The ANAE reports, for example, that for the cot–caught merger across all North American dialects, perception precedes production in minimal pair tests for 109 informants, whereas the reverse is true for only 51 informants (p. 62). In the pin–pen merger, 90 ANAE informants show the merger to be more advanced in their perception than in their production, with only 43 informants showing the opposite pattern (p. 67).Footnote 7 In the pin–pen merger in Charleston, however, there is a slight lead of production over perception, that is, some speakers identify the minimal pairs as sounding different even though they pronounce them as either close or identical (table 3; figures 11–12). The reason for this may be that, as opposed to most other mergers in progress, the pin–pen merger in Charleston (though not necessarily in other dialect areas) is most likely above the level of social awareness, and may be subject to some negative social evaluation, a point we shall return to below.
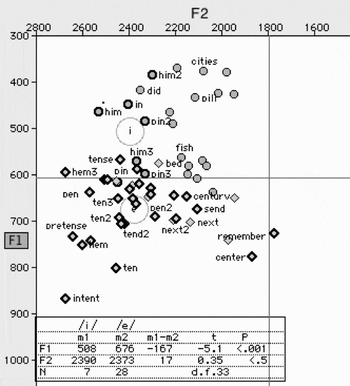
As regards the position of the nasal allophones of /ɪ/ and /ɛ/ in acoustic space, only speakers in their 70s and older show clear phonetic separation between the two sounds; some tokens overlap but the means are clearly separated, as in the speech of John E. (figure 13). Most speakers below the age of 70 show considerable phonetic overlap, with the youngest generation being completely merged, as in the speech of Lisa A. (figure 14). Although the merged vowel can be perceived as being closer to [ɪ] than to [ɛ], it is in fact intermediate acoustically.Footnote 8 The progress of the phonetic approximation between the two vowels can be seen in figure 15, showing decreasing Cartesian distance in apparent time for a sample of 90 speakers.
John E., b. 1924, Charleston, SC; middle class: /ɪ/ and /ɛ/ (highlighted tokens and means before nasals)

Lisa A., b. 1983, Charleston, SC; middle class: /ɪ/ and /ɛ/ (highlighted tokens and means before nasals)

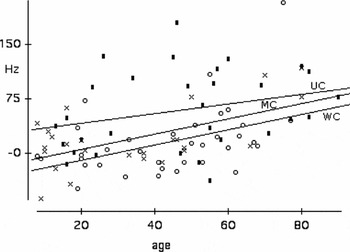
Cartesian distance between /ɪN/ and /ɛN/ in apparent time by social class (90 speakers); upper class: rectangles, middle class: crosses, working class: circles

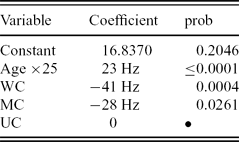
Figure 15 also indicates that there are social class differences in the degree of the phonetic distance between the two vowels. While the community as a whole is going in the same direction, i.e. towards merger, there is subtle social stratification, with higher classes showing more phonetic separation. This relationship between social class and the degree of merger becomes clearer when we look at the difference in height, rather than Cartesian distance, between the two vowels in minimal-pair tokens (figure 16).Footnote 9 What emerges is a monotonic decreasing relationship between social class and the advancement of the merger, with higher social classes lagging behind. The monotonic social stratification pattern is confirmed in a multiple-regression analysis reported in table 4, where the expected phonetic distance between the vowels decreases with decreasing socioeconomic levels. Importantly, this is different from the curvilinear pattern seen in the low-back merger advancing in the same community at the same time (cf. table 2, figure 5).
Multiple regression of F1/ɛN/–F1/ɪN/ in minimal pairs (90 speakers); age coefficient for each generation of 25 years; R2 (adjusted) = 27.0%
F1(ɛN)-F1(ɪN) in apparent time by social class in minimal pairs (90 speakers); upper class: rectangles, middle class: crosses, working class: circles

The fact that the social class differences are amplified in formal elicitations, i.e. minimal pairs, combined with the fact that the speakers’ perception (their judgements) of the merger lags behind their actual production, suggests that the pin–pen merger, as opposed to the low-back merger, is above the level of conscious awareness and carries some negative social affect. It may be, at least for some Charlestonians, associated with speakers from the Inland South (as opposed to the coastal South or the Low Country) and its other marked features, such as the Southern Shift (ANAE: ch. 18; Feagin Reference Feagin, Nagle and Sanders2003); this is not unlike the association made by Houstonians between the degree of the pin–pen merger and the perceived dialect and age of the speaker,Footnote 10 as reported by Koops et al. (Reference Koops, Gentry and Pantos2008), or the social indexing of the near–square merger in New Zealand English, as reported by Hay et al. (Reference Hay, Warren and Drager2006). This awareness is confirmed in the overt comments offered by a number of informants during their minimal-pair tests, four of whom are quoted below.
Matthew R., 60, upper middle class: ‘Pin, pen [sounds high], uh, pin, uh, and I th- I think they sound different. I probably. . . People often misunderstand when I use those words so probably. . . uh they sound more the same than I realize. Pin is something you stick with, and pen is what you write with.’
David B., 82, upper class: ‘In Charleston you'll get a difference between pin and pen. In Columbia [South Carolina] you might not. In Charleston it would be different. Pin and pen. And the same thing for him and hem.’
Cathy O., 57, upper class: ‘Pin and pen. Now, to me they sound differently but I hear an awful lot of people who pronounce them the same. Pin, obviously, is a sharp needle-like instrument, and pen [sounds high, close to pin] is a writing instrument.’
Walter B., 66, middle class: ‘Pin and pen. [laughter] They never sound the same to me except when other people say 'em. I think they always say pin. But uh, but we. . . Pin is something you get stuck with and pen is something you write with. [laughter] I'm sorry, I get very tickled about that.’
These comments suggest that the pin–pen merger in Charleston is indeed above the level of conscious awareness, at least for some speakers.Footnote 11 What is particularly striking is the contrast with the low-back merger operating in the same community – no such comments were volunteered for the low-back merger minimal pairs, and no one seems to get tickled about it.Footnote 12
It is worth noting that table 4 shows no significant gender effect, i.e. there is no female lead in the pin–pen merger, as opposed to the low-back merger. This is what one might expect if the merger is indeed above the level of conscious awareness. Women would not be expected to lead a change which was above the level of awareness and at the same time showed negative social evaluation. This is essentially the same mechanism by which women, all other things being equal, tend to use variants which are considered more standard or prestigious at higher rates than menFootnote 13 (Labov Reference Labov1990, Reference Labov2001). Therefore it is not surprising to see no female lead in a change which is, however mildly, negatively perceived. The low-back merger, on the other hand, appears to be below the level of conscious awareness and to show no social affect.
3.3 Charleston Chain Shift
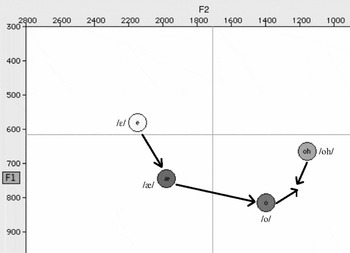
Another reason why a female lead in the low-back merger, but in not the pin–pen merger, is not unexpected is a structural one. If the low-back merger in Charleston is looked at in the context of the whole vowel system, rather than as a single isolated change, the shifts of the two low back vowels can be seen as part of a larger change in progress in the dialect. It turns out that not only is there backing of /o/, as in cot, but there is also backing of short-a before non-nasals, as in cat, and lowering of /ɛ/, as in pet (figure 17). There is most likely a chain shift in progress in Charleston, akin to the Canadian Shift (Boberg Reference Boberg2005) and similar chain shifts found in California (Eckert Reference Eckert2004), Columbus, Ohio (Durian Reference Durian2008) and Illinois (Bigham Reference Bigham2009).
Charleston Chain Shift

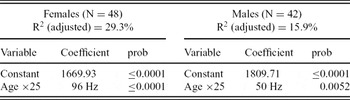
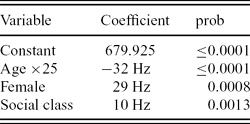
The important point here is that this chain shift is led by women (figures 18, 19). Each of the component vowel shifts shows a statistically significant female advantage, as seen in the regression analyses for the shifts of /æ/ (table 5) and /ɛ/ (table 7); tables 6 and 8 report the apparent time slopes, i.e. the age effects, for the two vowels based on regression analyses conducted separately for men and for women. As mentioned above, the exceptions to the majority tendency, i.e. the female lead, tend to be isolated shifts, not connected to the rest of the vowel system. Sound changes involving groups of sounds connected with each other, as in chain shifts, have generally been found to be led by women (Labov Reference Labov2001). Given this generalisation, it is not surprising to see a female advantage in the low-back merger, part of a larger chain shift, and no female lead in the pin–pen merger, an isolated change. This is not unlike the situation in New Zealand English, where the near–square merger, also showing a female lead, has been linked to the larger chain shift of the front vowels (Maclagan & Gordon Reference Maclagan and Gordon1996).
Multiple regression of F2 of /æ/ before non-nasals (cat, sad, back, etc.), 90 speakers; R2 (adjusted) = 29.0%; age coefficient for each generation of 25 years
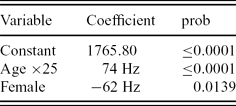
Separate regression analyses of F2 of /æ/ before non-nasals (cat, sad, back, etc.) for females and males

Multiple regression of F1 of /ɛ/ (pet, get, etc.), 90 speakers; age coefficient for each generation of 25 years; R2 (adjusted) = 43.1%
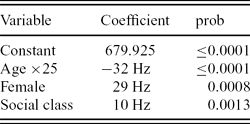
Separate regression analyses of F1 of /ɛ/ (pet, get, etc.) for females and males

Backing of /æ/ before non-nasals (cat, sad, back, etc.) in apparent time by gender (90 speakers); females: crosses, males: circles

Lowering of /ɛ/ (pet, dead, etc.) in apparent by gender (90 speakers); females: crosses, males: circles

4 Conclusions
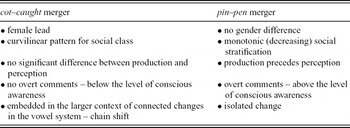
The differences between the two mergers in Charleston (table 9) suggest these two changes, advancing in the community at the same time, are rather different as far as the role of social factors is concerned. One, the low-back merger, conforms to the generalisation of the curvilinear hypothesis and shows a female lead. The other, the pin–pen merger, shows no gender effect and instead of a curvilinear effect, displays a pattern of social stratification reminiscent of stable sociolinguistic variables such as (ing) and (th, dh) (Labov Reference Labov2006). The differences seem to stem from the different social perceptions of the two mergers in the community, i.e. the low-back merger is a change from below the level of conscious awareness, whereas the pin–pen merger in Charleston appears to be a change that, at least at this point, may be above the level of conscious awareness.
Summary of the differences between the low-back merger and the pin–pen merger in Charleston

The question is whether it is the same as a change from above in the sense that this term has come to function in the literature. The answer partly depends on the exact definition of change from above. Labov (Reference Labov2001: 272–4) says that such changes
may take the form of the importation of a new prestige feature from outside the speech community, or the re-distribution of forms with known prestige values within the community. Changes from above take place at a relatively high level of social consciousness, show a higher rate of occurrence in formal styles, are often subject to hypercorrection, and sometimes form overt stereotypes similar to stable sociolinguistic variables.
There are then two elements here: the level of the social awareness of the incoming form on the one hand and, on the other, the status of the group advancing it, that is, the direction within the socioeconomic hierarchy. If we define changes from above in terms of prestige and the direction within the socioeconomic hierarchy, then the pin–pen merger in Charleston is clearly not a change from above in that sense; it is being resisted, rather than promoted, by the highest-status group. At the same time, it seems to be slightly above the level of social consciousness in the community. One possibility is that this is a change that may have been below the level of social awareness in the beginning but has now crossed that threshold and, because of its association (or social indexing in the sense of Hay et al. Reference Hay, Warren and Drager2006) with low-status groups, it has acquired some negative social affect.
Alternatively, it is arguably a rare, but not impossible, example of a change from above, defined by the level of social consciousness, led by lower-status groups. Although many, if not most, definitions of change from above found in the literature seem to focus on the direction of the change in terms of the social hierarchy, Labov (personal communication) points out that the defining element in change from above or below is the level of social awareness and not the direction of the change in terms of social groups. In other words, above or below refers primarily to the level of conscious awareness and not to socioeconomic levels.
It seems to me that the classification of changes into changes from above and below can indeed be more useful, that is, offer us better insight into the nature of linguistic change, if we focus on the level of awareness, with the prestige of linguistic forms falling out of the association of those forms with the social groups advancing them. If a change is above the level of social awareness and is associated with a low-status group, then it is likely to be resisted by the rest of the community (particularly by the higher classes) and inhibited, though how successful that resistance may be is another question. If, on the other hand, a change is above the level of awareness and is associated with a high-status group and therefore considered prestigious, then it is more likely to be successful, i.e. likely to be adopted by the rest of the community; then we may see groups in the middle overshooting the target in formal styles, resulting in the cross-over pattern of the groups in the middle, e.g. the lower middle class (Labov Reference Labov2006). Therefore, it is not surprising to see changes from above the level of awareness usually led by a high-status, rather than a low-status, social group.
However, the resistance to changes brought about by lower-status groups may not always be very effective, which is what seems to be happening in Charleston. The pin–pen merger is most likely a change brought into Charleston through contact with the Inland South, in line with Garde's (Reference Garde1961) and Herzog's (Reference Herzog1965) principles, and is expanding in spite of the social pressures against it. It should be pointed out, though, that these social pressures are not particularly strong, that is, while the pin–pen merger in Charleston is clearly at a higher level of awareness than the low-back merger, it does not seem to be subject to the same stigmatisation or even stereotyping as some other marked features of the Inland South, such as the quality of the vowels affected by the Southern Shift (ANAE: ch. 18; Feagin Reference Feagin, Nagle and Sanders2003).
To return to the main question posed at the beginning, i.e. whether mergers, just like vowel shifts or lenition processes, show a curvilinear effect of social class and a female advantage, the answer is a qualified ‘yes’. As long as mergers are indeed below the level of social awareness, they can be expected to follow the same patterns of propagation throughout the community as other changes from below.Footnote 14 Mergers are said to be generally invisible to social evaluation – devoid of social affect (Labov Reference Labov1994) – and the low back merger in Charleston conforms to this generalisation; it appears to be below the social radar. However, there may be exceptions to this generalisation, such as the pin–pen merger in Charleston, i.e. mergers above the level of awareness, led by lower-status groups and associated with those groups in the community, and, as a result, subject to negative social evaluation.Footnote 15 In such cases, we may see monotonic social stratification, rather than a curvilinear pattern, and no significant female advantage.