I. INTRODUCTION
Rivaroxaban (Figure 1), a novel oral direct factor Xa inhibitor, has been widely used for nonvalvular atrial fibrillation (NVAF) and deep venous thrombosis or venous embolism (Akao et al., Reference Akao, Yasuda, Kaikita, Ako, Matoba, Nakamura, Miyauchi, Hagiwara, Kimura, Hirayama, Matsui and Ogawa2021). It can inhibit the formation of thrombin by inhibiting factor Xa activity and ultimately inhibit thrombus formation and enlargement (Ajmal et al., Reference Ajmal, Friedman, Sipra and Lassar2021).
Molecular diagram of rivaroxaban.

The single crystallographic data of rivaroxaban [a = 9.0184 (6) Å, b = 10.9980 (8) Å, c = 11.2386 (8) Å, α = 63.426 (2)°, β = 74.414 (3)°, γ = 78.144 (2)°, unit-cell volume V = 955.56 (12) Å3, Z = 2, ρ cal = 1.515 g cm−3, and space group P1] had been deposited with the Cambridge Crystallographic Data Center (CCDC) with a supplementary publication number of CCDC-1810879 (Shen et al., Reference Shen, Tang and Hu2017). To date, the detailed X-ray powder diffraction (PXRD) data for rivaroxaban have not been reported.
II. EXPERIMENTAL
A. Sample preparation
The sample was purchased from Energy Chemical (Shanghai, People's Republic of China). The melting point and measured density of rivaroxaban are 227–228 °C and 1.491 g cm−3, respectively. Recrystallization of rivaroxaban at room temperature was successful using methanol as a solvent. Then, the crystals were dried, smashed, screened through 75 μm mesh size, and pressed flat to a zero background plate.
B. Diffraction data collection and reduction
XRD measurement was performed at room temperature using a Bruker D8 Advance diffractometer (Bruker, AXS, Germany) with a LynxEye array detector and CuKα radiation (generator setting: 40 kV and 40 mA). The diffraction data were collected over the angular range from 5° to 50° 2θ with a step size of 0.019757° 2θ and a counting time of 37 ms/step. Some peaks in the diffraction pattern display asymmetry which is possibly because of stacking faults (Langford and Louër, Reference Langford and Louër1991).
The software package Material Studio 8.0 (Accelrys Co., Ltd., CA, USA) was used to process the data. The PXRD pattern was pre-treated by subtracting the background, smoothing, and stripping off the Kα 2 component. Peaks were located in the diffraction pattern using automated peak searching. Automatic indexing results were obtained by X-cell method (Neumann, Reference Neumann2003). The indexing results were then refined using Pawley (R wp = 6.51%) (Pawley, Reference Pawley1981), which involves assigning the Miller indices (h, k, l) to each observed peak in the experimental PXRD pattern. Line shift correction was turned on during the cell parameter refinement. All measured lines in the raw data were indexed. The method of determination of intensity was peak height above background.
III. RESULTS
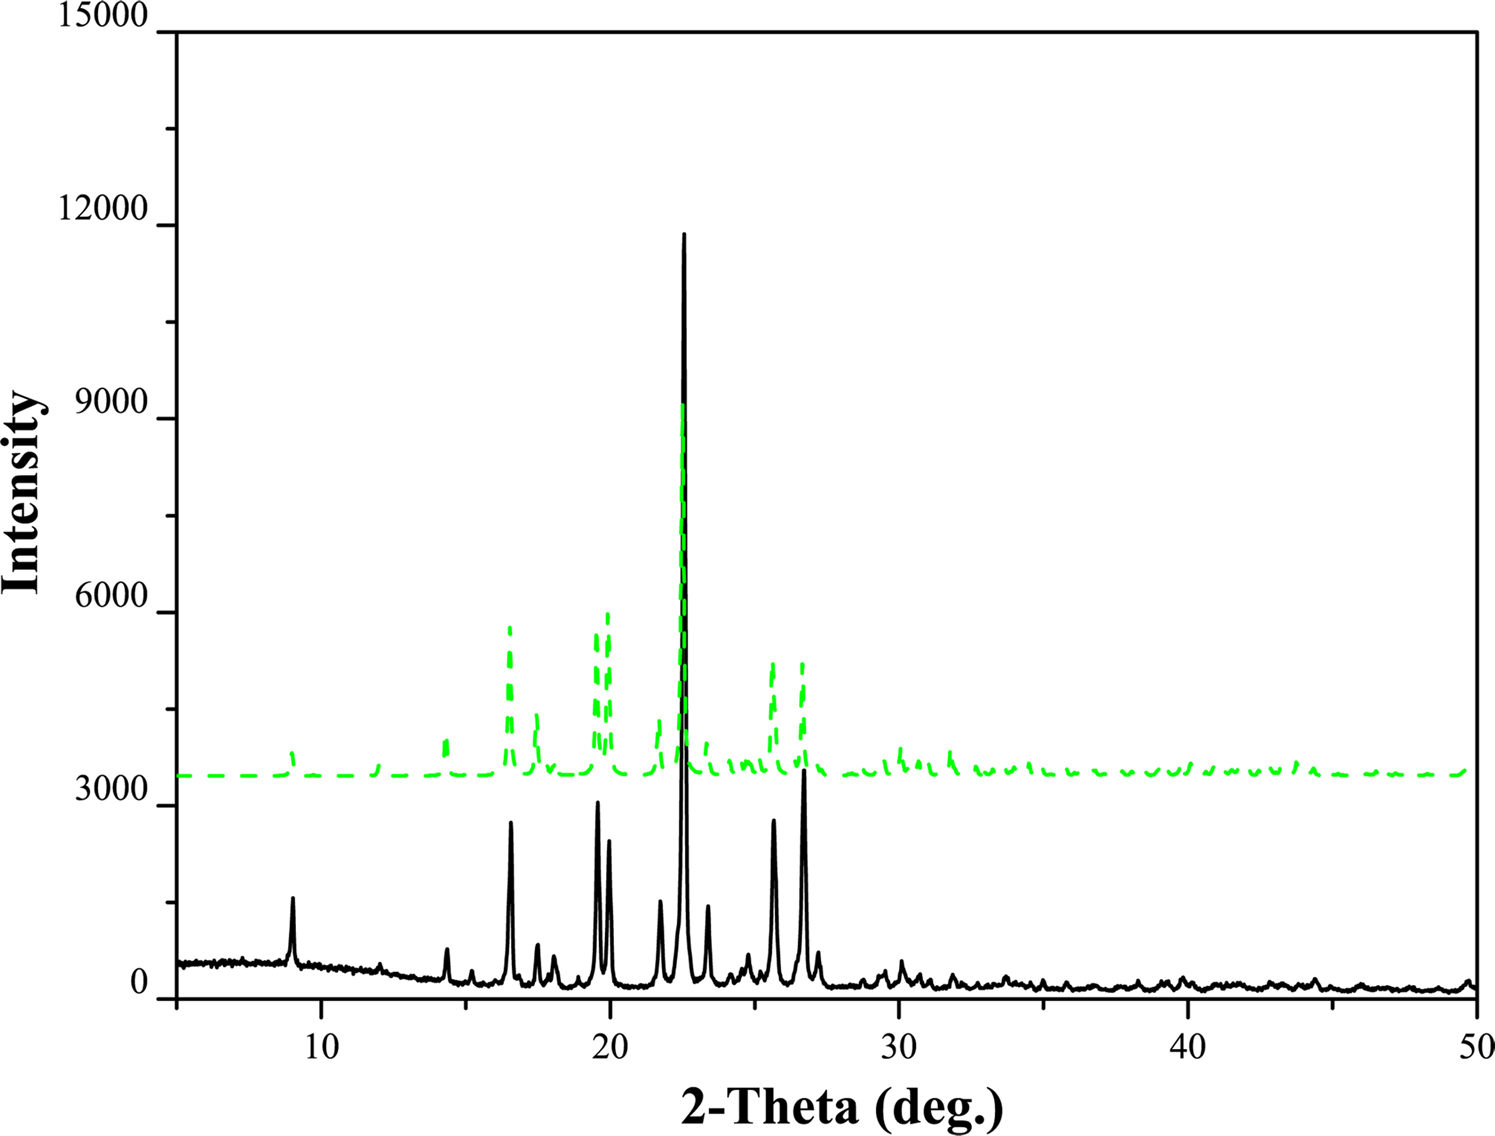
Pawley refinement results confirmed that rivaroxaban is triclinic with space group P1 and unit-cell parameters: a = 9.010(3) Å, b = 10.986(6) Å, c = 11.230(1) Å, α = 63.439(5)°, β = 74.355(4)°, γ = 78.133(3)°, unit-cell volume V = 952.87 Å3, Z = 2, ρ cal = 1.519 g cm−3. The values of 2θ obs, d obs, I obs, h, k, l, 2θ cal, d cal, Δ2θ are listed in Table I. The results are in good agreement with the single-crystal data and the deviations of the unit-cell parameters and unit-cell volume were between 0.02% and 0.28%. The comparison of PXRD pattern (raw data file deposited with ICDD) with the simulated pattern is shown in Figure 2.
X-ray powder diffraction pattern of rivaroxaban using CuKα radiation (black solid line) and the simulated pattern of the crystal structure (green dash line).

Indexed X-ray powder diffraction data for rivaroxaban.

The d-values were calculated using CuKα 1radiation (λ = 1.5405981 Å).
IV. DEPOSITED DATA
The rivaroxaban, the raw data file has been deposited with ICDD. You may request this data from ICDD at info@icdd.com.