


Introduction
Diapause is widely involved in the regulation of insect life cycles in changing environments such as season (Tauber et al. Reference Tauber, Tauber and Masaki1986; Danks Reference Danks1987, Reference Danks2007). High tolerance to coldness, desiccation, and food deficiency in the state of diapause enables insects to resume development under favourable conditions following harsh ones (Danks Reference Danks2007). Obligate diapause is induced at a specific developmental stage under any environmental condition, while facultative diapause is induced primarily by photoperiod and temperature. The incidence of facultative diapause is modified by other auxiliary cues, such as crowding, quantity and quality of food, and humidity (Tauber et al. Reference Tauber, Tauber and Masaki1986; Danks Reference Danks1987; Saunders Reference Saunders2002).
Enhanced crowding may change the environment for the worse by causing deficiencies of food and space. If diapause is an adaptation to unfavourable environment, enhanced crowding is expected to increase the incidence of diapause (density-dependent manner). Density-dependent induction of diapause at preimaginal stages has been reported in Trogoderma granarium Everts (Coleoptera: Dermestidae) (Nair and Desai Reference Nair and Desai1972), Tribolium freemani Hinton (Coleoptera: Tenebrionidae) (Nakakita Reference Nakakita1982), Cydia pomonella (Linnaeus) (Lepidoptera: Tortricidae) (Brown et al. Reference Brown, Berryman and Bogyo1979), Diprion pini (Linnaeus) (Hymenoptera: Diprionidae) (Geri and Goussard Reference Geri and Goussard1989), and others. However, inverse density-dependent induction of diapause, i.e., a negative relationship between population density and incidence of diapause, has also been reported in some species such as the calliphorid fly, Calliphora vicina Robineau-Desvoidy (Diptera: Calliphoridae) (Saunders Reference Saunders1997) and the sarcophagid fly Sarcophaga argyrostoma (Robineau-Desvoidy) (Diptera: Sarcophagidae) (Saunders Reference Saunders1975), and the dermestid beetles, Trogoderma inclusum LeConte and Trogoderma variabile Ballion (Coleoptera: Demestidae) (e.g., Partida and Strong Reference Partida and Strong1975; Strong Reference Strong1975). Danks (Reference Danks1987) and Saunders (Reference Saunders2002) describe both types of density dependence of diapause induction but do not discuss what factors are related to one type versus the other.
Mutual tactile stimulation between insects has been most frequently reported as one of proximate factors responsible for density dependency (e.g., Iwao Reference Iwao1956; Tsuji Reference Tsuji1959; Tschinkel and Willson Reference Tschinkel and Willson1971; Nair and Desai Reference Nair and Desai1972; Elbert and Levinson Reference Elbert and Levinson1979; Nakakita Reference Nakakita1982). Other factors reported so far are small body size (Saunders Reference Saunders1997), old culture food contaminated with faecal pellets and diapause-inducing substances deposited in diet by larvae (Burges Reference Burges1963; Hagstrum and Silhacek Reference Hagstrum and Silhacek1980), and reduced developmental time by overcrowding, which is shorter than the number of short-day cycles required to induce diapause (Saunders Reference Saunders1975).
Monochamus alternatus Hope (Coleoptera: Cerambycidae) is a wood boring insect. The females lay eggs under the bark of pine trees such as Pinus densiflora Siebold and Zuccarini, P. thunbergii Parlatore, P. luchuensis Mayr, and P. masoniana Lambert (Pinaceae) that are dying or have recently died from infection of the pine wood nematode, Bursaphelenchus xylophilus (Steiner and Buhrer) Nickle (Nematoda: Parasitaphelenchidae), and other causes (Nakamura-Matori Reference Nakamura-Matori2008). The larvae feed on the inner bark (phloem) and in most cases excavate tunnels in the xylem to make pupal chambers (Togashi Reference Togashi1989a, Reference Togashi1989b). Adults emerge from dead trees and feed on the bark of healthy host branches to mature reproductively (Togashi and Magira Reference Togashi and Magira1981; Togashi Reference Togashi1997).
The Taiwanese subspecies, M. alternatus alternatus Hope, has a facultative diapause in its life cycle: a short-day photoperiod of 12-hour photophase (12 light:12 dark hours) at 23 °C induces diapause at the end of the final instar, whereas various photoperiods of 20:4, 16:8, 12:12, and 0:24 at warmer temperatures such as 25–29 °C result in some larvae entering diapause and others not (Enda and Kitajima Reference Enda and Kitajima1990; Togashi Reference Togashi2014). Diapause is terminated by exposure to constant 10 °C and 8 light:16 dark hours (Togashi Reference Togashi2014).
When Taiwanese M. alternatus alternatus larvae were reared singly in P. densiflora bolts at 25 °C and 16 light:8 dark hours, the probability of diapausing decreased with decreasing bark surface area, i.e., a proxy for amount of food available (Togashi Reference Togashi2014). A decrease in the amount of food available per larva is also caused by increasing the number of larvae per bark surface area. Thus, it is expected that larval crowding should reduce the probability of diapause. If M. alternatus alternatus exhibits inverse density-dependent diapause induction, one hypothesis is that the cause is food shortage. If this hypothesis is true, then I predict no difference between larval density classes in the relationship between diapause induction and amount of food available per larva. We would also predict no difference between different density classes in the relationship between diapause induction and body size of the adult, as the latter would reflect final larval size.
Reduced induction of diapause in relation to food shortages in M. alternatus alternatus may be an adaptation to their food supply system in which larvae are restricted to a single birth host for their entire development and the quality of the food source (phloem tissue of dying or recently dead pine trees) declines with time (Togashi Reference Togashi2014). Monochamus alternatus alternatus adults cannot predict when, where, and how many newly dead trees appear in a forest. The food for developing larvae is ephemeral because the inner bark is quickly consumed by various insects such as weevils and bark beetles (Coleoptera: Curculionidae) (Yoshikawa Reference Yoshikawa1987; Shibata and Togashi Reference Shibata and Togashi2002; Lindgren and Raffa Reference Lindgren and Raffa2013). The larvae have to complete development within a recently dead pine tree and cannot move to newly dead trees. In other words, there is no system to resupply new food resources for M. alternatus alternatus larvae in the field, as suggested for M. alternatus endai Makihara (Togashi Reference Togashi1991, Reference Togashi1995). Thus, foregoing diapause may be a better tactic for poorly growing M. alternatus alternatus larvae because an extended development time when further growth is not likely would likely increase mortality (Togashi Reference Togashi2014).
Larval foods are ephemeral and unpredictable for some species exhibiting inverse density-dependent diapause induction such as Calliphora vicina and Sarcophaga argyrostoma (Saunders Reference Saunders1975, Reference Saunders1997), whereas those are alive and reproducible for some species exhibiting density-dependent diapause induction such as Cydia pomonella and Diprion pini (Brown et al. Reference Brown, Berryman and Bogyo1979; Geri and Goussard Reference Geri and Goussard1989). Thus, if food shortage is related to inverse density-dependent diapause induction in M. alternatus alternatus, different food supply systems may elucidate the two different density-dependent responses of diapause induction.
The aim of this study was to investigate inverse density-dependent induction of diapause in M. alternatus alternatus larvae, to evaluate the influence of food shortage in the density dependency in relation to growth, to present a simple model for explaining positive and negative relations between adult body size and diapause induction for larvae inoculated in pairs on pine bolts, and to discuss the relationship between two types of density dependency of diapause induction and food supply system.
Materials and methods
Insects
Under the permission of the Minister of Agriculture, Forestry and Fisheries, Japan (21Y1218), a laboratory population of M. alternatus alternatus was established from six adults and six larvae (generation 0) that Dr. W. Toki had captured in Yangmingshan, Taipei City, Taiwan on 16 June 2010. Adults in generation 0 were placed singly in plastic containers, 8.5×17.5×4.0 cm, and fed with P. densiflora and P. thunbergii twigs. After maturing reproductively, they were paired in the containers and were provided with excised P. densiflora branches for oviposition. Eggs of generation 1 taken from branch sections were placed on wet tissue paper in Petri dishes and within 24 hours of hatch, larvae were inoculated singly on 20-cm-long bolts of P. densiflora trunks. Inoculated bolts were held under the constant conditions of 25 °C, 100% relative humidity, and 16 light:8 dark hours. Then adults that emerged from the bolts were discarded because the nondiapause phenotype is recessive to the diapause phenotype (K.T., unpublished data). At 140 days after larval inoculation, pine bolts that contained larvae in diapause were transferred to constant conditions of 10 °C, 100% relative humidity, and 8 light:16 dark hours to terminate diapause (Togashi Reference Togashi2014).
The diapause larvae were chilled for a mean of 142.1 days (standard error=0.6 days, range=140–154 days, n=31) (Togashi Reference Togashi2014). After that, they were returned to the original conditions. Twenty adults emerged from the pine bolts. They were reared in the same way as the parental generation and were paired on 22 and 26 February 2012. The eggs of generation 2 were obtained from those adults and were incubated in the same manner as the parental generation. Larvae within 24 hours of hatch were used in the experiment.
Pines
Four eight-year-old Pinus thunbergii trees of mean diameter±standard deviation of 8.8±0.8 cm at breast height were felled in Nishi-Tokyo City, Tokyo on 24 February 2012. The trunks were cut into 120-cm-long logs, placed in plastic bags, and held at fluctuating temperature between 7.4 °C and 12.6 °C. On 8 and 11 March 2012, logs were cut into 15-cm-long bolts and the cut ends were sealed with paraffin wax (melting point, 56–58 °C) to prevent desiccation. The bolts were placed in plastic bags and held at 25 °C before being used in the experiment. Blue-stain fungi discoloured part of the phloem and xylem of some pine bolts before larval inoculation, although the blue-stain fungus, Ophiostoma minus (Hedgcock) Sydow and Sydow (Ophiostomataceae), does not affect the growth and development of M. alternatus alternatus (Togashi et al. Reference Togashi, Miyauchi, Kusumoto and Matsushita2016).
Larval inoculation
A small disc of bark about 1 cm in diameter was removed from a pine bolt and then a depression was made on the exposed xylem with a carving knife. When oleoresin exuded from the exposed xylem, the depression was instead formed on the phloem under the outer bark. Newly hatched larvae were placed singly in the depressions and covered with the bark discs, which were fastened with adhesive tape.
Experiment: crowding effects on larval diapause and adult traits
Some larvae were inoculated singly on 64 P. thunbergii bolts and the others were done in pairs on the 41 remaining bolts. At the density of one larva per pine bolt (density 1), one larva was inoculated 2 cm away from the cut end of the bolt. For density 2, two larvae were inoculated 2 cm from opposite ends and on opposite sides of a pine bolt so as to maximise the distance between the larvae. Larvae were inoculated between 16 March and 7 May 2012 for density 1 and between 18 March and 9 May 2012 for density 2. There was no difference in the mean (±SE) size of pine bolts between the two density classes (one-way analysis of variance (ANOVA), F⩽0.05, df=1 104, P⩾0.824) with length=15.0±0.0 cm and diameter=6.7±0.2 cm for both densities pooled.
The inoculated pine bolts were placed in transparent containers at 25 °C, 100% relative humidity, and 16 light:8 dark hours and adult emergence recorded daily. The adults were sexed, and their body mass and elytron length were determined to the nearest 0.1 mg with electronic balance and to the nearest 0.05 mm with a vernier calliper.
When pine bolts did not produce M. alternatus alternatus adults during an initial incubation period of a mean of 149.2 days (standard error=0.4 days, range=140–154 days), they were dissected to obtain the diapausing larvae, pupae, and dead adults. Body mass, head capsule width, body colour, and presence or absence of faecal material in the intestine were recorded for each larva. Following Togashi (Reference Togashi2014), larvae were judged to be in diapause when they were yellowish white to yellow and lacked faecal material in the intestine. The larvae were placed singly in 9-cm-diameter Petri dishes 19 mm deep. To prevent desiccation, damp frass was removed from pine bolts and spread 6–9 mm deep on the bottom of the Petri dishes. Larvae were held at constant 10 °C and 8 light:16 dark hours for a mean of 307.8±2.2 days (279–321 days) and then returned to the original conditions of 25 °C and 16 light:8 dark hours. Adult eclosion was checked daily to record the date and sex. Body mass and elytron length were determined three days after eclosion, because M. alternatus endai adults take a mean of 3.6–4.4 days to emerge from dead trees at 25 °C (Kishi Reference Kishi1976). Females were dissected to determine the number of ovarioles.
Statistical analysis
Fisher’s exact test was used to compare the proportions of larvae undergoing diapause at density 1 versus density 2. Logistic regression analysis was applied to determine the relationship of larval diapause to bark surface area, the number of larvae inoculated per pine bolt (larval density), and their interaction. Larval density was categorical data and density 1 was used for reference. Likelihood ratio statistic was calculated using log-likelihood values of the model including constant alone and full model.
Analysis of covariance (ANCOVA) was used to determine the effects of initial larval density (L), induction of diapause (D), sex (S), bark surface area (A) (covariate), and all interactions on adult body mass (M), elytron length (E), and development time (T). When interaction terms with a covariate were found to be insignificant in the full ANCOVA model (M, E, or T=constant+L+D+S+A+L×D+L×S+L×A+ D×S+D×A+S×A+L×D×S+L×D×A+L×S×A+D×S×A+L×D×S×A, where cross means interaction of main effects), a reduced ANCOVA was run with bark surface area remaining as a covariate. ANCOVA was also used for determining the effects of larval density, sex, and body mass of larva in diapause on body mass of adult.
Linear regression analysis and Pearson’s correlation coefficient were used to show the relation between larval and adult body masses. One-way ANOVA was used to compare the length and diameter of pine bolts after Bartlett’s test of equal variances
Computation was performed using Systat 13 (Systat Software, San Jose, California, United States of America) and Statistix 7 (Analytical Software, Tallahassee, Florida, United States of America). Standard errors are reported with all means unless stated otherwise.
Results
Effect of crowding on diapause induction
In density 1, 25 adults (15 females; 10 males) emerged from bolts during the first period of incubation at 25 °C and 16 light:8 dark hours, after a mean of 94.0±2.9 days (75–134 days) from larval inoculation (Table 1). Dissecting these bolts revealed 30 live larvae in diapause and one live pupa (Table 2). The larvae had a mean body mass of 853.4±31.9 mg (533.6–1201.5 mg, n=28) and a mean width of head capsule of 3.82±0.04 mm (3.45–4.25 mm, n=30), indicating the fourth instar (Togashi et al. Reference Togashi, Kasuga, Yamashita and Iguchi2008). After exposure to 10 °C under 8 light:16 dark hours for a mean of 308.9±2.5 days (279–321 days), 26 of the larvae pupated. They developed to 10 female and 14 male adults, a mean of 26.6±0.6 days (23–37 days) after incubation at 25 °C and 16 light:8 dark hours (Table 1).
Effects of Monochamus alternatus alternatus larval density per Pinus thunbergii bolt and its diapause on adult body mass, elytron length, and time taken to development.
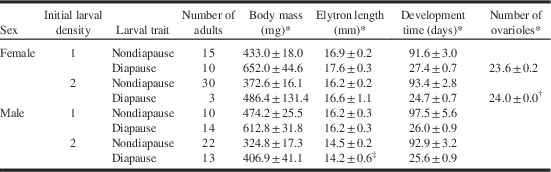
Notes: Development time is the time taken from the inoculation of first instar to adult emergence from pine bolt for nondiapause insects. For diapause larvae, it is the time taken to moult to adult after the end of chilling at 10 °C.
* Mean±standard error.
† Sample size=2.
‡ Sample size=12.
Monochamus alternatus alternatus in Pinus thunbergii bolts where one or two newly hatched larvae were inoculated.
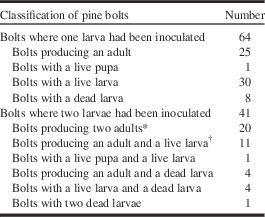
Notes: Developmental stages and physiological state of insects in bolts were examined 140–154 days after inoculation.
* Including a dead female adult.
† Including two dead adults.
In the case of density 2, a total of 52 adults (30 females; 22 males) emerged from bolts a mean of 93.2±2.1 days (76–139 days) after inoculation (Table 1). Dissection of bolts at the end of the first incubation period revealed 16 live larvae in diapause, one live pupa, two dead female adults, and one dead male (mean±standard error=148.2±0.7 days) (Table 2). Larval mean body mass was 583.5±51.9 mg (162.5–949.7 mg, n=16) and mean width of head capsule was 3.40±0.10 mm (2.70–3.85 mm, n=16), indicating five third instars and 11 fourth instars. Exposure to 10 °C and 8 light:16 dark hours for a mean of 305.8±4.4 days (279–321 days) resulted in 16 pupae that developed to three female and 13 male adults a mean of 25.4±0.7 days (22–34 days) after incubation at 25 °C and 16 light:8 dark hours (Table 1).
The incidence of diapause was calculated by dividing the number of larvae in diapause by the sum of number of larvae in diapause, pupae and adults at the end of the first incubation period. A significantly greater proportion of larvae entered diapause at density 1 (0.536=30/56) than at density 2 (0.222=16/72) (Fisher’s exact test, P<0.001).
Logistic regression analysis showed that diapause induction was not affected by the interaction between larval density and bark surface area, indicating that the response of diapause induction to bark surface area did not differ between larval densities (Table 3). Thus, with the interaction excluded, diapause induction was affected by bark surface area and larval density (likelihood ratio statistic=24.9, df=2, P<0.001) (Table 3). The probability of entering diapause was 0.232 times smaller at density 2 than at density 1 for larvae in pine bolts with equal bark surface area (odds ratio±standard error=0.232±0.097, 95% confidence interval=0.102–0.525) (Fig. 1). Probability of entering diapause increased with increasing bark surface area for both density 1 (likelihood ratio statistic=8.0, df=1, P=0.005) and density 2 (likelihood ratio statistic=4.2, df=1, P=0.040) (Fig. 1) (Table 3).
Relationship between diapause induction and bark surface area for Monochamus alternatus alternatus reared (A) singly and (B) in pairs, in Pinus thunbergii bolts. Values of 0 and 1 on the vertical axis indicate the aversion and induction of diapause, respectively. Circles show insects. Curves represent the probability of diapausing depending on the bark surface area; the dotted curve in Fig. 1B is the probability of diapausing versus per capita bark surface area.

Results of logistic regression analysis for effects of initial density of larvae (L), bark surface area of pine bolt (A) or bark surface area/larva (Ac), and adult mass (M) on induction of diapause in Monochamus alternatus alternatus.

Notes: Values of 1 and 0 were given to the induction of diapause and nondiapause, respectively.
* Regression coefficient or constant.
† Full model includes larval density, bark surface area, and their interaction as explanatory variables.
‡ Model excluding the interaction.
§ Density 1 is used as the reference.
|| Model for density 1.
¶ Model for density 2.
** Full model includes larval density and body mass of adult as explanatory variables.
SE, standard error.
To compare the effect of the amount of food available per larva on diapause induction between densities 1 and 2, the bark surface area per larva was calculated for each bolt at density 2. Then logistic regression analysis showed that diapause induction was not affected by the interaction between larval density and per capita bark surface area (Table 3). When excluding the interaction, the probability of entering diapause was affected by per capita bark surface area and constant, whereas it was not affected by larval density, revealing there was no difference in the diapause-inducing response to per capita amount of food available between densities 1 and 2 (likelihood ratio statistic=24.3, df=2, P<0.001) (Table 3). Probability of entering diapause increased as per capita bark surface area of pine bolt increased at density 2 in the similar manner to that at density 1 (likelihood ratio statistic=4.2, df=1, P=0.040) (Table 3) (Fig. 1).
Of 41 pine bolts that were inoculated with two larvae, 20 bolts produced two nondiapausing insects in the first incubation period and 12 produced one nondiapausing insect and one diapausing insect (Table 2). Interestingly, the pine bolts that produced nondiapausing insects had a wide range of bark surface area, between 160 and 507 cm2, whereas bolts that produced both nondiapausing and diapausing insects had bark surface areas of more than 308 cm2 (Fig. 2). Thus, the probability that a pine bolt produced a diapausing larva increased with bark surface area (Fig. 2) and was estimated to be 0.796 at a bark surface area of 500 cm2.
Relationship between bark surface area of Pinus thunbergii bolts and the probability that one of two Monochamus alternatus alternatus larvae undergoes diapause when inoculated in pairs on bolts. Bolts in which both insects developed to adults without diapause are represented by a probability of zero and bolts in which one larva entered diapause and the other did not are represented by a probability of 1. Circles indicate pine bolts. In logistic regression analysis, regression coefficient±standard error=0.0106±0.0054, Z=2.0, P=0.048 for bark surface area, constant±standard error=−3.937±1.812, Z=−2.2, P=0.030; likelihood ratio statistic=4.8, df=1, P=0.028.

Effects of crowding on larval growth and adult body size
The full ANCOVA model showed that adult body mass was not affected by any of the interactions of diapause, larval density or sex, with the bark surface area (Table 4), so a reduced ANCOVA was run with diapause, larval density, and sex as categorical variables and bark surface area as a covariate (reduced model, M=constant+ L+ D+ S+A+ L×D+ L×S+ D×S+ L×D×S). Adult body mass was affected by larval density, diapause, and bark surface area but not by sex or any interactions among the three main effects (Table 4). Mean body mass was heavier for adults that experienced larval diapause (546.2±27.4 mg, n=40) than those that did not (383.9±10.9 mg, n=77). Adults that emerged from bolts inoculated with one larva (537.5±19.6 mg, n=49) were heavier than those that emerged from bolts inoculated with two larvae (368.7±13.5 mg, n=68).
Analysis of variance tables for effects of initial density of Monochamus alternatus alternatus larvae (L), diapause (D), sex (S), bark surface area of Pinus thunbergii bolt (A), and their interactions on adult mass, elytron length, and development time, and ANOVA tables for effects of larval density (L), sex (S), and mass of larvae in diapause (W) on mass of adult that underwent diapause.

Note:
* L×D, L×S, L×A, D×S, D×A, S×A, L×D×S, L×D×A, L×S×A, D×S×A, and L×D×S×A.
Adult body mass was closely, positively correlated with the body mass of diapausing larvae (Fig. 3). Analysis of covariance showed that the body mass of adults that experienced larval diapause was not affected by any interaction between density, sex, and larval body mass (Table 4). Thus, when larvae in diapause were weighed, adult body mass was determined mainly by larval body mass and was not affected by larval density, sex, or their interaction (Table 4).
Adult body mass versus larval body mass for Monochamus alternatus alternatus that underwent larval diapause. Different symbols denote males or females that obtained from pine bolts that had been inoculated with larvae either singly or in pairs.

Analysis of covariance also showed that the elytron length was not affected by interactions between main effects and bark surface area (Table 4). The reduced ANCOVA with the bark surface area as a covariate showed that the elytron length was affected by density, sex, and bark surface area, but not by diapause or by any interaction between diapause, density, and sex (Table 4). Mean elytron length was greater for adults that emerged from bolts inoculated with one larva (16.7±0.1 mm, n=49) than for those that emerged from bolts inoculated with two larvae (15.3±0.2 mm, n=67). Females had longer elytra (16.6±0.2 mm, n=58) than males (15.2±0.2 mm, n=58).
Development time from bolt inoculation to adult emergence for nondiapausing larvae, and from return to 25 °C to adult eclosion for diapausing larvae was not affected by any interaction with bark surface area (Table 4). The reduced model showed that development was affected by diapause and bark surface area, but not by density, sex, or any interactions (Table 4). Mean time for diapausing insects to complete the post-diapause development (26.1±0.5 days, n=40) was shorter than that for nondiapausing insects to complete the development (93.4±1.7 days, n=77).
There was no difference in the number of ovarioles between females that developed in bolts inoculated with one versus two larvae (only diapausing insects measured) (Table 1).
Effects of crowding on the relation between larval growth and diapause induction
The probability of larval diapause was positively related to adult body mass but the slope of the regression differed between larvae reared singly versus in pairs, i.e., there was a significant interaction between larval density per bolt and adult body mass (Table 3) (Fig. 4). As adult body mass increased from 200 to 800 mg, the probability of larval diapause increased from 0.003 to 0.992 at density 1, and 0.111 to 0.745 at density 2 (Table 3) (Fig. 4). At density 2, large full-grown larvae did not necessarily enter diapause and small full-grown larvae did not necessarily develop uninterruptedly (Fig. 4).
Relationship between induction of larval diapause and adult body mass in Monochamus alternatus alternatus. The newly hatched larvae were inoculated on Pinus thunbergii bolts singly (a solid curve) or in pairs (a broken curve). Vertical axis represents the probability of diapausing. Actual data are not shown in this figure. In logistic regression analysis, likelihood ratio statistic=27.8, df=1, P<0.001 for density 1; likelihood ratio statistic=4.16, df=1, P=0.041 for density 2.

Of 41 bolts inoculated with two larvae, two live adults emerged from each of 28 bolts and the difference in body mass between the adult that emerged first versus second from the same bolt ranged from minus 185 mg to plus 420 mg (Fig. 5). The range of differences in body mass between the first-emerging versus second-emerging adults was greater in bolts with bark surface area >300 cm2 than in those with the bark surface area <300 cm2 (Fig. 5). When a diapause insect and a nondiapause insect were produced from the same bolt, six heavy adults had experienced diapause as larvae and three heavy adults had not, indicating that bark surface area (or available food) did not affect induction of diapause directly at density 2 but affected it through the larval interaction.
Relation between the difference in body mass between two early-emerging and late-emerged adults and the bark surface area of Pinus thunbergii bolt where the two Monochamus alternatus alternatus larvae were inoculated at the first instar. Solid circles show the difference in body mass between two diapause-averting adults. Open circles show the value of a diapause-averting adult body mass minus a diapause-experiencing adult body mass.

Discussion
This study has shown that for M. alternatus alternatus larvae reared on P. thunbergii bolts at a constant 25 °C, 16 light:8 dark hours, and 100% relative humidity, the proportion that underwent diapause was lower for insects reared two larvae per bolt (0.222) than one larva per bolt (0.536). That is, M. alternatus alternatus exhibited inverse density-dependent induction of diapause. The probability of diapausing increased with increasing bark surface area of pine bolts (a proxy for amount of food available), for larvae reared singly or in pairs (Fig. 1). Food shortage was a significant factor responsible for the inverse density-dependent diapause response.
Density-dependent induction of diapause has been found in more insect subfamilies than inverse density-dependent induction of diapause, although the literature is not extensive (Table 5). Our study adds M. alternatus alternatus to the list of species exhibiting inverse density-dependent response in diapause induction.
Characteristics of insects exhibiting the effect of population density on the incidence of diapause at preimaginal stages.

Notes:
* 1, Burges and Cammell (1964); 2, Barak and Burkholder (1977); 3, Strong (1975); 4, Beck (1971a, 1971b); 5, Archer and Strong (1975); 6, Burges (1962, 1963): 7, Nair and Desai (1972); 8, Wilson (1970) which is cited by Bell (1994); 9, Strong and Mead (1975); 10, Partida and Strong (1975); 11, Elbert and Levinson (1979); 12, Abdelghany et al. (2015); 13, Tschinkel and Willson (1971); 14, Nakakita (1982); 15, this study; 16, Botella and Mensua (1987); 17, Saunders (1975); 18, Saunders (1997); 19, Brown et al. (1979); 20, Bell and Bowley (1980); 21, Hagstrum and Silhacek (1980); 22, Tsuji (1959); 23, Välimäki et al. (2013); 24, Iwao (1956); 25, Geri and Goussard (1989).
FL, full-grown larva; EN, eonymph (prepupa); P, pupa; MS, mutual tactile stimulation between larvae; FP, faecal pellets; OF, old culture food; CF, contaminated with frass; FS, food shortage; RC, reduced developmental time; SBM, small body mass; BC, diapause-inducing substances deposited in diet by larvae.
Some proximate factors responsible for density dependency have been reported so far: mutual tactile stimulation, biological conditioning by faeces or diapause-inducing substances, body mass, and reduced developmental time by overcrowding, which is shorter than the number of short-day cycles required to induce diapause (Table 5). Thus, this study is the first to report that food shortage is a factor responsible for density dependency of diapause induction.
Amount of food available determines body mass of final instars through growth, which may be divided into rate and period of growth. If body mass at the end of the final instar determines the probability of entering diapause, as shown in the noctuid moth, Helicoverpa armigera (Hübner) (Lepidoptera: Noctuidae) (Liu et al. Reference Liu, Gong, Li and Wei2010), and the blowfly, Calliphora vicina (Saunders Reference Saunders1997), then the relationship between larval body mass and diapause induction should not differ between the two density classes. However, the relationship between probability of diapause induction and adult body mass was different for M. alternatus alternatus larvae that developed one per bolt versus two per bolt (Fig. 4). Also, in bolts that produced two adults, one from a nondiapausing larva and the other from a diapausing larva, the adult body mass of the latter was sometimes lighter than the former and in other cases the reverse was true (Fig. 5). Thus, we have to discard the hypothesis that the probability of diapause induction is determined directly by the body mass of full-grown larvae. We instead have to take account of the effect of larval interaction on diapause induction, because one of the two larvae may prevent the other from feeding freely. The process of growth may be more important in inducing diapause and nondiapause than the result of growth, i.e., larval mass at the end of final instar.
It is reasonable to assume a positive correlation between larval growth rate in late instars and diapause induction because heavy adults tended to undergo diapause during the larval stage whereas light adults tended to forego it. Under this assumption, for a single larva on a bolt, growth rate may be largely determined by the amount of food available; a late instar with high growth rate would undergo diapause and emerge as a relatively large adult, whereas a late instar with low growth rate would forego diapause and emerge as a relatively small adult (Fig. 6A).
Diagram of the proposed mechanism of inversely density-dependent diapause induction in Monochamus alternatus alternatus. When reared singly, induction of diapause is determined by larval growth rate, which is related to the amount of food available (A). When reared in pairs, a larva that grows fast in the early larval stages enters diapause if the high growth rate is maintained in the later instars. As the result, the other develops to pupa uninterruptedly because of a low growth rate (B). If a fast growing larva reduces the growth rate in the late part of larval stage and leaves the pine bolt as an adult, the other gains a high growth rate and enters the diapause (C). Solid and broken lines show the high and low growth rates, resulting in the induction and aversion of diapause, respectively.

Under the assumption of a positive correlation between larval growth rate and diapause induction, I propose scenarios that might explain how various interactions among larvae feeding in the same bolt may mediate the relationship between amount of food available and larval growth rate which, in turn, is related closely to probability of diapause induction and adult body size (Fig. 6). For two larvae inoculated on a single pine bolt with an insufficient amount of food available for full growth of both larvae, they will grow at a low rate, resulting in both larvae foregoing diapause. When two larvae are inoculated on a bolt with sufficient food for full growth of each larva, the growth rate of one larva is determined by the initial amount of food available and its sensitivity to the other larva, i.e., the extent to which the rate of food consumption by one larva is reduced by the other. If one of the larvae prevents the other from feeding sufficiently, one larva may maintain a high growth rate, enter diapause, and emerge as a large adult, while the other larva may grow more slowly, forego diapause, and emerge as a smaller adult (Fig. 6B).
In still another scenario, if one of two larvae grows fast in the early instars but subsequently slows its growth rate in later instars in response to the other larva, it may forego diapause and yet emerge as a relatively large adult. By contrast, another larva might grow slowly during the early instars but attain high growth rate in later instars due to disappearance of the competing larva, undergo diapause, and emerge as a relatively small adult (Fig. 6C). When larvae were inoculated in pairs on 58 15-cm-long P. thunbergii bolts of 2.9–8.6 cm in diameter, there was found a great difference in body mass of three-week-old larvae between 24 and 352 mg at 25 °C (K.T., unpublished data). This observation suggests it is a likely scenario because small larvae feed on leftover food. Transferring young larvae of different growth rates between different density classes may verify those scenarios.
A genetic component may also be associated with the suppressive effect of food shortage, therefore larval crowding, on diapause induction in M. alternatus alternatus. Unlike the Taiwanese subspecies, larvae of the Japanese subspecies enter diapause when reared on pine bolts at 25 °C and 16 light:8 dark hours. Reciprocal crossing between the Japanese and Taiwanese subspecies produced diapause offspring (K.T., unpublished data), indicating that the nondiapause phenotype is recessive to the diapause phenotype. Artificial selection for nondiapause insects of the Taiwanese subspecies resulted in low incidence of diapause of 0–9% in sixth or further generations at a density class of one larva per bolt, showing quick disappearance of “diapause-inducing” genes (K.T., unpublished data). Further studies are needed to determine effects of genetic component, temperature, photoperiod, crowding, and their interactions on diapause induction in M. alternatus alternatus.
Why is diapause induction directly density-dependent in some insects and inverse density-dependent in others? As mechanical stimulation between insects is related to both types (Table 5), it is difficult to connect proximate diapause-inducing factors with the two types of density dependency. Food items also cannot explain the difference between two types of density-dependent diapause induction, because they overlap between the two groups in stored product insects (Table 5), although Danks (Reference Danks1987) points out that S. argyrostoma, which exhibits inverse density-dependent induction of diapause, feed collectively on a somewhat ephemeral food supply.
Burges (Reference Burges1963) states that diapause in arthropods commonly fulfils one or more of three functions: the survival of food shortage, the survival of an unfavourable period such as winter, and the synchronising of adult emergence. Considering the three functions, it is reasonable to assume that the density dependency of diapause induction is related closely with food shortage, because it is found under specified constant conditions suitable for development in the laboratory. However, in tenebrionid beetles, Tschinkel and Willson (Reference Tschinkel and Willson1971) infer that the ultimate factors responsible for density-dependent induction of diapause are cannibalism of prepupae and newly eclosed adults by large active larvae and other adults, respectively.
Enhanced larval density may be a reliable cue of future depletion of food for the current (and following) generations. Therefore, larvae at a high density must halt development as larvae or pupae or disperse as adults to locate the food for offspring. When fresh food such as new leaves of host plants and newly stored cereal and commodities in warehouses is re-supplied periodically or intermittently to insects, it is considered that diapause at larval and pupal stages enhances fitness because of no risk of post-diapause food shortage, leading to a density-dependent induction of diapause. By contrast, when fresh food is not expected to be re-supplied, insects at high density do better to continue their development uninterruptedly and leave the birthplace as adults, because insects at preimaginal stages may diminish in body mass and increase in mortality during an extended duration of diapause (Saunders et al. Reference Saunders, Wheeler and Kerra1999; Matsuo Reference Matsuo2006). This explanation has already been applied to the reduced diapause induction in M. alternatus alternatus larvae that are short in food (Togashi Reference Togashi2014).
Examples of species exhibiting density-dependent induction of diapause, are Cydia pomonella, Chiasmia clathrata, Naranga aenescens Moore (Lepidoptera: Noctuidae), and Diprion pini for which post-diapause individuals may expect to encounter fresh food sources of apples (Malus Miller; Rosaceae), Lathyrus pratensis Linnaeus (Fabaceae) leaves, rice plant leaves (Oryza Linnaeus; Poaceae), and needle foliage, respectively, at the same sites the following year. The tenebrionid Zophobas rugipes Kirsch (Coleoptera: Tenebrionidae) lives in fruit-bat guano in caves (Tschinkel and Willson Reference Tschinkel and Willson1971). The stored product insects, Plodia interpunctella (Hübner) (Lepidoptera: Pyralidae), Cadra cautella (Walker) (Lepidoptera: Pyralidae), and seven other tenebrionids are also expected to receive newly harvested cereal and other commodities every year.
By contrast, among species exhibiting inverse density-dependent induction of diapause, two dipteran flies, Calliphora vicina and Sarcophaga argyrostoma deposit eggs on recently dead animals (Saunders Reference Saunders1975; Saunders et al. Reference Saunders, Wheeler and Kerra1999) and M. alternatus alternatus lays eggs on the trunks and branches of recently dead pine trees. Dermestid beetles as a group appear to have been primarily confined to feeding on substances of animal origin (Nair and Desai Reference Nair and Desai1972) and essentially scavengers (Bell Reference Bell1994), although they feed on various food items such as wheat (Triticum Linnaeus; Poaceae), pollen, dog food, and dead moths when provided (Archer and Strong Reference Archer and Strong1975; Partida and Strong Reference Partida and Strong1975; Strong Reference Strong1975; Strong and Mead Reference Strong and Mead1975). Thus, original food items are unpredictable, ephemeral resources in time and space for C. vicina, S. argyrostoma, M. alternatus alternatus, and dermestid beetles, and larvae have limited or no ability to disperse to new food sources, once the food in the birth host is depleted.
Thus, it appears that the effect of insect density on diapause induction is likely to be related closely to the relative availability of suitable food throughout larval development. In species like M. alternatus alternatus, for which the food resources are ephemeral and unpredictable in time and space, and larvae are restricted to their birth host, diapause induction is inversely density-dependent, whereas in species like Cydia pomonella and Naranga aenescens, for which the food resources are more predictable because food plants sprout and produce fruits at the same place each year, diapause induction is more likely to be directly density-dependent.
Acknowledgements
The author is grateful to Dr. W. Toki for providing the Taiwanese M. alternatus alternatus; to the staff of Tanashi University Forest, University of Tokyo, for helping transfer pine logs; and to the subject editor and two reviewers for making invaluable comments and suggestions. This work was supported in part by JSPS KAKENHI grants (22380081 and 26292080). Introduction of prohibited species was permitted under special conditions by Minister of Agriculture, Forestry and Fisheries, Japan (21Y1218).



