


INTRODUCTION
Among the most prominent and enduring political cleavages is the divide between rural and urban regions. This “town–country” split has long been considered central to economic interests, class conflict, and struggles for political power (Lipset and Rokkan Reference Lipset and Rokkan1967; Marx Reference Marx and Engels1887; Rodden Reference Rodden, Jenkins and Rubin2024). These fault lines remain highly salient. Throughout the world, electorates in rural and urban communities continue to be divided (Gimpel et al. Reference Gimpel, Lovin, Moy and Reeves2020; Huijsmans and Rodden Reference Huijsmans and Rodden2025; Rachman Reference Rachman2018; Taylor et al. Reference Taylor, Lucas, Armstrong and Bakker2023).
While the persistence of the rural–urban schism is often attributed to the cultural contrasts of the socially conservative hinterland and cosmopolitan cities, its mounting depth in recent decades has also been ascribed to economic shocks that disproportionately affect rural communities (Brown and Mettler Reference Brown and Mettler2024; Reference Brown and Mettler2025). The “left behind” thesis suggests that rising support for anti-establishment and anti-globalist parties and leaders is a response to economic decline and depopulation due to automation, import competition, and deindustrialization (Autor et al. Reference Autor, Dorn, Hanson and Majlesi2020; Baccini and Weymouth Reference Baccini and Weymouth2021; Broz, Frieden, and Weymouth Reference Broz, Frieden and Weymouth2021; Colantone and Stanig Reference Colantone and Stanig2018).
Although these shocks have often been more acute in rural than urban areas, however, the resulting backlash against trade and globalization has not been confined to the countryside. It has also emerged in various peripheral urban regions (de Lange, van der Brug, and Harteveld Reference de Lange, van der Brug and Harteveld2023; Dijkstra, Poelman, and Rodríguez-Pose Reference Dijkstra, Poelman and Rodríguez-Pose2020; Ziblatt, Hilbig, and Bischof Reference Ziblatt, Hilbig and Bischof2024). Furthermore, this backlash is frequently described as the revenge of “places that don’t matter” directed against political elites, reflecting deep frustration and a visceral reaction to economic decline, rather than a calculated response motivated by material interests (Rodríguez-Pose Reference Rodríguez-Pose2018). By contrast, earlier theories viewed rural–urban cleavages as the product of conflicting material interests among landowning elites, capitalists, and laborers, shaped by relative factor endowments and changing exposure to international trade (Hiscox Reference Hiscox2002; Rogowski Reference Rogowski1989).
This article offers an alternative perspective on the economic roots of the rural–urban divide, emphasizing the central role of agriculture in rural communities. Agriculture is the sector most directly and uniquely tied to rural regions. Farming also tends to be highly concentrated in areas that have limited employment options in alternative sectors. Consequently, in rural communities, people typically are either employed in agriculture or indirectly affected by this sector (Brülhart and Traeger Reference Brülhart and Traeger2005; Rickard Reference Rickard2018). We therefore expect that the extent to which the trade and voting preferences of rural residents vary from their urban counterparts hinges on whether they live in an area that has a comparative advantage in agriculture. In regions lacking a comparative advantage, farming products are uncompetitive in both domestic and international markets. Rural residents and workers in such regions are likely to learn about the dangers to their communities and jobs posed by trade and to hold protectionist views. Conversely, in regions with a comparative advantage in agriculture, trade offers economic opportunities to rural dwellers and workers, and we expect them to hold more favorable views of overseas commerce as a result. When agriculture—an economic mainstay and key component of rural identity—comes under threat from international competition, rural voters are inclined to support protectionist parties and policies.
To test this hypothesis, we initially compile a harmonized, individual-level dataset drawn from virtually all cross-national surveys that have included items on trade preferences over the past three decades. Our Global Trade Attitudes (GTA) data cover 123 countries and span the period from 1995 to 2019. Whereas the few previous studies addressing rural–urban splits in trade attitudes have focused largely on advanced industrial economies, our sample comprises both developed and developing countries and includes all regions of the world (Baker Reference Baker2005; Kawaguchi and Ogura Reference Kawaguchi and Ogura2024; O’Rourke and Sinnott Reference O’Rourke and Sinnott2001). In addition, using product-country-year data on revealed comparative advantage (RCA), we construct new time-varying measures of countries’ competitiveness in agriculture and match them to our survey dataset.
Our analysis of this new global dataset generates several notable findings. First, we find that the gap in trade attitudes between rural and urban residents depends on the competitiveness of a country’s agricultural sector. In countries with a revealed comparative advantage in agriculture, rural residents are no more protectionist than other citizens. Conversely, in countries with a comparative disadvantage, rural dwellers express significantly stronger opposition to trade. Notably, this attitudinal difference emerges around the threshold between comparative advantage and disadvantage, suggesting that rural communities are highly responsive to their country’s agricultural competitiveness. Furthermore, the influence of the competitiveness of agriculture on the trade attitudes of rural residents is observable for low-income, middle-income, and high-income countries. Regardless of economic development, rural citizens seem to form attitudes toward international trade with an eye toward the economic costs and benefits of global integration.
Second, our results demonstrate that rural individuals do not react only to their position in the labor force. Regardless of personal income, employment status, or whether an individual works in farming, we find that the trade policy preferences of rural individuals reflect the broader interests of the agricultural sector and the local community. Moreover, while seminal models of the political economy of trade emphasize the role of factor ownership in the emergence of the rural–urban divide, our results suggest that rural residents’ alignment with rural interests is not determined by whether they are wage-earning laborers or landowning farmers (Rogowski Reference Rogowski1989; Scheve and Serlin Reference Scheve and Serlin2025). These findings accord with the view that economic and cultural factors affecting policy preferences and voting behavior are deeply enmeshed (Baccini and Weymouth Reference Baccini and Weymouth2021; Ballard-Rosa et al. Reference Ballard-Rosa, Malik, Rickard and Scheve2020; Hopkins, Margalit, and Solodoch Reference Hopkins, Margalit and Solodoch2024; Margalit, Raviv, and Solodoch Reference Margalit, Raviv and Solodoch2025). Both cultural and economic factors seem to align rural residents with their class-based group and community. Economic considerations about the impact of market integration on their local community then determine whether they support trade liberalization or protectionism.
Third, focusing on European Union (EU) countries in our GTA dataset, together with data on parties’ pre-election manifestos, allows us to assess whether agricultural competitiveness in subnational regions also influences support for international trade and voting behavior. Our results show that subnational RCA not only shapes the rural–urban divide in trade preferences, but also has important electoral consequences. Rural voters’ support for pro-farmer parties and parties that embrace economic nationalism declines significantly when their region possesses a comparative advantage in agricultural products and thus stands to benefit from global integration. These effects are politically consequential for the broader divide between town and country: the well-known right-wing advantage in rural areas is concentrated in agriculturally uncompetitive regions and nearly disappears in competitive ones.
In the final part of the study, we focus on the United States following the establishment of the North American Free Trade Agreement (NAFTA) in 1994. Beyond broadening the external validity of our analysis, the American case strengthens causal identification of the effects of agricultural comparative advantage and allows us to test its underlying mechanisms more directly. Specifically, we leverage exogenous subnational variation in agricultural comparative advantage following NAFTA based on potential crop yields given the suitability of soil to produce different crops across U.S. congressional districts (Amodio et al. Reference Amodio, Baccini, Chiovelli and Di Maio2022) together with data on voters’ economic perceptions and residential tenure.
The analysis reveals a stark difference between districts with competitive and uncompetitive agricultural sectors. While rural voters living in uncompetitive districts are substantially more protectionist than their urban counterparts, there is no rural–urban split in competitive districts. Rural voters respond to agricultural comparative advantage in ways that closely correspond to their community’s interests, whereas suburban and urban voters remain largely unaffected.
Focusing on the two presidential elections in the immediate aftermath of NAFTA, we also find that the competitiveness of farming influenced the ballots cast by rural voters. NAFTA increased the competition from Canada and Mexico faced by U.S. farmers. In rural areas with a comparative disadvantage in agriculture, voters were significantly less likely to support the Democratic presidential candidate—Bill Clinton in 1996 and Al Gore in 2000, both of whom championed the pact (Choi et al. Reference Choi, Kuziemko, Washington and Wright2024). Using data on pre-NAFTA voting, we also find evidence that this pattern reflects post-NAFTA defections among rural voters in agriculturally uncompetitive areas, rather than differences in voting behavior that predated the trade agreement.
Beyond causal identification, these findings reveal that local community-based considerations, rather than broader class-based concerns, shape trade and voting preferences among rural voters. They also show that contextual effects of economic geography—rather than composition effects reflecting the sorting of nationalist individuals into the countryside and cosmopolitan individuals into cities—account for the political frictions between rural and urban individuals. Without denying the importance of compositional effects, especially in times of mass migration (Maxwell Reference Maxwell2019; Scheve and Serlin Reference Scheve and Serlin2025), our results shed new light on the causal mechanisms underlying the rural–urban cleavage over economic globalization.
In addition to their implications for research on the origins of the rural–urban divide, our findings also bear on studies of trade policy. Despite ongoing negotiations in the World Trade Organization (WTO) and other international settings, agricultural trade barriers remain stubbornly high. The most common explanation for this persistence is the potent influence of agricultural interest groups in many countries (Gawande and Hoekman Reference Gawande and Hoekman2006; Grossman and Helpman Reference Grossman and Helpman1994). A second explanation is that the mass public supports agricultural protectionism in various parts of the world (Naoi and Kume Reference Naoi and Kume2011). Our study highlights yet another, and often overlooked, source of influence: rural voters. These voters are closely aligned with local agricultural interests and bolster the political influence wielded by protectionist and pro-farmer parties, which often work to restrict agricultural imports in countries lacking a comparative advantage in farm products. While the mass public generally has little understanding of trade, rural voters—who live in smaller, tighter-knit communities with a more homogeneous economic composition than their urban counterparts—seem to have a better grasp on the distributional effects of overseas commerce (Rho and Tomz Reference Rho and Tomz2017). But contemporary research on trade attitudes, with its strong focus on the divide between low-skilled and high-skilled workers, has largely overlooked the rural–urban divide.
RURAL VOTERS AND THE COMPETITIVENESS OF AGRICULTURE
The Heckscher–Ohlin (HO) model, together with the Stolper–Samuelson theorem, has long served as a foundational framework for understanding the distributional consequences of international trade and the associated political cleavages that arise within countries. This framework posits that a country’s comparative advantage is determined by its relative abundance of factors of production—labor, land, and capital—that are perfectly mobile. Expanding international trade is expected to benefit locally abundant factors and harm locally scarce factors. Various studies have concluded that these distributional effects contribute to broad political coalitions: either a class cleavage, when the interests of land and capital diverge from the interests of labor; or a rural–urban cleavage, when the interests of land and capital collide, and labor forms a coalition with one of them (Hiscox Reference Hiscox2002; Rogowski Reference Rogowski1989).
Often overlooked, however, is that such a rural–urban divide reflects a conflict between rural and urban elites, rather than the mass public. Since owners of different factors have competing interests over trade policy, conflict should arise among landowners, capitalists, and laborers. Only labor is associated with the mass public. Land and capital are almost invariably owned by elites. In this framework, typical rural residents—even agricultural workers—are laborers whose interests should align with those of laborers in urban settings.Footnote 1 Unlike the landowning elite, the landless rural population is expected to support restricting trade when labor, rather than land, is relatively scarce.Footnote 2
The Ricardo–Viner (RV) model is an alternative framework for addressing the distributional consequences of trade (Alt et al. Reference Alt, Frieden, Gilligan, Rodrik and Rogowski1996; Frieden Reference Frieden1991; Hiscox Reference Hiscox2002). This model assumes that, at least in the short run, some factors of production are specific to the particular industries in which they are employed, rather than perfectly mobile. As such, their returns are tied to the fortunes of those industries. Where agriculture is competitive, farm workers and owners are expected to support trade because it creates economic opportunities. Where this sector is uncompetitive, they are expected to oppose trade because it threatens their economic interests.
By rural residents, we are referring to individuals living in less-populous communities outside metropolitan areas, without implying any specific occupation, land ownership, or local economic specialization. Since the classic RV model is egocentric, it cannot explain why rural residents who work outside of agriculture would share the economic interests and trade preferences of people directly employed or invested in this sector. Moreover, in many countries—particularly in the advanced economies—most rural dwellers are neither farmers nor peasants. Nonetheless, there is reason to expect that agriculture also influences individuals who live in rural areas but are not directly affected by farming. Because agriculture has an outsized impact on the economy of most rural areas, its fortunes are usually tightly linked to the community’s material well-being and interests (Ballard-Rosa, Carnegie, and Schonfeld Reference Ballard-Rosa, Carnegie and Schonfeld2023; Thomson Reference Thomson2019).Footnote 3
Existing research has demonstrated that agriculture’s impact ripples throughout the local economy. In addition to its direct effects on farms and farm workers, the competitiveness of agriculture indirectly affects the local economy by influencing the demand for farm equipment, seeds, pesticides, and fertilizer, as well as food processing, banking, and transportation. Farming also has “induced” multiplier effects on the local economy, influencing businesses such as retailers, restaurants, and service providers that depend on spending by farm workers and owners, as well as individuals employed by companies that support agriculture. The agricultural sector not only affects individuals in rural communities, but also affects the local tax base and, consequently, the quality of local infrastructure and public services in many countries. Studies of both the Global South and the OECD conclude that these agricultural multiplier effects are often sizable, though their magnitude depends on a host of factors, including the community’s sectoral composition and proximity to urban areas (Haggblade, Hazell, and Dorosh Reference Haggblade, Hazell, Dorosh, Haggblade, Hazell and Reardon2007; OECD 1998; 2020; Snodgrass Reference Snodgrass2014).
This intuition is formalized in a more recent extension of the RV framework—the specific-factors model of regional economies—which predicts that trade liberalization in agriculture should have larger effects on local wages when agriculture accounts for a greater share of local employment (Kovak Reference Kovak2013). Applied to our context, this extension implies that the spillover effects of agricultural comparative advantage should be strongest in rural communities and attenuated in urban areas, where agriculture constitutes only a small fraction of local employment.
These economic spillovers may have even broader political effects due to sociotropic considerations (Mansfield and Mutz Reference Mansfield and Mutz2009). Individuals may value the collective welfare of their community and form trade attitudes based on what they view as optimal for the area as a whole. When the local economy is more dependent on the competitiveness of agriculture, even residents who are not directly affected by trade may still align with agricultural interests in pursuit of their community’s collective welfare. Rural dwellers in particular tend to display a greater sense of belonging and attachment to the community than their urban counterparts (OECD 2025, 70). In many countries, agriculture also shapes the culture and identity of rural communities. When local agriculture is uncompetitive, trade therefore threatens not only the economic well-being but also the social and cultural foundations of these areas.Footnote 4
Adding to the community-wide effects of agricultural competitiveness is that workers often face significant costs if they attempt to move across local labor markets (Flaherty Reference Flaherty2025). As such, consistent with the specific-factors model of regional economies, inter-regional labor mobility is highly imperfect (Dix-Carneiro and Kovak Reference Dix-Carneiro and Kovak2017; Kovak Reference Kovak2013). One implication is that individuals in economically distressed regions often cannot easily relocate to thriving regions.
Of course, there have been eras in which inter-regional labor mobility was relatively high. For example, Scheve and Serlin (Reference Scheve and Serlin2025) find that greater market integration in agricultural regions across the United States during the late nineteenth century attracted new migrant workers, reduced the proportion of farmers, and precipitated a rise in protectionist trade policy. To explain these findings, they develop a spatial version of Rogowski’s (Reference Rogowski1989) seminal theory derived from the HO model. In their account, labor is mobile, and workers migrate freely across regions within a country. This assumption is plausible and fits the case of the United States during the Age of Mass Migration. Millions of foreign-born workers entered the U.S. labor market during this period, searching for employment without being firmly rooted in place. Given these circumstances, it is reasonable to expect that higher wages in the export-oriented agricultural hinterland will be rapidly equalized across regions due to the in-migration of predominantly foreign-born workers. As Scheve and Serlin acknowledge, however, internal migration in the United States has declined steadily since the 1980s, and even major economic shocks—such as the China trade shock—have prompted only limited relocation. This is one of the primary reasons why many workers from “left behind” places struggle to adjust and recover from trade-induced shocks (Autor, Dorn, and Hanson Reference Autor, Dorn and Hanson2021; Lim, Aklin, and Frank Reference Lim, Aklin and Frank2023).
In sum, farmers are the primary losers from trade when local agriculture is uncompetitive. The sectoral composition of rural communities creates a wider circle of residents who do not work in agriculture but nonetheless share the costs of open trade. Community ties in rural areas further extend this circle, encompassing residents who may not be directly affected by trade but still align with local agriculture for sociotropic reasons. These dynamics generate asymmetric responses to agricultural competitiveness. While rural voters are likely to be affected by and concerned about the fortunes of local agriculture, urban voters typically are not. Even where urban regions are historically linked to agriculture or geographically proximate to it, agriculture is too small and too weakly embedded in the urban economy and social networks to trigger similar spillovers or collective identification. As a result, although agricultural comparative disadvantage primarily shapes rural political behavior, it also contributes to widening political polarization between rural and urban areas. Taken together, these considerations motivate our Agricultural Interest Trade Preferences Hypothesis: rural residents will be more protectionist than their urban counterparts when local agriculture is uncompetitive, but more supportive of international trade when local agriculture possesses a comparative advantage.Footnote 5
The competitiveness of a country’s agricultural sector may not only shape how rural residents think about trade, but also how they vote. In democracies, voters living in the countryside are expected to support parties whose platforms align with the interests of local agriculture and farmers. These proposed policies often include subsidies or changes to the tax code that boost the competitiveness of farm products at home and abroad, as well as restrictions on agricultural imports and other efforts to bolster food security. In contexts where local agriculture faces a comparative disadvantage, policies that shield farmers from international competition or provide targeted support are likely to be particularly attractive to rural electorates. By contrast, where agriculture is internationally competitive, rural voters may be more receptive to trade openness and free market policies.
Voting to support local agricultural interests, however, can take different shapes and forms. Across much of Western Europe, for example, Christian Democratic parties have historically drawn disproportionate support from rural voters and farmers and have endorsed policies aimed at protecting and subsidizing agricultural production (Almond Reference Almond1948; Bale and Szczerbiak Reference Bale and Szczerbiak2008; Duncan Reference Duncan2015; Lyon Reference Lyon1967).Footnote 6 In other cases, far-right parties have adopted protectionist platforms to help mobilize rural and agricultural constituencies, as illustrated by the French Front National’s turn toward agricultural protection in the mid-1990s (Ivaldi and Gombin Reference Ivaldi and Gombin2015).Footnote 7 Rural voters may also hold historical, ideological, or cultural attachments to these parties that extend beyond economic policy, but support for them is especially likely to intensify when local agriculture is uncompetitive.
Importantly, alignment between voting behavior and local agricultural interests need not imply consistent support for a particular party type. In some contexts, political responses to trade liberalization may instead take the form of retrospective or anti-incumbent voting. This logic is particularly relevant in two-party systems, such as the United States, where explicitly agrarian or pro-farming parties are largely absent. In such settings, rural voters in agriculturally uncompetitive regions may punish incumbent governments for liberalizing trade policy. Thus, while the partisan expression of agricultural grievances may vary across electoral systems and institutional contexts, the underlying political logic is consistent and reflected in the following Agricultural Interest Voting Hypothesis: rural voters are more likely to support the party or candidate whose trade and economic policies most closely align with local agricultural interests.
EMPIRICAL APPROACH
To address the rural–urban divide on international trade and the role of agricultural comparative advantage in shaping any such cleavage, we employ a two-part empirical strategy. First, we examine the rural–urban split in trade attitudes across countries and over time, assessing the extent to which it depends on RCA in agriculture. We then turn to subnational evidence from the EU, where we analyze how the interaction between rural status and regional agricultural competitiveness shapes both trade preferences and voting behavior. In the second part, we leverage exogenous subnational variation in agricultural productivity in the United States post-NAFTA to analyze the effects of comparative advantage on rural voters’ trade and electoral preferences. In each part, we begin with a description of the research design, data, and measures, followed by the empirical analysis.
CROSS-NATIONAL DESIGN
The Global Trade Attitudes Dataset
To test our hypotheses, we compile a harmonized dataset of all available cross-national surveys on mass attitudes about international trade (Mansfield and Solodoch Reference Mansfield and Solodoch2026). Our focus is on public support for increasing international trade or limiting the import of foreign goods. In the process of identifying cross-national surveys, we therefore exclude surveys or specific survey waves that focused on other aspects of trade attitudes. Still, each survey included in the GTA dataset uses a different question to measure trade preferences (see Section A of the Supplementary Material).
The measurement of rurality in most source surveys is relatively straightforward because they provide a distinct category for rural localities.Footnote 8 In three of the source surveys that do not include this category, we instead rely on information about the population of local communities, classifying the least populous categories as rural (typically those with up to 5,000 or 10,000 inhabitants).
To account for any effects caused by the way different surveys measure rurality and trade preferences, we include survey fixed effects in all of the following regression analyses. In addition, we identify countries that were surveyed by more than one organization at roughly the same time and assess the degree of variation in the factors driving opinions about trade. We find that the sign and size of our point estimates remain stable across surveys that used different measures of rurality or trade preferences, suggesting that our primary results are not particularly sensitive to framing or measurement effects within the bundle of selected questions in the GTA dataset (Figures A-1 and A-2 in the Supplementary Material).
In each survey, we extract sociodemographic characteristics that are sufficiently comparable across countries and over time to adjust for individual-level covariates. Based on these criteria, we construct measures of age, gender, education, income, employment status, and—in many cases—an indicator variable for agricultural workers based on respondents’ occupation or sector of employment. In total, the GTA dataset includes 384,194 respondents from 123 countries who were surveyed between 1995 and 2019. Figure 1 plots the geographic coverage and the pooled sample size of each country included in this compilation. Table 1 presents the number and proportion of observations that each cross-national survey contributes to the GTA dataset by decade.
Countries Covered by the Global Trade Attitudes Dataset

Figure 1. Long description
A choropleth world map uses color coding to indicate sample sizes. A legend in the Southwest corner defines four categories. Lightest blue represents less than 1,000. Medium blue represents 1,000 to 3,000. Darkest blue represents greater than 3,000. White indicates no data.
In North America, the United States is dark blue, while Canada and Mexico are medium blue.
In South America, Brazil and Argentina are dark blue, while most other countries like Chile, Peru, and Colombia are medium blue.
In Africa, there is a mix of medium and dark blue. Dark blue is concentrated in Western and Southern regions including Nigeria and South Africa. Several Central and Eastern nations are white, indicating no data.
In Europe, most Western and Northern countries are medium blue, while Russia is dark blue.
In Asia, China, India, and Indonesia are dark blue. Southeast Asian countries like Thailand and Vietnam are medium blue. Much of the Middle East and Central Asia is white.
In Oceania, Australia is dark blue and New Zealand is medium blue.
Sample Size by Survey and Decade

Table 1. Long description
The table consists of six columns: Survey, 1990s, 2000s, 2010s, Total, and %.
* I S S P: 26,103 in 1990s; 43,330 in 2000s; 44,222 in 2010s; Total 113,655 (30%).
* Asian Barometer: 0 in 1990s; 12,687 in 2000s; 60,274 in 2010s; Total 72,961 (19%).
* Afrobarometer: 0 in 1990s; 22,509 in 2000s; 47,826 in 2010s; Total 70,335 (18%).
* W V S: 65,035 in 1990s; 0 in 2000s; 0 in 2010s; Total 65,035 (17%).
* Latino Barometer: 0 in 1990s; 0 in 2000s; 19,050 in 2010s; Total 19,050 (5%).
* Gallup: 0 in 1990s; 0 in 2000s; 17,288 in 2010s; Total 17,288 (4%).
* Arab Barometer: 0 in 1990s; 0 in 2000s; 13,722 in 2010s; Total 13,722 (4%).
* A S E S: 0 in 1990s; 12,148 in 2000s; 0 in 2010s; Total 12,148 (3%).
The bottom row shows the Total across all surveys: 91,138 in 1990s; 90,674 in 2000s; 202,382 in 2010s; Grand Total 384,194 (100%).
Note: ISSP = International Social Survey Programme (1998; 2012; 2015); WVS = World Values Survey (Reference Inglehart, Haerpfer, Moreno, Christian Welzel, Diez-Medrano and Lagos2014); Gallup = the Gallup World Poll (2013); ASES = Asia Europe Survey (Reference Inoguchi2008); Arab Barometer (Reference Tessler, Jamal, Shteiwi, Shikaki, Robbins, Hamami and Gaafar2015); Asian Barometer (Reference Hu and Chu2008; Reference Hu and Chu2012; Reference Hu and Chu2016; Reference Hu and Chu2021); Afrobarometer (2012; 2022); Latino Barometer (2015).
Revealed Comparative Advantage Index
Ricardian trade theory suggests that international trade patterns are driven by differences in countries’ productivity. It is challenging, however, to directly measure such productivity variance. The concept of revealed comparative advantage addresses this issue by using observable trade data and identifying a country’s potential strengths in exporting specific goods (Balassa Reference Balassa1965). To measure countries’ comparative advantage in agriculture, we use the RCA Index, constructed by the United Nations Conference on Trade and Development (UNCTAD 2023).Footnote 9
Based on the RCA index, a country possesses a revealed comparative advantage in product i when its ratio of exports of i to its total exports exceeds the same ratio for the world as a whole. This is calculated using the following equation:

In this equation,
$ P $
 denotes the set of all products,
$ {X}_{Ai} $
 refers to country
$ A $
 ’s exports of product
$ i $
 , and
$ {X}_{wi} $
 represents the world’s exports of the same product. The term
$ {\sum}_{j\in P}{X}_{Aj} $
 indicates the total exports of country
$ A $
 across all products, and
$ {\sum}_{j\in P}{X}_{wj} $
 corresponds to the world’s total exports of all products.
We measure countries’ revealed comparative advantage in agriculture by calculating the mean RCA index of agricultural products as classified by the SITC, Revision 3 (e.g., Meat and meat preparations; Cereals and cereal preparations; Vegetables and fruits; and Sugar, sugar preparations, and honey). Countries with values above 1 (or above 0 for our log-transformed RCA measures), on average, exhibit a comparative advantage in agricultural products. We use the same method to construct an RCA measure for labor-intensive products (e.g., Leather, Wood manufacture, Textile yarn, Cotton fabrics, and Glassware), as classified by the SITC, Revision 3.
Figure 2 reveals temporal and spatial variation in agricultural RCA. As expected, wealthy countries in the Global North are generally less competitive in agriculture than middle-income and low-income countries in the Global South. Even within each of these groups of countries, however, there is significant variation in agricultural RCA. Some high-income countries have a comparative advantage in agriculture (e.g., the United States, Canada, Australia, and France) and certain low-income countries have a comparative disadvantage (e.g., Angola, Nigeria, and Yemen). In addition, countries such as China, India, and Mexico exhibit declining levels of agricultural RCA over time, with China shifting from a comparative advantage to a comparative disadvantage in agricultural products. In contrast, countries such as Brazil, Ukraine, and Zambia became more competitive in agriculture over time.
Revealed Comparative Advantage in Agriculture by Country, 1995 versus 2015

Figure 2. Long description
Two world maps arranged vertically. The top map is titled R C A in agriculture, 1995 and the bottom map is titled R C A in agriculture, 2015. Both maps use a legend for R C A in agriculture with five color categories. Red represents less than 0.5. Orange represents 0.5 to 1. Yellow represents 1 to 2. Light green represents 2 to 3. Dark green represents greater than 3. White with a black outline represents No data.
In the 1995 map, high R C A (dark green) is concentrated in South America, parts of Southeast Asia, and Greenland. Low R C A (red) is prominent in Russia, North Africa, and parts of the Middle East. North America and Western Europe are mostly yellow (1 to 2).
In the 2015 map, several shifts are visible. Russia has moved from red (less than 0.5) to orange (0.5 to 1). China has shifted from green (greater than 2) to red (less than 0.5). South America remains largely dark green, indicating a sustained high comparative advantage. India has shifted from dark green to light green. Australia remains light green in both periods. The United States and Canada remain in the yellow category (1 to 2).
These differences in agricultural RCA reflect both exogenous natural endowments or climate conditions and endogenous factors, such as tariffs and subsidies. While we address this threat to causal identification more fully in the second part of the study, we also apply two strategies to mitigate it in our cross-national analysis. First, we conduct a series of placebo-like tests to assess whether the interaction between rurality and agricultural RCA merely reflects structural differences between developed and developing countries or the divide between low-skilled and high-skilled workers. Second, we use an alternative measure of agricultural competitiveness—RCA in major staple crops (wheat, rice, and maize)—which together account for 90% of global cereal exports. While not entirely immune to the influence of policy, this measure is more plausibly exogenous to political outcomes, since production patterns for these staples are shaped by long-standing natural endowments and stable cultivation practices rather than short-term political dynamics (see Section B.5 of the Supplementary Material).
Subnational Revealed Comparative Advantage
To account for subnational variation in agricultural RCA, we focus on all EU+ countries in the GTA dataset for which information on respondents’ local regions and regional employment in agriculture is available.Footnote 10 Using these data, we construct a subnational measure of agricultural RCA that captures within-country variation in agricultural competitiveness. Employment data are drawn either from the Quality of Government EU Regional Dataset (Charron et al. Reference Charron, Dahlberg, Sundström, Holmberg, Rothstein, Pachon and Dalli2020), which is based on the EU Labour Force Survey, or from Huber, Stiller, and Dür (Reference Huber, Stiller and Dür2023), who compile employment measures from country-specific household and labor surveys. Most subnational units correspond to NUTS-2 regions, with populations between 800,000 and 3,000,000.Footnote 11 An important advantage of using this level of aggregation is that, while agricultural specialization varies substantially across these regions within countries, all such units are sufficiently large to include sizable rural populations. In total, the analysis covers 149 subnational regions across 16 countries.
Our approach treats local employment in agriculture as specialization weights. Specifically, we multiply our country-year measure of agricultural RCA by region-specific agricultural employment shares that are normalized within each country and centered around 1. This normalization ensures that the average subnational RCA within a country equals the national RCA, while assigning higher (lower) RCA values to regions with above-average (below-average) agricultural employment. Later, we show that this measure captures meaningful within-country variation in agricultural specialization.Footnote 12
Voting Outcomes
To assess the electoral implications of the rural–urban divide over international trade across countries, we focus on the same European countries for which we can measure subnational RCA. We draw on data from the ISSP, which are incorporated into our harmonized GTA dataset. The survey respondents are asked whether they voted in the last election and, if so, the party they supported. The ISSP provides both party names and internal party identifiers for each election. To recover parties’ ideological and policy positions, we manually match these party identifiers for the EU+ countries in our sample to the Manifesto Research on Political Representation (MARPOR) dataset (Lehmann et al. Reference Lehmann, Franzmann, Al-Gaddooa, Burst, Ivanusch, Regel and Riethmüller2024).
The MARPOR data allow us to measure parties’ policy positions and ideological stances, which we use to construct four voting outcomes. The first—and most directly relevant to our agricultural interest voting hypothesis—is Pro-Farmer Party, which measures parties’ support for agriculture, based on manifesto statements about agricultural policy, including subsidies and welfare provisions for farmers. Second, following Colantone and Stanig (Reference Colantone and Stanig2018), we construct a measure of Economic Nationalism, which reflects party positions on protectionism versus internationalism (Net Autarky), as well as on a free market economy versus regulation and planning (Economic Conservatism). Third, we consider a more comprehensive index of Nationalist Autarchy, based on Burgoon (Reference Burgoon2009), which taps the position of parties on protectionism and internationalism, but also on broader cultural issues, such as traditional morality, multiculturalism, and nationalism, thereby capturing the agendas of all parties in the political system. Fourth, Free Market Economy captures party positions on the free market and free market capitalism as an economic model.
For each of these four measures, we define a binary outcome that equals one if the respondent voted for a party whose score lies in the top quartile of the respective distribution for each country in our sample, and zero if the respondent voted for other parties or did not cast a ballot. Table A-16 in the Supplementary Material presents the list of the parties that each of the four measures covers. Pro-farmer parties include, for example, traditionally agrarian parties, such as the Centre Party in both Sweden and Finland; Christian Democratic parties in Austria, Germany, and Switzerland; more nationalist parties such as the Sweden Democrats, True Finns, and the National Front in France; and even some left-wing parties such as the Hungarian Socialist Party and The Greens in Austria. In addition, we examine voting outcomes based on the MARPOR’s party family classification. For each right-wing party family—Christian Democratic, Conservative, and Nationalist—we construct a binary indicator that equals one if the respondent voted for a party belonging to that family, and zero otherwise. We also construct a broader Right-Wing Party indicator that equals one if the respondent voted for any party in these three families (Margalit and Solodoch Reference Margalit and Solodoch2026).
REVEALED COMPARATIVE ADVANTAGE IN AGRICULTURAL GOODS
If rural residents’ attitudes about trade are shaped by their community or class-based economic interests, then the competitiveness of agriculture should influence their support for open overseas commerce. To test this hypothesis, we estimate a linear probability model (LPM) of whether respondents support trade (1) or not (0). The key independent variables are an indicator of whether respondents reside in a rural area, their country’s RCA in agriculture, and the interaction between these factors. Further, we control for individual-level covariates (age, gender, formal education, employment status, income, and working in agriculture) and survey, country, and decade fixed effects.Footnote 13
Panel a of Figure 3 shows the marginal effects of rurality by levels of RCA in agriculture, based on the estimates of this model. The solid, continuous blue line and the shaded 95% confidence interval are derived using the linear method of computing marginal effects. The three red bar plots represent the change in the marginal effect at high (H), medium (M), and low (L) values of RCA, based on a binning method (Hainmueller, Mummolo, and Xu Reference Hainmueller, Mummolo and Xu2019).
Marginal Effects of Rurality and Employment in Agriculture on Support for Trade Liberalization by Revealed Comparative Advantage
Note: Panels a and b show the effect of rural residence and working in agriculture, respectively, on support for international trade by values of RCA in agricultural products (logged). The dashed vertical line marks the threshold of RCA, where values greater (smaller) than 0 represent a revealed comparative advantage (disadvantage) in agriculture. Markers indicate the effect of these variables with 95% confidence intervals (using heteroskedasticity-robust standard errors clustered by country). Each model controls for age, gender, education, employment status, income, working in agriculture, and survey, country, and decade fixed effects.

Figure 3. Long description
A two-panel coefficient plot. Both panels share an x-axis labeled Moderator R C A in agricultural products, ranging from negative 4 to 4. A vertical dashed red line marks the 0 threshold.
Panel a, titled Rural resident, has a y-axis labeled Marginal Effect of Rurality on support for trade, ranging from negative 0.15 to 0.1. A blue regression line with a grey shaded 95 percent confidence interval slopes upward from left to right. Three red markers with error bars are plotted. The first marker at R C A negative 1 is below the 0 horizontal line. The second at R C A 0.5 and third at R C A 1.2 cross or sit above the 0 line. A histogram at the bottom shows data density concentrated between R C A negative 2 and 2.
Panel b, titled Agricultural worker, has a y-axis labeled Marginal Effect of Agricultural worker on support for trade, ranging from negative 0.3 to 0.2. Similar to panel a, a blue regression line with a grey shaded confidence interval slopes upward. Three red markers with error bars are shown. The marker at R C A negative 1 is clearly below 0, while markers at R C A 0.5 and 1.2 are near or slightly above the 0 line. A histogram at the base shows a similar distribution of data points as panel a.
Recall that a country has a revealed comparative advantage if the value of RCA is greater than 1. Using the log-transformed RCA, this threshold corresponds to 0. We find evidence of a sizable and strong interaction effect. Rural dwellers are 5 percentage points less likely to support foreign trade than urban residents in countries marked by a comparative disadvantage in agriculture. But this opposition to trade abates and eventually disappears as countries acquire a comparative advantage.Footnote 14 This pattern indicates that geographic frictions over economic globalization are more likely to develop when local agriculture struggles to compete in global markets. In addition, the binning estimates reveal that the interaction effect of rurality and agricultural RCA on trade preferences is statistically significant around the RCA threshold of 0. This suggests that rural residents are highly attentive to relatively subtle differences in the potential gains of agriculture from global market integration.
In panel b of Figure 3, we turn to the interaction between employment in agriculture and RCA. When the agricultural sector is uncompetitive, the effect of working in agriculture on opposition to trade—approximately 6 percentage points—is, as expected, somewhat larger than the effect of simply living in rural areas. But beyond its magnitude, the general interaction effect of working in agriculture and RCA is very similar to the interaction effect of rural residence and RCA. There is a significant change around the RCA threshold and a shift to support trade at the highest levels of competitiveness in agriculture.
When considering the potential electoral implications of these results, it is important to look beyond the marginal effects of these explanatory variables and consider their prevalence in the broader population. As indicated by the red bars in the histograms, there are significantly more voters living in rural communities than voters employed in agriculture. Therefore, although a greater proportion of agricultural workers—compared to other rural residents—may be drawn to protectionist parties when farming products are uncompetitive, the overall support base for such parties in society at large lies primarily among the much larger group of rural voters.
Robustness and Placebo Tests
Further analysis indicates that our results are not sensitive to using alternative measures of RCA. The estimates in column 1 of Table 2 show that our findings remain intact when we replace the continuous measure of RCA with a binary variable that indicates whether a country has a comparative advantage in agriculture. Section B of the Supplementary Material also shows that our results are robust to measuring competitiveness in agriculture by using the share of agricultural products with an RCA that is greater than 1 (Table A-5 in the Supplementary Material), an RCA-net measure that accounts for imports as well as exports (Table A-6 in the Supplementary Material), and the RCA of the world’s most important cereal crops—wheat, rice, and maize (Table A-7 in the Supplementary Material).Footnote 15
Alternative Explanations: Skill Abundance and Unskilled Workers

Table 2. Long description
A table with 6 columns of data. The headers are: 1 All countries, 2 Low-income countries, 3 Middle-income countries, 4 High-income countries, 5 All countries, and 6 Placebo test.
Key independent variables and their coefficients (standard errors in parentheses):
* Rural resident: Column 1: minus 0.048 super star star (0.009); Column 2: minus 0.019 (0.016); Column 3: minus 0.030 super star star (0.005); Column 4: minus 0.062 super star star (0.005); Column 5: minus 0.053 super star star (0.008); Column 6: minus 0.022 super star star (0.005).
* Rural resident times R C A in agriculture: Column 1: 0.043 super star star (0.012); Column 2: 0.034 super star (0.018); Column 3: 0.022 super star star (0.006); Column 4: 0.037 super star star (0.007); Column 5: 0.051 super star star (0.012).
* Unskilled worker: Column 5: minus 0.019 super star star (0.005); Column 6: minus 0.026 super star (0.010).
* Unskilled worker times R C A in agriculture: Column 6: 0.010 (0.014).
Fixed Effects and Controls (all columns marked with checkmarks):
* Covariates, Country F E, Decade F E, and Survey F E are included in all models.
Summary Statistics:
* Countries: Range from 20 (Low-income) to 105 (All countries).
* Observations: Range from 26,444 to 225,622.
* R-squared: Range from 0.095 to 0.302.
Note: star indicates p less than 0.05, star star indicates p less than 0.01. R C A stands for Revealed Comparative Advantage.
Note: Entries are LPM estimates with robust standard errors in parentheses. In pooled-sample specifications with a sufficiently large number of clusters, standard errors are clustered at the country level (columns 1, 5, and 6). The dependent variable is support for international trade. RCA in agriculture is a binary variable that equals 1 when the value of RCA exceeds 1, indicating a comparative advantage in agriculture, and 0 otherwise. All regressions include the constitutive terms of the interaction between RCA in agriculture and either Rural resident or Unskilled worker. They also control for gender, age, education, income, employment status, employment in agriculture, and survey, country, and decade fixed effects.
$ {}^{*} $
 $ p<0.05 $
 ,
$ {}^{**} $
 $ p<0.01 $
 .
Another possible concern is that the interaction effect we find using agricultural RCA captures broader patterns of economic development and the distribution of skills across rural and urban areas. Based on the HO model, international trade benefits highly skilled workers in skill-abundant developed countries and low-skilled workers in skill-scarce developing countries (e.g., Dolan and Milner Reference Dolan and Milner2023). If rural residents are disproportionately low-skilled, and developing countries are more likely to possess a comparative advantage in agriculture, then the observed interaction between agricultural RCA and rurality could simply reflect these underlying structural differences rather than a causal relationship.
To address this issue, we begin by estimating the effect of the interaction between rurality and RCA in agriculture for low-income, middle-income, and high-income countries.Footnote 16 The results in Table 2 show that the signs of the estimated coefficients of Rural resident and its interaction with RCA in agriculture are consistent across all three income groups. In addition, there is a pronounced and statistically significant interaction effect within low-income, middle-income, and high-income countries, suggesting that changes in the rural–urban divide are actually driven by the competitiveness of agriculture.
Next, we include an occupation-based measure of respondents’ skills to account for whether they are unskilled workers.Footnote 17 Including this variable reduces the sample size by about 15% due to missing or insufficiently specific occupation data. Nonetheless, the estimated coefficients of Rural resident and its interaction with RCA in agriculture remain sizable and statistically significant. Further, in column 6, we conduct a placebo-like test to address the possibility that the effect of rural status across various levels of RCA in agriculture actually reflects the skill divide, as noted above. To this end, we replace the interaction between Rural resident and RCA with a placebo interaction between Unskilled worker and RCA. The results indicate that the effect of Unskilled worker is statistically and substantively similar across the range of RCA in agriculture.Footnote 18 Finally, in Table A-5 in the Supplementary Material, we replace the moderator, RCA in agriculture, with RCA in labor-intensive products. We find that the rural–urban divide remains stable and statistically indistinguishable across different levels of RCA in labor-intensive products and that this result is robust to alternative measures of RCA in such products.
In sum, this analysis indicates that rural individuals’ opposition to foreign trade is associated with: (1) levels of comparative advantage only in the sector most directly related to their rural community and class, but not with levels of comparative advantage in labor-intensive products and manufacturing and (2) their rurality, rather than their higher proclivity to be low-skilled workers.
SUBNATIONAL EVIDENCE FROM EUROPE
Since our cross-national measure of RCA is calculated at the country-year level, it does not account for potentially important within-country variation in agricultural competitiveness. Aggregation to the national level may result in conservative estimates of RCA’s effects, but it also raises the risk of an ecological fallacy. To address this issue, we focus on all EU+ countries included in our GTA dataset for which data on respondents’ subnational regions and regional employment in agriculture are available. As mentioned above, these data allow us to construct a subnational measure of agricultural RCA, which increases the precision with which we can assess whether rural residents live in areas marked by a comparative advantage in agriculture and reduces concerns about an ecological fallacy. Beyond this methodological benefit, testing our argument using a subnational measure of the competitiveness of agriculture allows us to draw insights into the causal mechanisms driving the rural–urban divide over trade. Specifically, if the cleavage is attenuated in regions characterized by a heightened comparative advantage in agriculture, then rural voters are likely to be influenced by local community-based considerations more than broader, national class-based considerations.
Panel a of Figure 4 presents the distribution of respondents from different subnational regions by country and reveals considerable variation both within and between countries. In panel b of Figure 4, we again use a multiplicative interaction model, but replace national RCA with our subnational RCA measure as the moderator. The results reveal a strong interaction effect between subnational RCA in agriculture and rural residence. As the stacked histogram along the x-axis of panel b shows, both agriculturally competitive and uncompetitive regions include sizable rural population shares. But while the rural–urban gap is both substantively small (1.4 points) and statistically indistinguishable from zero when local agriculture is competitive, rural residents are 6.5 percentage points less likely to support international trade than their urban counterparts when local agriculture is uncompetitive, and this difference is statistically significant.
Support for Trade Liberalization by Subnational Comparative Advantage
Note: Panel a shows the distribution of observations across subnational RCA values by country. Panel b depicts the effect of rurality on support for international trade by values of subnational RCA in agricultural products (logged). Markers indicate point estimates with 95% confidence intervals controlling for region and year fixed effects and individual-level covariates (age, gender, education, and working in agriculture). Standard errors are clustered by region.

Figure 4. Long description
Panel a, titled Subnational R C A by Country, is a dot plot. The y-axis lists 15 European countries from Austria at the bottom to United Kingdom at the top. The x-axis represents Subnational R C A in agriculture ranging from minus 2 to 2. Blue circles represent regional observations. Most countries show a wide spread of R C A values, with Switzerland and United Kingdom clustered on the left (lower R C A) and Denmark and Portugal showing clusters on the right (higher R C A).
Panel b, titled Support for Trade, is a marginal effects plot. The y-axis is the Marginal Effect of Rurality on support for trade, ranging from minus 0.2 to 0.05. The x-axis is the Moderator: Subnational R C A in agricultural products, ranging from minus 2 to 2. A blue linear regression line shows a positive slope, starting at approximately minus 0.1 on the y-axis when R C A is minus 2, and crossing the zero line at approximately 1.2 R C A. A grey shaded area represents the 95 percent confidence interval, which narrows toward the center. Two red dots with vertical error bars indicate specific point estimates at approximately minus 0.5 and 0.4 R C A. At the bottom of the plot, a grey and red histogram shows the density of observations across the R C A values, peaking between minus 1 and 0.5.
Table A-8 in the Supplementary Material shows that the effect of subnational agricultural RCA on the rural–urban divide is robust across model specifications. The effect is present in a minimal specification that includes only the interaction and constitutive terms, and it persists when controlling for respondents’ age, gender, and education. Moreover, the estimated effects remain similar as we gradually introduce controls for employment status, income, and subnational region fixed effects, which also suggests that rural voters align with local agriculture for sociotropic reasons. Holding personal income and employment status constant, rural voters’ support for trade protectionism decreases when local agriculture possesses a comparative advantage. Finally, with region fixed effects, the estimates rely on within-region variation in agricultural RCA, holding constant time-invariant regional characteristics. The stability of the interaction indicates that local agricultural competitiveness shapes the rural–urban divide even among respondents living in the same subnational region.
Electoral Implications
Thus far, we have found that the depth of the rural–urban cleavage in attitudes toward trade depends on the competitiveness of the local farming sector. Does the competitiveness of agriculture have a comparable impact on electoral behavior? To address this question, Table 3 reports the average marginal effects of rural status for respondents residing in agriculturally uncompetitive and competitive regions.
Marginal Effect of Rural Status on Voting by Subnational Revealed Comparative Advantage in Agriculture

Table 3. Long description
The table consists of 8 columns representing different voting outcomes: 1 Pro-farmer vote, 2 Nationalist autarchy vote, 3 Economic nationalist vote, 4 Free market vote, 5 Right-wing party, 6 Conservative party, 7 Nationalist party, and 8 Christian democratic party. Columns 6 through 8 are grouped under Right-wing decomposition.
Row 1: Comparative disadvantage. Values across columns 1 to 8 are: 0.082 super star star (0.014), 0.073 super star star (0.016), 0.072 super star star (0.017), minus 0.001 (0.013), 0.072 super star star (0.022), minus 0.019 super star (0.008), 0.015 (0.011), and 0.075 super star star (0.017).
Row 2: Comparative advantage. Values across columns 1 to 8 are: 0.014 (0.009), 0.028 super star (0.013), 0.027 super star (0.013), 0.041 super star star (0.014), 0.025 (0.014), 0.007 (0.011), 0.005 (0.007), and 0.013 (0.007).
Row 3: Covariates. All columns contain a checkmark.
Row 4: Country F E. All columns contain a checkmark.
Row 5: Year F E. All columns contain a checkmark.
Row 6: Observations. All columns show 16,393.
Row 7: R-squared. Values range from 0.077 to 0.329.
Note: Entries are L P M estimates. Standard errors are in parentheses. Star indicates p less than 0.05 and double star indicates p less than 0.01.
Note: Entries are LPM estimates of the marginal effect of rural status on the outcome, evaluated at low
$ (\le 0) $
 and high
$ (>0) $
 levels of subnational RCA in agriculture, with all other covariates held at their means. Heteroskedasticity-robust standard errors are clustered by subnational region. All models control for gender, age, education, employment in agriculture, and country and year fixed effects.
$ {}^{*} $
 $ p<0.05 $
 ,
$ {}^{**} $
 $ p<0.01 $
 .
The results in the first column of Table 3 show that voters living in rural communities are about 8 percentage points more likely to support a pro-farmer party when their region has a comparative disadvantage in agriculture, compared to a statistically nonsignificant 1.4 percentage point gap when local agriculture is competitive.Footnote 19 Comparable patterns emerge when we focus on economic nationalism and nationalist autarchy. As reported in the second and third columns, when local agriculture is uncompetitive, the rural electorate is over 7 percentage points more supportive of parties that propose economically nationalist policies. Again, this rural–urban divide is attenuated in regions with a revealed comparative advantage in agriculture. Similarly, the results in column 4 reveal that rural voters’ support for parties that promote free market policies is 4 points higher when local agriculture is competitive, but this gap disappears when agriculture is uncompetitive.
The same pattern is evident when examining the combined vote share of Christian Democratic, Conservative, and Nationalist parties, capturing rural support for right-wing parties more broadly. As shown in the fifth column, the marginal effect of rural residence on voting for a right-wing party at low levels of agricultural RCA is nearly three times the size of this effect at high levels of agricultural RCA. Most of this difference is driven by rural voters’ support for Christian Democratic parties, which consistently endorse policies aimed at protecting and subsidizing agricultural production (Accetti Reference Accetti2019), while the contribution of increased rural support for nationalist parties in agriculturally uncompetitive regions is relatively modest and imprecisely estimated. By contrast, rural support for Conservative parties—which are typically more committed to free-market economics—is nearly 2 percentage points lower than urban support at low levels of agricultural RCA. Taken together, the results suggest that rural voters are not blindly drawn to nationalist or conservative parties in general, but instead support parties whose economic policies align with local agricultural interests.
Furthermore, as Table A-12 in the Supplementary Material demonstrates, these interaction effects between rural residence and agricultural competitiveness are unique to voting outcomes that are related to the economic interests of local agriculture. Rural support for parties that propose improvements in technology and infrastructure, expanding educational opportunities, or protecting human and civil rights does not change in a meaningful way across the range of subnational RCA in agriculture. Finally, earlier we argued that the moderating role of agricultural RCA should operate similarly across electoral systems. The results in Table A-11 in the Supplementary Material show that the interaction between rural status and agricultural RCA remains substantively and statistically similar in both proportional representation (PR) and non-PR systems, providing empirical support for this claim.
In sum, the electoral response of rural voters to the competitiveness of farming mirrors their trade preferences. When global market integration threatens local agriculture, voters in the countryside throw their support behind parties that typically promote protectionism to either generally or specifically address farmers’ interests. Remarkably, the well-documented electoral advantage of right-wing parties in rural regions becomes almost negligible when local agriculture benefits from market integration. Compared to other individuals who are uninformed about the distributional consequences of trade and rarely prioritize trade policy when casting a ballot, rural voters appear to be strongly influenced by trade-related circumstances and the economic interests of their local community (Guisinger Reference Guisinger2009; Rho and Tomz Reference Rho and Tomz2017).
SUBNATIONAL EVIDENCE FROM THE UNITED STATES
Empirical Strategy
The preceding results reveal a strong association between revealed comparative advantage in agriculture and the political divide between rural and urban voters. These findings, however, also raise several issues. The first concerns causal identification and potential endogeneity. RCA in agriculture reflects not only natural endowments, but also land-management policies, technology adoption, and infrastructure development, all of which may simultaneously influence mass attitudes and policy preferences. Trade barriers such as tariffs and subsidies shape RCA, yet are more likely to be implemented when voters and politicians hold protectionist preferences. The second issue concerns the causal mechanisms underlying our results. One possibility, as we argue, is that agricultural comparative advantage shapes the political preferences of voters in rural communities regardless of their factor ownership or their sector of employment, partly due to community-wide economic spillovers. Alternatively, the economic and political consequences might be concentrated among farm and land owners, consistent with the HO framework. A third possibility is that comparative advantage influences the electorate’s composition through out-migration from agriculturally uncompetitive regions or in-migration to competitive regions.Footnote 20
To address these issues, we focus on the United States. We estimate the effect of agricultural competitiveness on rural residents’ support for international trade by isolating the exogenous component of agricultural comparative advantage in the aftermath of NAFTA’s establishment in 1994, using a subnational measure of potential agricultural productivity. Our empirical strategy builds on the approach of Amodio et al. (Reference Amodio, Baccini, Chiovelli and Di Maio2022), who construct a measure of agricultural comparative advantage based on the Food and Agriculture Organization’s (FAO) Global Agro-Ecological Zones (GAEZ) database. The GAEZ database provides estimates for potential crop yields based on a region’s immutable biophysical characteristics, including soil quality, topography, and climate conditions (Costinot, Donaldson, and Smith Reference Costinot, Donaldson and Smith2016). These estimates rely on crop-specific agronomic models, rather than observed agricultural output, which helps avoid issues of endogeneity that are inherent in the use of production data. More specifically, while the actual crop yield realized in any given region ultimately depends on both the underlying quality of land and the set of complementary inputs that a farmer employs, potential crop yields capture the productivity potential stemming from the natural geographic and land quality endowments under fixed input levels. This distinction is central to our empirical strategy. Since potential crop yields represent a counterfactual of agricultural output, they cannot be affected by political preferences or policy outcomes, mitigating concerns that the results are driven by confounding factors.
Using these data, Amodio et al. (Reference Amodio, Baccini, Chiovelli and Di Maio2022) construct a plausibly exogenous measure (Agri-CA) of agricultural comparative advantage at the U.S. congressional district level.Footnote 21 They do so by summing potential crop suitability for crops included in preferential trade agreements (PTAs), normalized by population, for both U.S. districts and U.S. trade partners. The ratio of these measures is the district’s comparative advantage in agriculture with respect to the partner. Based on this variable, Amodio et al. identify the effect of agricultural comparative advantage, induced by local natural endowments, on legislative voting as well as voters’ support for free trade. However, they do not distinguish between rural and urban voters.
We rely on data from the American National Election Studies (ANES Reference Rosenstone, Kinder and Miller1999; Reference Burns, Kinder, Rosenstone and Sapiro2002) and Amodio et al.’s district-level measure of agricultural comparative advantage to assess its impact on the divide between rural and urban voters. The data needed to conduct this analysis are available from 1996 to 2000, soon after the formation of NAFTA.Footnote 22 The ANES classifies respondents as rural based on whether they reside in places with fewer than 2,500 inhabitants or outside metropolitan areas, as defined by the U.S. Census Bureau. Agricultural comparative advantage is measured for each congressional district relative to Canada and Mexico, which together accounted for approximately a third of U.S. foreign trade during these years.
We focus on two outcomes: (1) support for new import restrictions and (2) voting for the Democratic presidential candidate in the 1996 and 2000 elections. Compared to their counterparts in districts with a comparative advantage in agriculture, we expect that rural voters in districts with an uncompetitive farming sector will be more supportive of import restrictions and less supportive of Bill Clinton and Al Gore, both of whom championed NAFTA (Choi et al. Reference Choi, Kuziemko, Washington and Wright2024). In addition to trade preferences and voting behavior, the ANES asks questions about voters’ economic perceptions and their length of residence in the local community, enabling us to examine the mechanisms through which agricultural comparative advantage influences political behavior. For respondents interviewed in 1996, we also use information on their 1992 (pre-NAFTA) presidential vote to estimate the effect of post-NAFTA agricultural comparative advantage on vote switching. Finally, despite the plausibly exogenous nature of potential crop yields, land suitability is not randomly assigned and may be correlated with unobserved confounders. To empirically assess this possibility, we conduct placebo outcome tests and find no evidence that agricultural comparative advantage affects pre-NAFTA voting behavior or policy preferences unrelated to trade, as we later show.
Notably, the United States serves as a “least likely case” for finding that agricultural competitiveness shapes the political rural–urban divide. Since the mid-twentieth century, rural America has undergone extensive industrialization, sharply reducing its economic dependence on farming relative to earlier periods and to many other countries. Yet agriculture still employs a meaningful share of residents in many rural communities and continues to be embedded in rural culture and community life, potentially affecting rural voters outside the farming sector. Finding that agricultural comparative advantage nonetheless influences how rural Americans think about trade and vote would therefore provide compelling support for our argument.
Results
Panel a in Figure 5 shows the marginal effect of rurality on support for import restrictions by levels of comparative advantage in agriculture across U.S. districts. Similar to the strong interaction effect we find cross-nationally, rural voters in districts with a comparative advantage in agriculture are no more protectionist than their urban counterparts. But rural voters in districts that stand to be harmed by import competition from Mexico and Canada in the wake of NAFTA’s establishment are significantly more protectionist than urban and suburban voters in the same districts. In these districts (where the level of agricultural comparative advantage is below the median), the rural–urban cleavage is substantial: rural residents are 15 percentage points more likely than urban residents to favor import restrictions. Panel b in Figure 5 shows the marginal effect of a one standard deviation increase in agricultural comparative advantage on support for protectionism by respondents’ type of community. Both urban and suburban residents are unaffected by agricultural comparative advantage. In contrast, the effect of a one standard deviation increase in agricultural comparative advantage is statistically significant and substantively large among rural dwellers (12 percentage points).Footnote 23
Rurality, Agricultural Comparative Advantage, and Trade Protectionism
Note: Panel a depicts the marginal effect of rurality on support for import restrictions by values of agricultural comparative advantage (standardized). Panel b depicts the marginal effect of a one standard deviation increase in agricultural comparative advantage. Markers indicate point estimates with 95% confidence intervals, controlling for year fixed effects and individual-level covariates (age, gender, race, education, and working in agriculture), and clustering standard errors by district.

Figure 5. Long description
Panel a, titled Rural-Urban Divide by Agricultural C A, is a marginal effect plot. The y-axis represents the Marginal Effect of Rurality on Support for Import Restrictions, ranging from negative 0.4 to 0.8. The x-axis is the Moderator: Agricultural Comparative Advantage, ranging from negative 4 to 1. A downward-sloping blue line shows that as agricultural C A increases, the marginal effect of rurality decreases. A grey shaded area represents the 95 percent confidence interval, which narrows as it approaches the zero line. Two red markers with error bars are placed at x equals negative 1.1 and x equals 0. A histogram at the bottom shows the distribution of the moderator.
Panel b, titled Effect of Agricultural C A by Location, is a coefficient plot. The y-axis represents the Marginal Effect of Agricultural Comparative Advantage on Support for Import Restrictions, ranging from negative 0.3 to 0.2. The x-axis categorizes respondents into Urban, Suburban, and Rural. Three black circular markers with vertical error bars show the point estimates. The Urban respondent estimate is 0.025. The Suburban respondent estimate is negative 0.032. The Rural respondent estimate is negative 0.121. A horizontal dashed red line marks the zero threshold, showing that the effect is positive for urban areas but significantly negative for rural areas.
In Figure 6, we present the effects of rural residence and agricultural comparative advantage on voting for the Democratic presidential candidates—Clinton in 1996 and Gore in 2000—who were driving forces behind NAFTA. Notably, while the divide between rural and urban voters is substantial in districts with a comparative disadvantage in agriculture (16 percentage points for districts below the median level), it vanishes in districts possessing a comparative advantage (panel a). The results in panel b show that those rural voters living in uncompetitive areas facing potential economic damage in the aftermath of NAFTA were significantly less likely to vote for the Democratic incumbent.Footnote 24 A one standard deviation rise in agricultural comparative advantage increases support for the Democratic candidate by 14 percentage points, but this effect is restricted to rural voters. Non-rural voters remain uniformly supportive of the Democratic candidate across the range of agricultural comparative advantage.Footnote 25
Rurality, Agricultural Comparative Advantage, and Voting for the Democratic Candidate
Note: Panel a depicts the effect of rurality on voting for the Democratic candidate in the presidential elections of 1996 (Clinton) and 2000 (Gore) by values of agricultural comparative advantage (standardized). Panel b depicts the marginal effect of a one standard deviation increase in agricultural comparative advantage on voting for the Democratic candidate by locality type. Markers indicate point estimates with 95% confidence intervals controlling for state–year fixed effects and individual-level covariates (age, gender, race, education, and working in agriculture) and clustering standard errors by district.

Figure 6. Long description
The figure consists of two panels labeled a and b.
Panel a, titled Rural-Urban Divide by Agricultural C A, is a line graph. The x-axis is labeled Moderator: Agricultural Comparative Advantage, ranging from minus 4 to 1. The y-axis is labeled Marginal Effect of Rurality on Dem. Vote, ranging from minus 1 to 0.5. A blue regression line shows a positive linear trend, starting at approximately minus 0.6 on the y-axis when C A is minus 4, and rising to approximately 0.1 when C A is 0.5. A grey shaded area represents the confidence interval, which narrows as C A increases. Two red markers with vertical error bars are plotted at C A values of approximately minus 1.1 and 0. At the bottom of the plot, a histogram shows the distribution of the data, with grey and red bars.
Panel b, titled Effect of Agricultural C A by Location, is a coefficient plot. The x-axis lists three categories: Urban respondent, Suburban respondent, and Rural respondent. The y-axis is labeled Marginal Effect of Agricultural Comparative Advantage on Vote for Democratic Candidate, ranging from minus 0.2 to 0.3. Three black circular markers with vertical 95 percent confidence interval whiskers are shown:
* Urban respondent: point estimate of minus 0.019.
* Suburban respondent: point estimate of 0.024.
* Rural respondent: point estimate of 0.142.
A horizontal red dashed line marks the zero effect threshold, and vertical red dashed lines separate the three categories.
Leveraging exogenous variation in agricultural productivity, we find that comparative advantage in agriculture affects rural voters’ opinions about trade and their decisions at the ballot box. A set of robustness and placebo outcome tests further corroborates this claim. First, as expected, the rural–urban divide on other policies—immigration, environmental protection, gender equality, and foreign aid—remains stable regardless of agricultural comparative advantage (Table A-19 in the Supplementary Material). Second, as panel a of Figure 7 shows, in 1992, rural voters from districts that would later be disadvantaged in agriculture voted much like their urban counterparts. By 1996, as market integration under NAFTA activated pre-existing differences in agricultural comparative advantage, many of the same rural voters from disadvantaged regions withdrew their support for the Democratic Party. This result remains robust when controlling only for baseline demographics and when incorporating a range of additional controls, including employment status and household income (Table SI-9 in the Supplementary Material). Together, these tests indicate that residents of competitive and uncompetitive districts voted in comparable ways prior to NAFTA; differences in their voting patterns emerged afterward and were directly related to the trade agreement.
Rurality, Agricultural Comparative Advantage, and Vote Switching Post-NAFTA
Note: The diamond (circle) markers in panel a depict the marginal effect of rurality on voting for the Democratic candidate in the presidential elections of 1992 (1996) by agricultural comparative advantage. Panel b depicts the marginal effect of a one standard deviation increase in agricultural comparative advantage on vote switching to the Democratic candidate (1 = voted Democrat in 1996 and voted GOP/Perot/abstained in 1992; 0 = otherwise) or defection from the Democratic vote (1 = voted Democrat in 1992 and voted GOP/Perot/abstained in 1996; 0 = otherwise), by location. Markers indicate point estimates with 95% confidence intervals controlling for age, gender, race, education, partisanship, labor union membership, employment status, income, working in agriculture, and state fixed effects. Standard errors are clustered by district.

Figure 7. Long description
Panel a, titled Rural-Urban Divide by Agri-C A, has a y-axis representing the Marginal Effect of Rurality on Democratic Vote from negative 0.3 to 0.2. The x-axis is split into Comparative Disadvantage and Comparative Advantage. For Comparative Disadvantage, the pre-N A F T A 1992 effect is a light blue diamond at approximately 0.04, while the post-N A F T A 1996 effect is a dark red circle at negative 0.10. For Comparative Advantage, the 1992 effect is near 0, and the 1996 effect is slightly positive at 0.02. Vertical lines through markers indicate 95 percent confidence intervals.
Panel b, titled Effect of Agri-C A by Location, has a y-axis representing the Marginal Effect of Agricultural Comparative Advantage on Vote Switching 1992-96. The x-axis is divided into two sections: Switched to Dem. and Defected from Dem. In the Switched to Dem. section, point estimates for Urban, Suburban, and Rural voters are all positive at 0.03, 0.03, and 0.05 respectively. In the Defected from Dem. section, the effects are negative: Urban at negative 0.01, Suburban at negative 0.03, and Rural at negative 0.12. The rural voter in the defection category shows the largest negative effect with the widest confidence interval.
Mechanisms
Our analysis in Section D of the Supplementary Material provides a more nuanced assessment of the process through which rural voters form their trade and voting preferences in response to their local community’s expected gains or losses from international integration. First, our results remain unchanged when we remove potential landowners from the sample—farmers and business owners—and focus on wage-earning laborers who do not work in agriculture. This finding supports our argument and the regional specific-factors framework and is at odds with the HO factor endowments model (Table A-22 in the Supplementary Material).
Second, we find that reduced support for the Democratic candidate among rural voters in districts marked by a comparative disadvantage in agriculture is driven primarily by the defection of prior Democratic supporters, not by weaker mobilization of potential new voters (Figure 7, right panel). Further, such defection took the form of depressing turnout among 1992 Clinton supporters, rather than shifting their support to the Republican Party or Ross Perot (Table A-21 in the Supplementary Material).
Third, we use information about the length of time that respondents have lived in their local communities to evaluate the possibility that compositional changes produce the effect that we attribute to agricultural comparative advantage. Our results raise doubts that the compositional mechanism—that is, the sorting of nationalist, protectionist individuals into the countryside and cosmopolitan, free trading individuals into cities—accounts for the political frictions between rural and urban dwellers (Table A-22 in the Supplementary Material). The effect of agricultural comparative advantage is statistically and substantively similar for both long-term residents, who remain in their community for decades or even their entire lives, and individuals who more recently moved to their community. Equally, rural voters who stayed in the same community from 1992 to 1996 were more likely to defect from the Democratic Party after NAFTA in response to a comparative disadvantage in agriculture (Figure A-5 in the Supplementary Material). Previous research indicates that the compositional mechanism helps to account for certain rural–urban frictions (Maxwell Reference Maxwell2019; Scheve and Serlin Reference Scheve and Serlin2025), but we find no evidence that it explains the effect of agricultural comparative advantage in the immediate aftermath of NAFTA.
Instead, we find evidence that the electoral effect of agricultural comparative advantage in rural areas is related to economic policy evaluations and economic perceptions (Figure A-9 in the Supplementary Material). Rural voters living in regions with a competitive farming sector were 15 percentage points more likely than those in agriculturally uncompetitive regions to believe that the Democratic Party would do a better job than the Republican Party of handling the U.S. economy. In addition, rural voters in agriculturally competitive regions evaluated the future prospects of the U.S. economy more positively. By contrast, agricultural comparative advantage has no bearing on these economic perceptions among urban or suburban voters. Notably, because agricultural comparative advantage neither improves respondents’ perceptions of their personal financial situation nor reduces their probability of job loss, these results should not be interpreted as evidence of pocketbook voting. Rather, rural voters’ responses to agricultural competitiveness appear to be driven by local, community-based considerations, while non-rural voters remain largely unaffected.
Finally, beyond economic perceptions, in Section D.10 of the Supplementary Material, we use county-level panel data to track the economic trajectories of agriculturally competitive and uncompetitive areas before and after NAFTA.Footnote 26 The analysis compares how these trajectories evolved over time across rural and urban counties, providing evidence on the local economic dynamics of agricultural comparative advantage after trade liberalization. The results show that the existence of an agricultural comparative advantage generated substantial income gains for farmers and consequential spillovers within rural economies following NAFTA (Table A-26 in the Supplementary Material). Rural counties with a competitive agricultural sector enjoyed a large increase in farm proprietors’ income, but the effects extended well beyond agriculture. These counties experienced higher earnings per worker (excluding proprietors’ income) and modestly higher employment rates, with gains concentrated in nonagricultural sectors, suggesting that agricultural gains translated into broader local labor-market benefits. By contrast, there is little evidence that NAFTA led to widespread trade-related job displacement in rural areas, since patterns of Trade Adjustment Assistance (TAA) petitions and certifications were similar in agriculturally competitive and uncompetitive counties (Figure A-10 in the Supplementary Material).
Comparing rural and urban trajectories highlights the spatial limits of these spillovers (Figure A-11 in the Supplementary Material). In rural areas, economic outcomes diverged after NAFTA, with agriculturally competitive counties continuing to experience wage growth and some employment expansion, while agriculturally uncompetitive counties exhibited slower wage growth and employment stagnation. In urban counties, by contrast, wage and employment patterns were largely similar regardless of agricultural comparative advantage, suggesting that agricultural trade exposure was of primary importance in communities where farming was central to the economic base.
These economic dynamics differ from those observed in regions that confronted deindustrialization and import shocks in manufacturing, which typically involved mass layoffs, lower labor force participation, declining wages, depopulation, and increased reliance on TAA benefits (e.g., Autor, Dorn, and Hanson Reference Autor, Dorn and Hanson2013; Baccini and Weymouth Reference Baccini and Weymouth2021; Broz, Frieden, and Weymouth Reference Broz, Frieden and Weymouth2021). Trade liberalization did not trigger widespread job displacement in regions characterized by an uncompetitive agricultural sector. Instead, disadvantaged areas experienced slower income and employment growth, with largely stable employment levels and the absence of either rising trade-related displacement claims or declining population growth. Rather than precipitating a sharp economic decline in agriculturally uncompetitive regions, trade liberalization contributed to persistent under-performance relative to urban areas and agriculturally competitive rural communities.
CONCLUSION
This study provides the first systematic analysis of how agricultural comparative advantage shapes the rural–urban divide. Using our GTA dataset—the largest of its kind—alongside extensive data on voting behavior, we show that the depth of the rural–urban cleavage depends on the competitiveness of farming. When local agriculture is uncompetitive, rural residents tend to adopt more protectionist views and support parties championing pro-farmer or economically nationalist policies. By contrast, when agriculture enjoys a comparative advantage, rural residents tend to support trade and refrain from backing such parties.
A recent review argues that the political consequences of economic geography have been understudied and may help to explain the recent backlash against globalization (Rickard Reference Rickard2020). Our study contributes to this avenue of inquiry and sheds additional light on this issue. Rural residents worldwide have been hostile to trade in regions where agriculture is not competitive. Moreover, these individuals have thrown their electoral support behind parties that advocated raising trade barriers and rolling back globalization. Of course, this is only one source of the gains made by anti-globalist forces over the past few decades. But it is a significant source that has been salient in various quarters of the world.
However, rural voters do not invariably align with anti-globalist forces. The political rural–urban divide is often portrayed as reflecting the cleavage between the winners and losers of international economic integration. The winners are highly-skilled workers in “superstar” cities and firms, while the losers are low-skilled workers concentrated in traditional manufacturing jobs and peripheral regions, including small towns and the countryside. We challenge this characterization: rural residents of agriculturally competitive regions can benefit from globalization, regardless of their skills. When they reap such gains or face little economic threat from market integration, we find that the gap between city and hinterland is negligible. Conversely, rural voters in regions with a comparative disadvantage in agriculture are significantly more likely than their urban counterparts to support protectionist policies and parties.
Furthermore, agricultural comparative advantage can shift over time, helping to explain the rise and fall of rural–urban cleavages within a country. Such changes may stem from diverse sources, including climate change (Costinot, Donaldson, and Smith Reference Costinot, Donaldson and Smith2016), the proliferation of PTAs during the 1990s (Dür, Baccini, and Elsig Reference Dür, Baccini and Elsig2014), scientific and technological breakthroughs such as the Green Revolution since the 1960s (Gollin, Hansen, and Wingender Reference Gollin, Hansen and Wingender2021), or more recent government regulations tied to the Green Transition. In this study, we exploit subnational variation in agricultural comparative advantage following NAFTA and find strong evidence that rural voters in uncompetitive local communities were less likely to support both international trade and the Democratic presidential candidates who promoted NAFTA. Future research could examine whether other PTAs, exogenous climate shocks, technological innovations, or government regulations elicit similar reactions from rural communities in affected areas, thereby shaping the rural–urban cleavage.
Our findings suggest that rural residents and laborers are often politically aligned with the interests of landowning farmers (Ballard-Rosa, Carnegie, and Schonfeld Reference Ballard-Rosa, Carnegie and Schonfeld2023; Thomson Reference Thomson2019). Historically, however, this alignment has frequently failed to materialize. Instead, class conflict between landowners and rural laborers—commonly framed as the struggle between “lord and peasant”—has characterized many agrarian societies (Moore Reference Moore1966). One important factor underlying this shift may be the mechanization of agriculture, which reduced landowners’ reliance on labor repression and facilitated democratic transitions (Samuels and Thomson Reference Samuels and Thomson2021). Once labor rights are institutionalized and agriculture ceases to be labor-repressive, rural laborers and landowning farmers may increasingly be drawn into political coalitions.
The political nature of rural populations has long occupied the attention of scholars, from early thinkers like Adam Smith and Karl Marx to more contemporary social scientists, such as Seymour Martin Lipset and Charles Tilly. Marx and Engels (Reference Marx and Friedrich2002) famously referred to “the idiocy of rural life,” portraying the countryside as stagnant, intellectually narrow, and politically uninformed compared to urban life. Tilly (Reference Tilly1974), however, disputed this stereotypical image, arguing that rural workers and peasants were economically rational actors—responsive to market forces, capable of defending their interests, and politically engaged.Footnote 27 Our findings are consistent with the latter view and raise the possibility that the economic and cultural characteristics of rural communities might render their residents better informed about the consequences of trade and globalization than the average citizen.
SUPPLEMENTARY MATERIAL
To view supplementary material for this article, please visit https://doi.org/10.1017/S0003055426102111.
DATA AVAILABILITY STATEMENT
Research documentation and data that support the findings of this study are openly available at the American Political Science Review Dataverse: https://doi.org/10.7910/DVN/CD5SCK.
ACKNOWLEDGEMENTS
For thoughtful comments, we thank Stephen Chaudoin, Thomas Flaherty, Jeffry Frieden, Robert Gulotty, Yoram Haftel, Sung Eun Kim, Yotam Margalit, Helen Milner, Margaret Peters, Ronald Rogowski, Nita Rudra, Melle Scholten, Theo Serlin, Randy Stone, Michael Tomz, and the reviewers and editors of the APSR. We also benefited from comments of participants at the 2025 annual meeting of the International Political Economy Society and participants at the LSE 2026 Conference on the Global Economy in a Changing World Order. Rumi Morishima and Itamar Schlesinger provided excellent research assistance.
AUTHOR CONTRIBUTIONS
Authors are listed in alphabetical order.
FUNDING STATEMENT
This research was funded by the Christopher H. Browne Center for International Politics at the University of Pennsylvania, and the Israel Science Foundation (Grant No. 929/24).
CONFLICT OF INTEREST
The authors declare no ethical issues or conflicts of interest in this research.
ETHICAL STANDARDS
The authors affirm this research did not involve human participants.


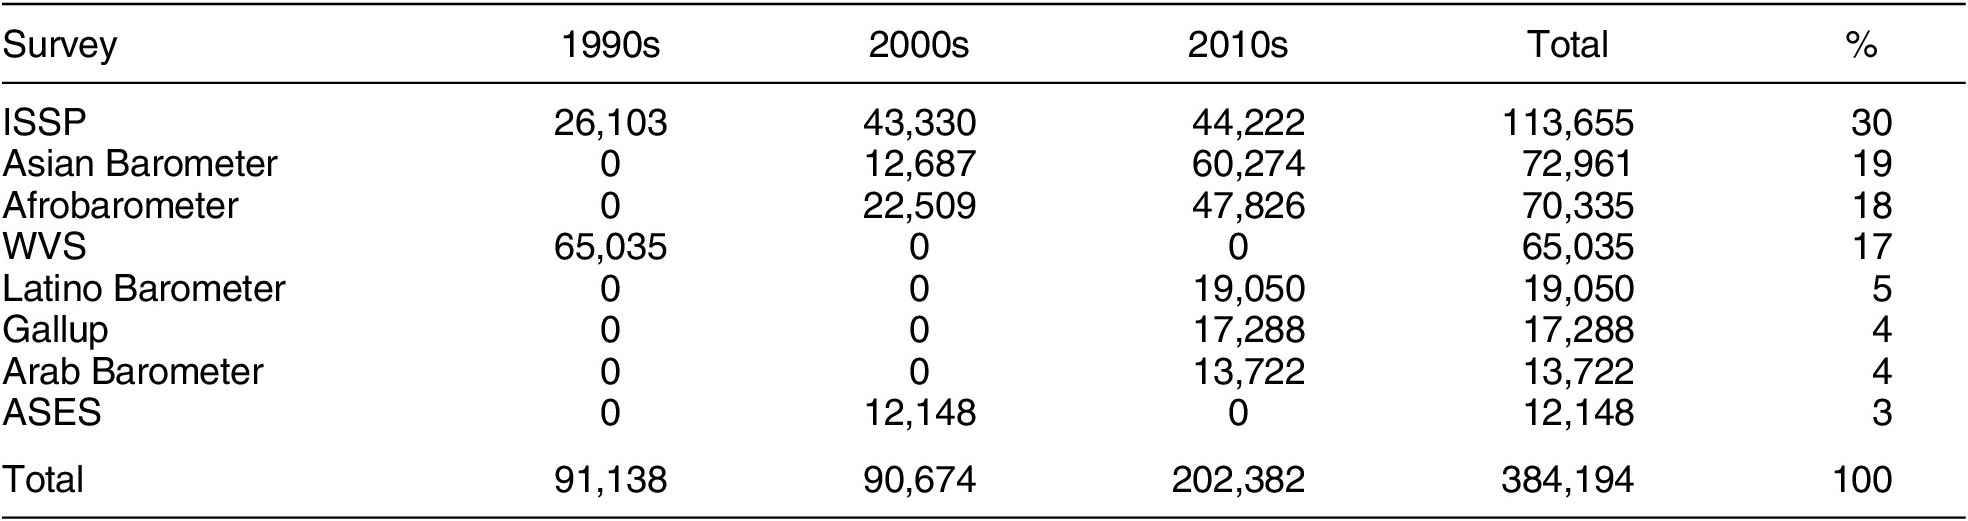

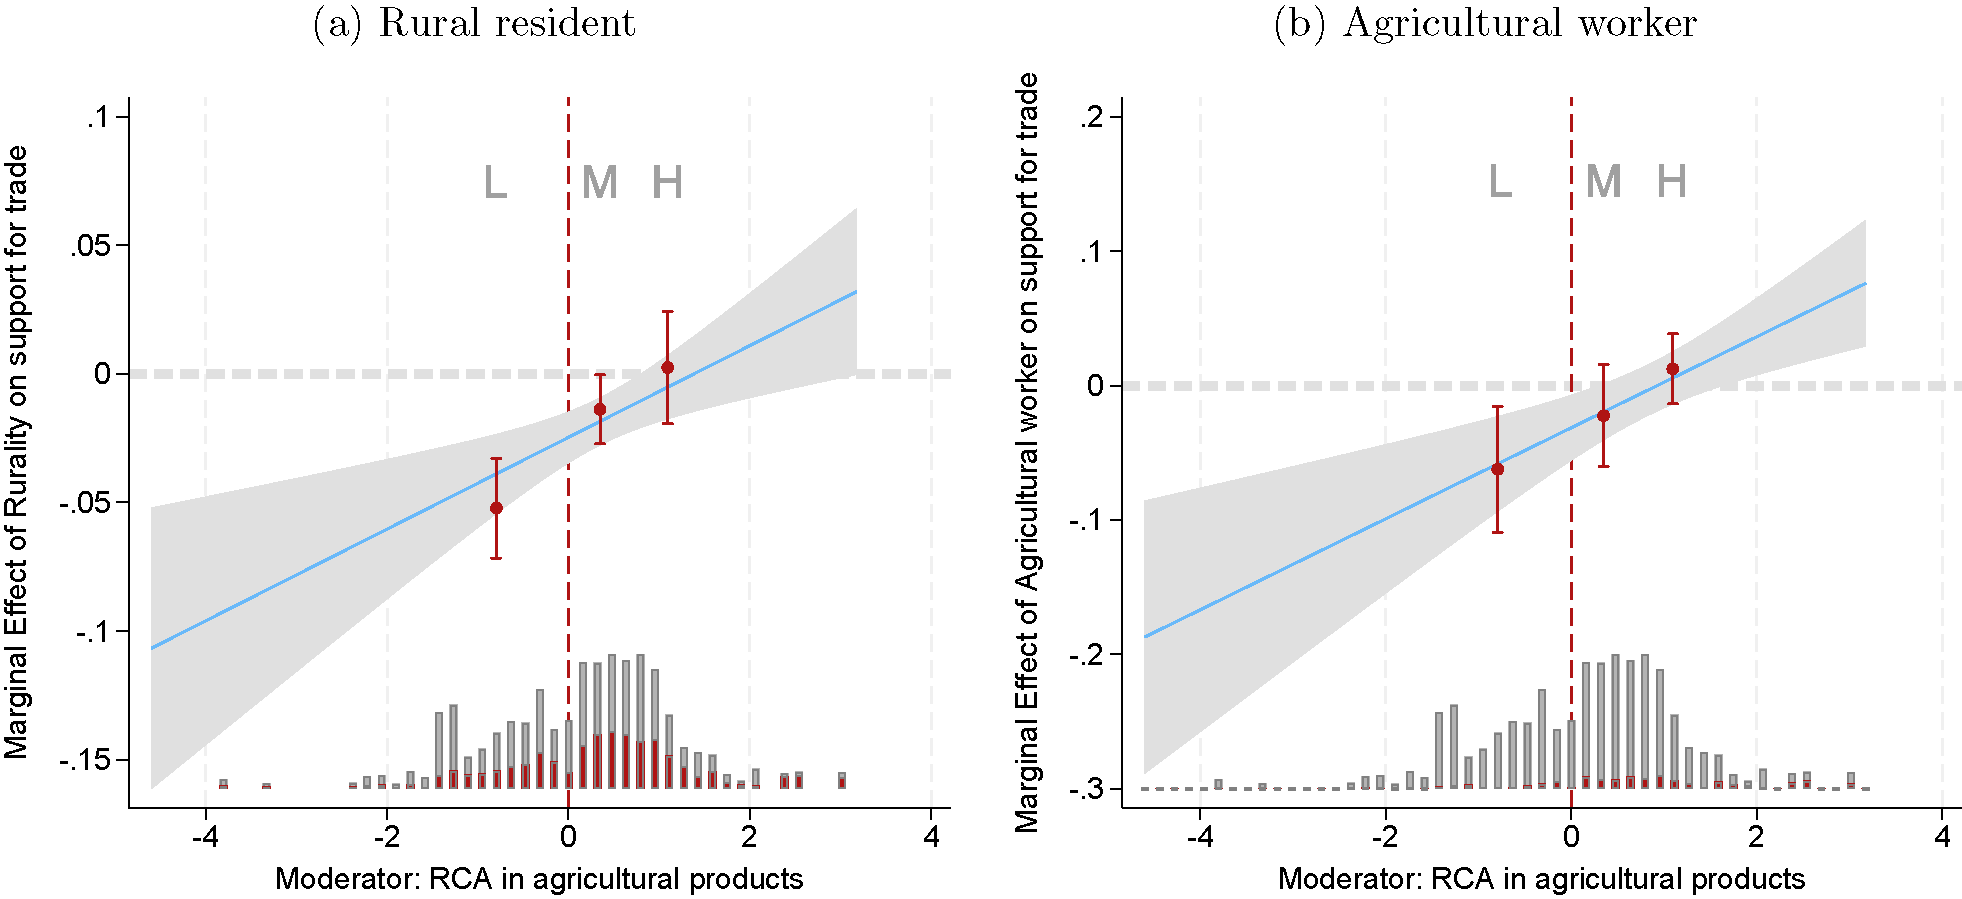
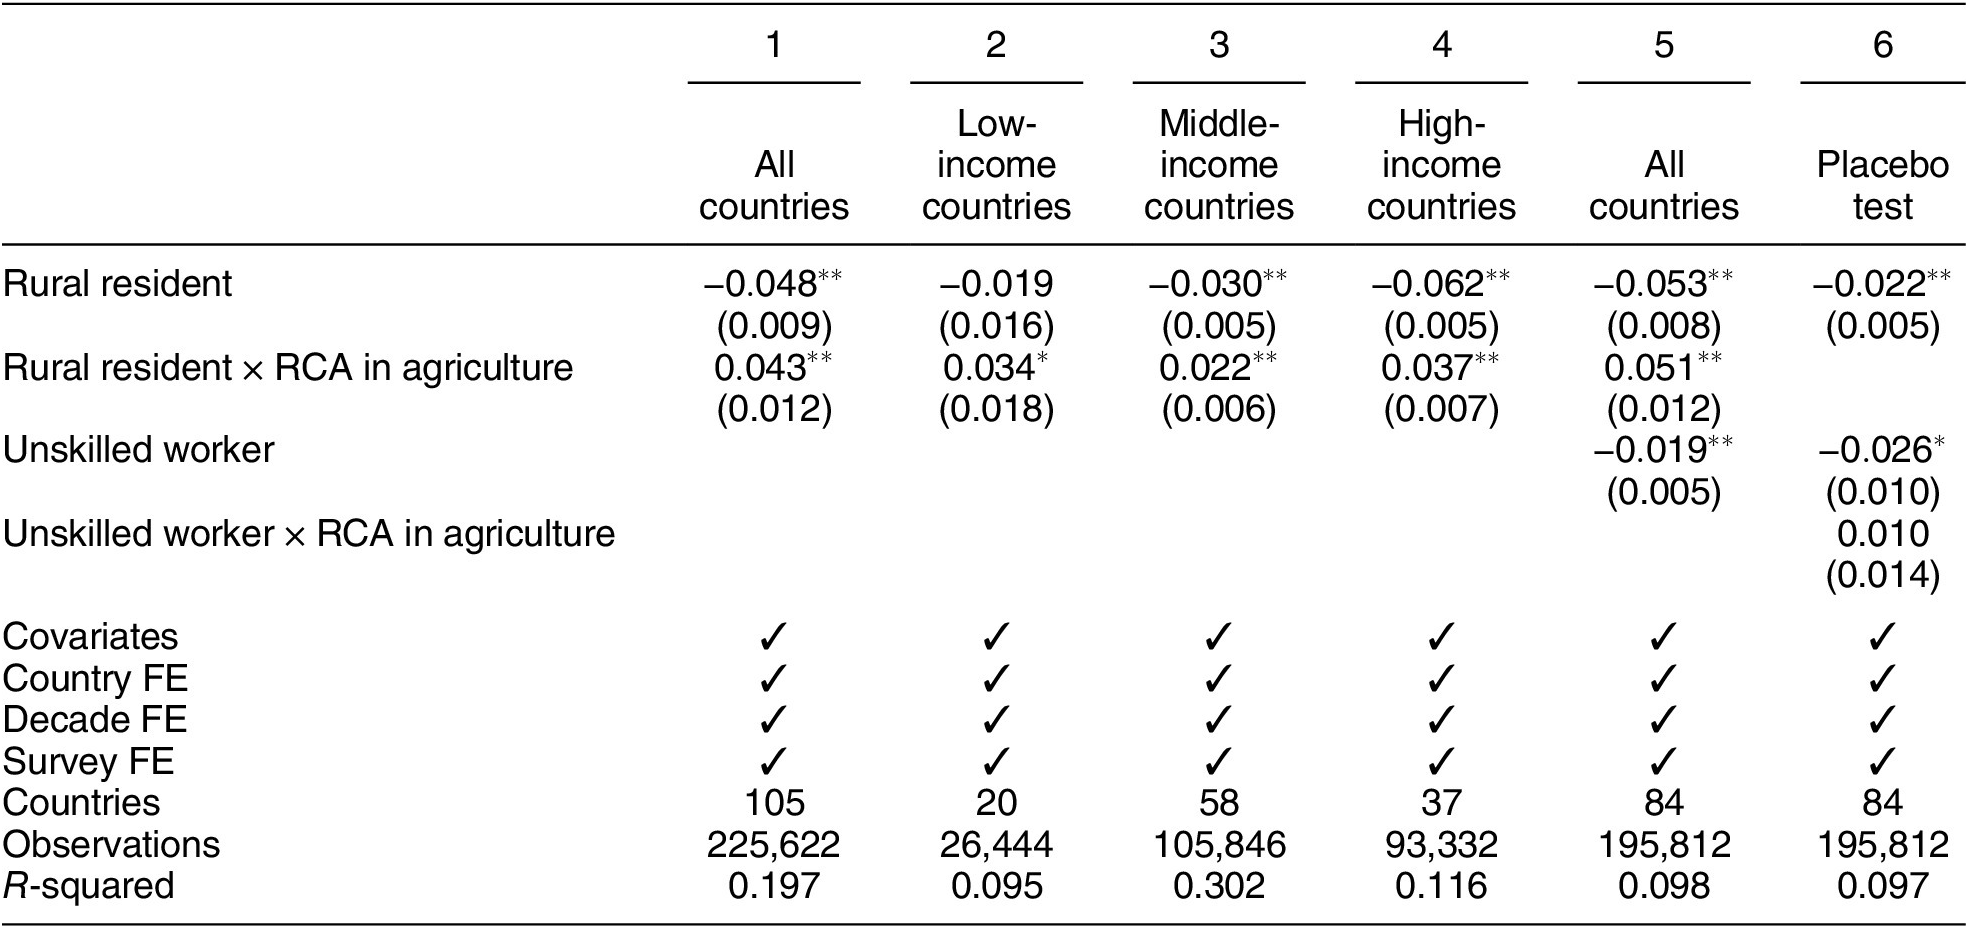
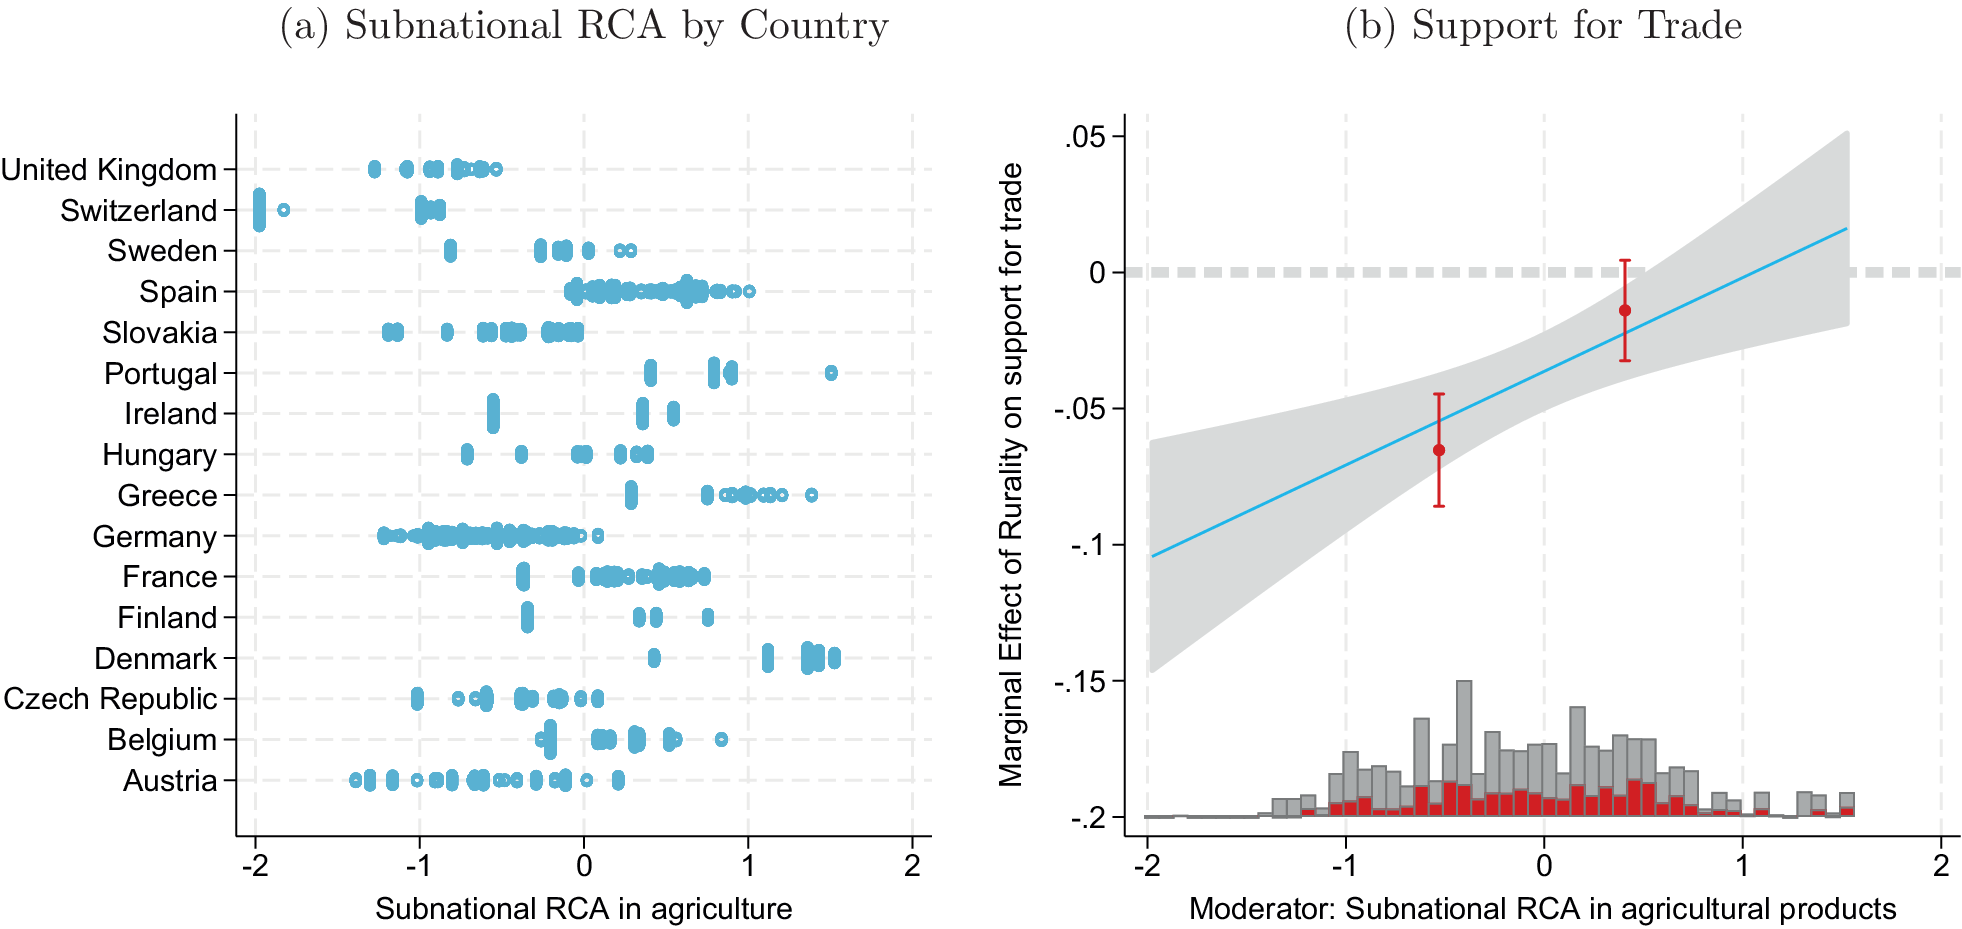
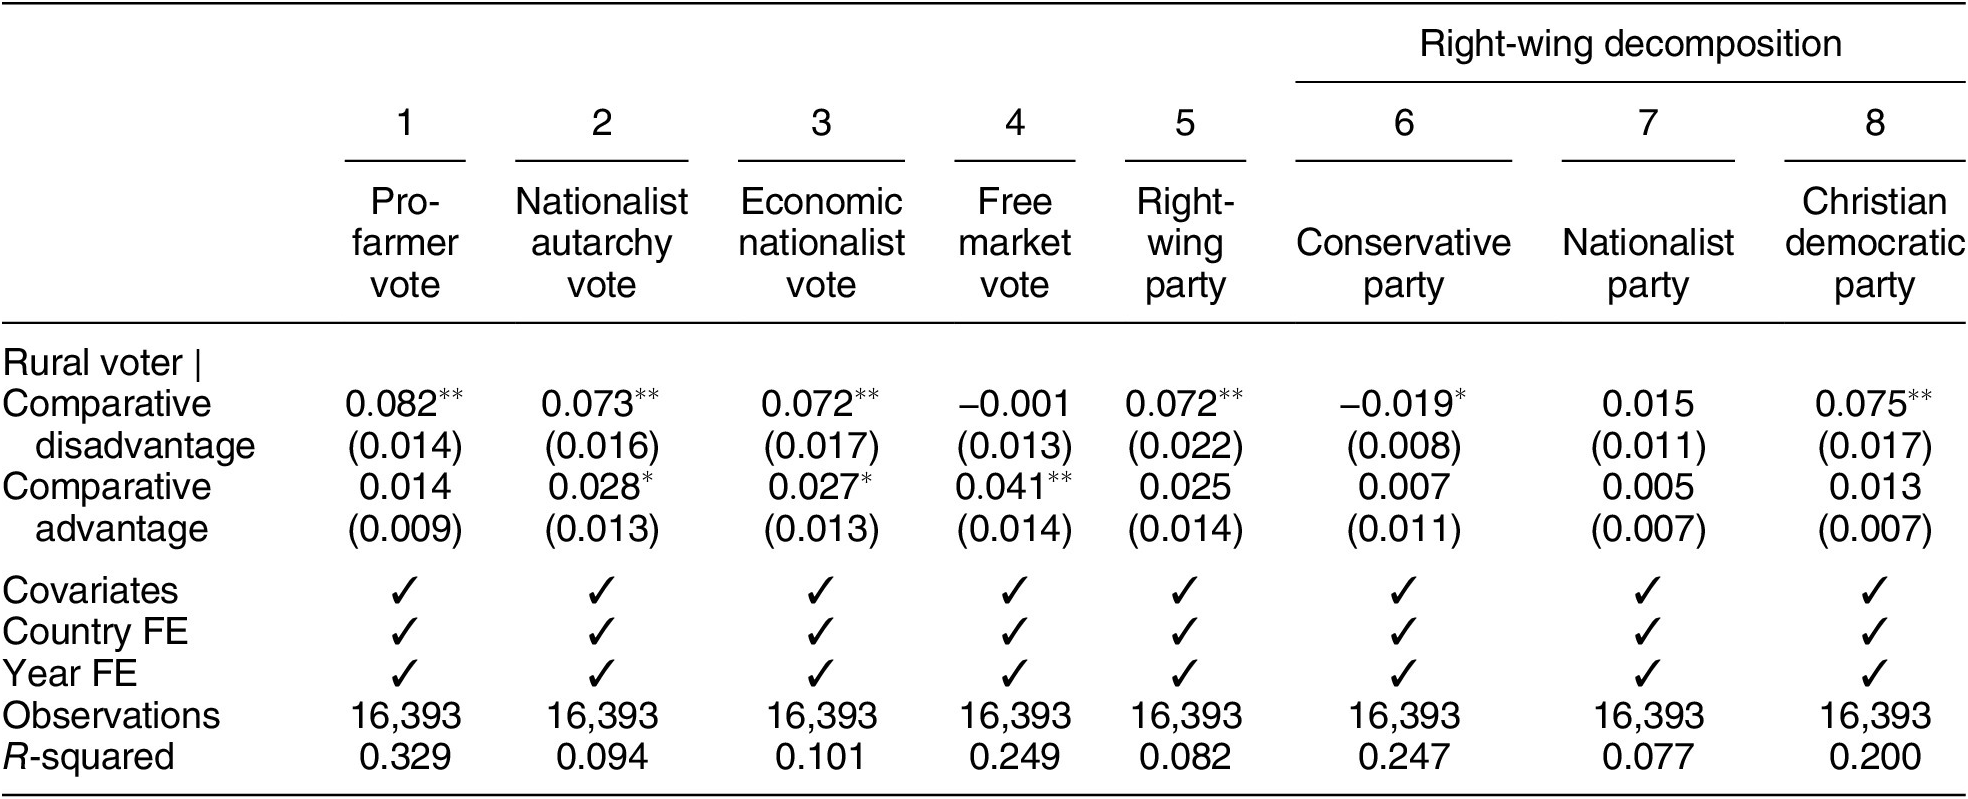
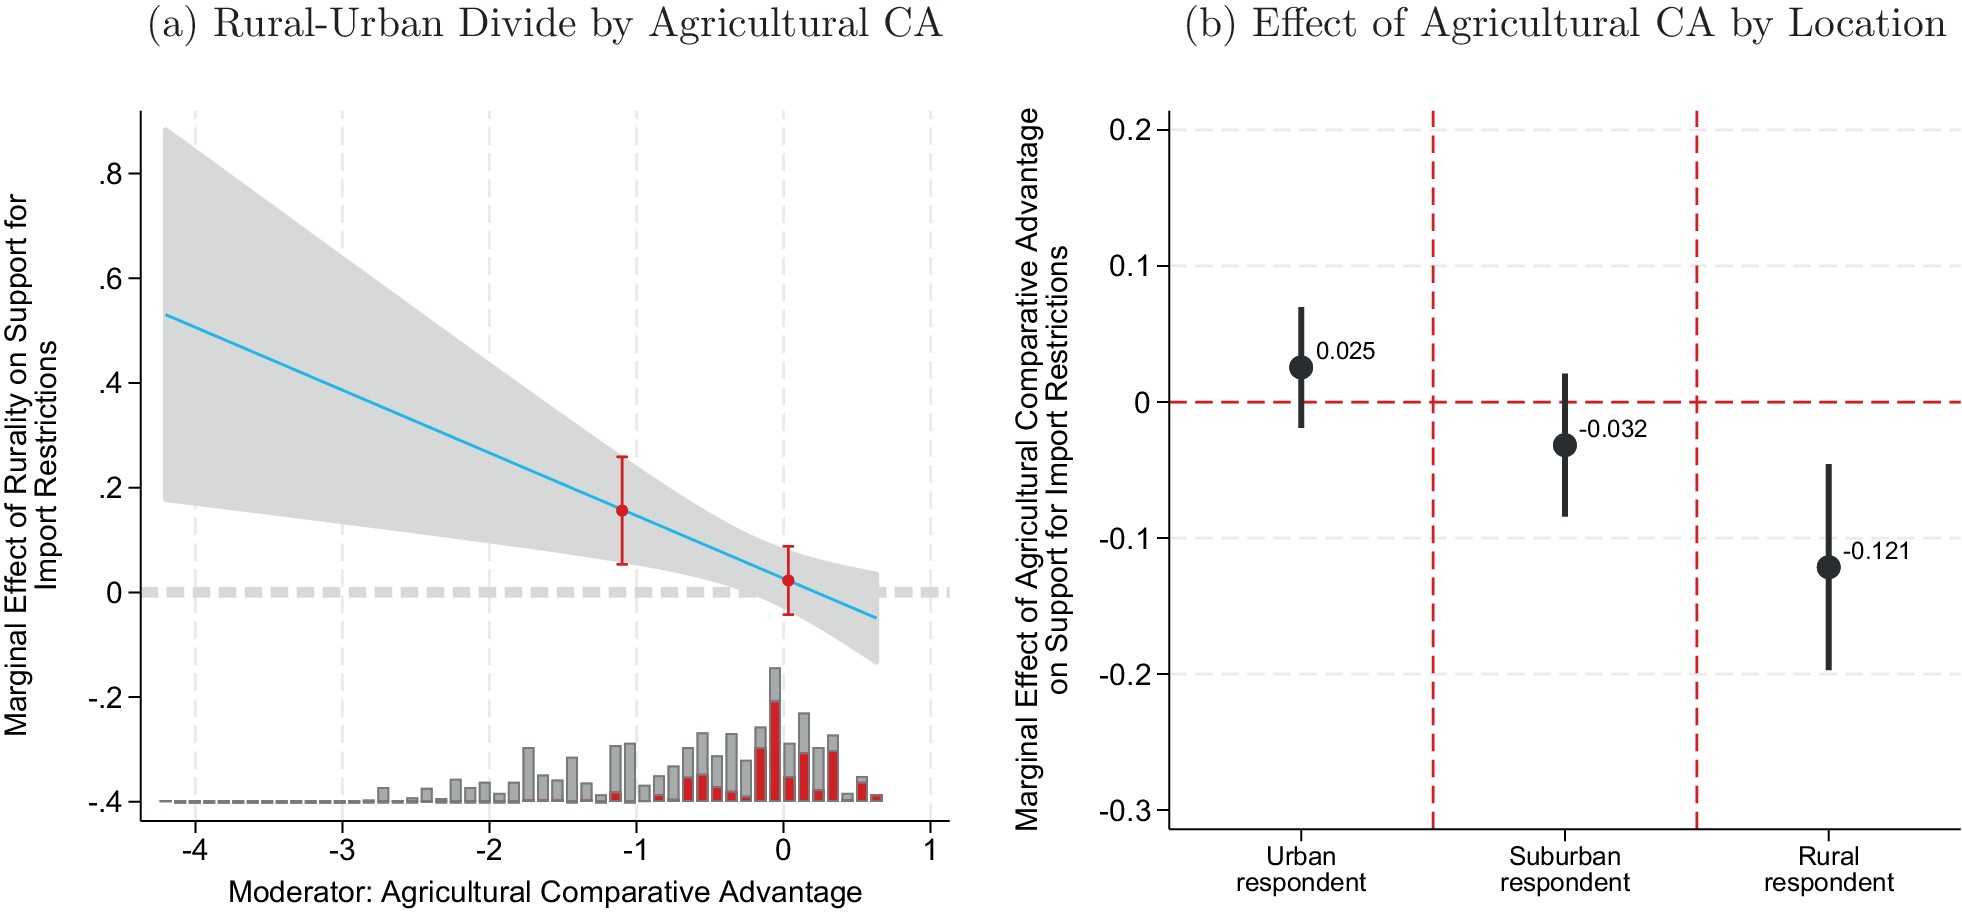
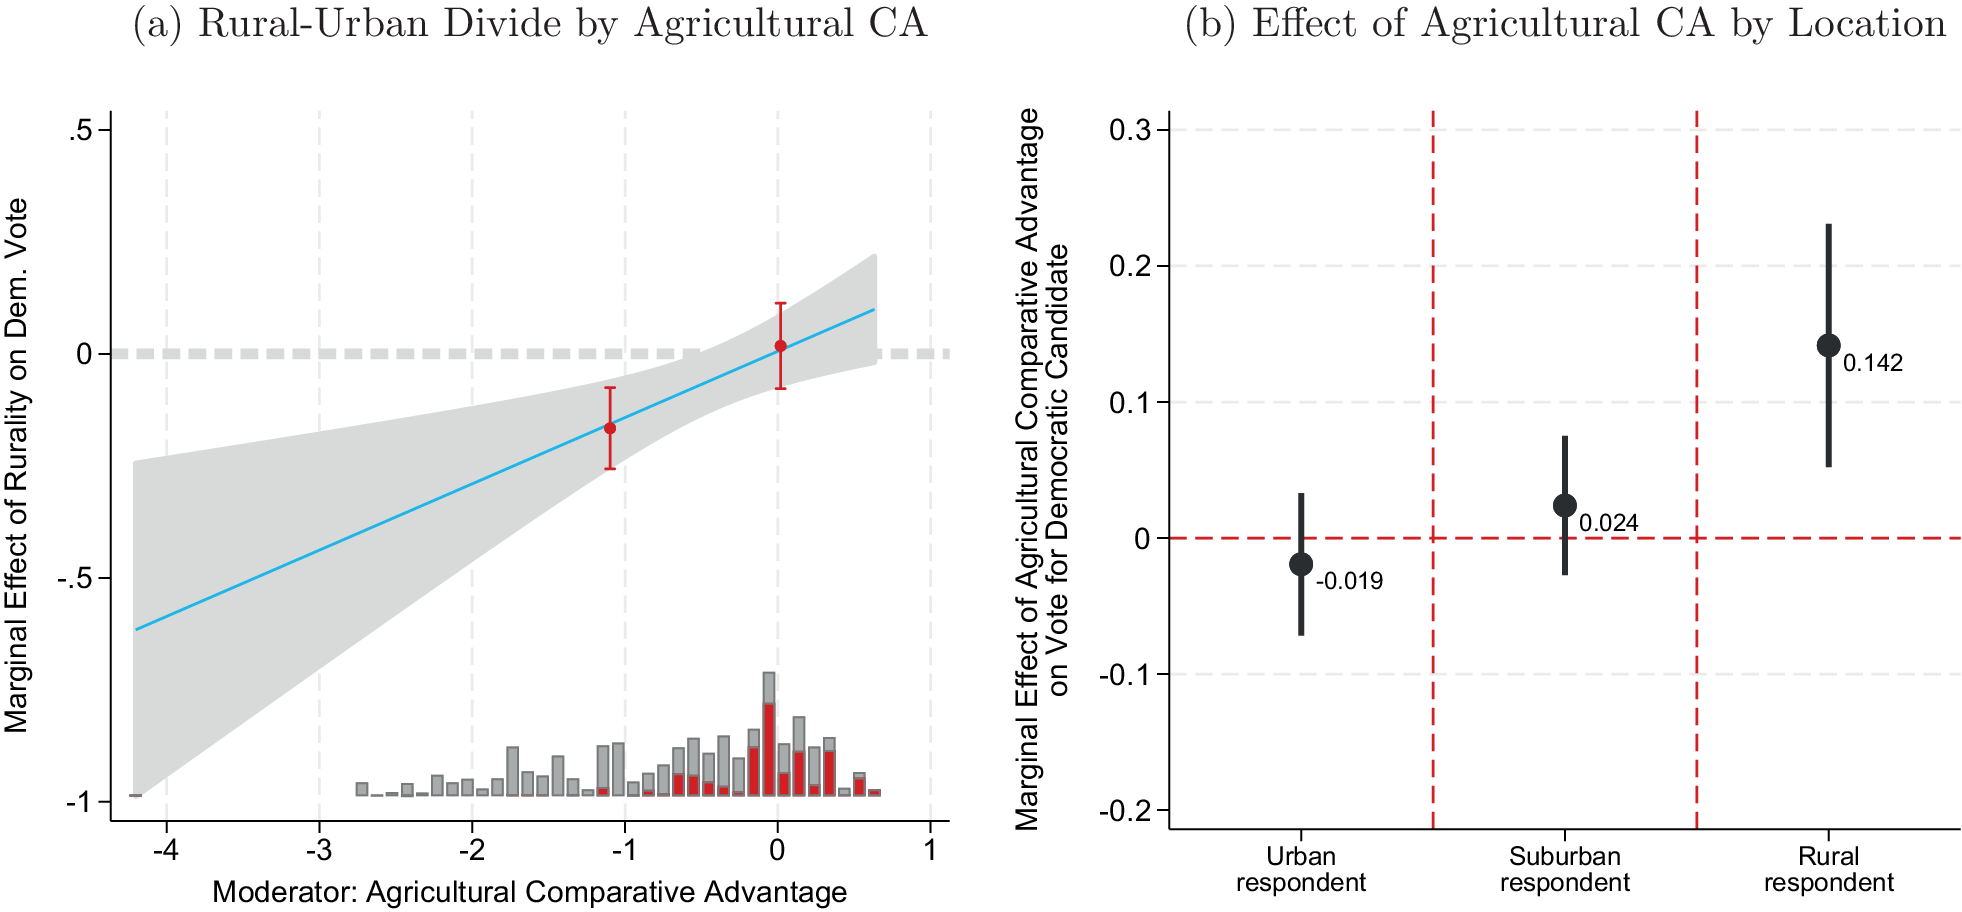
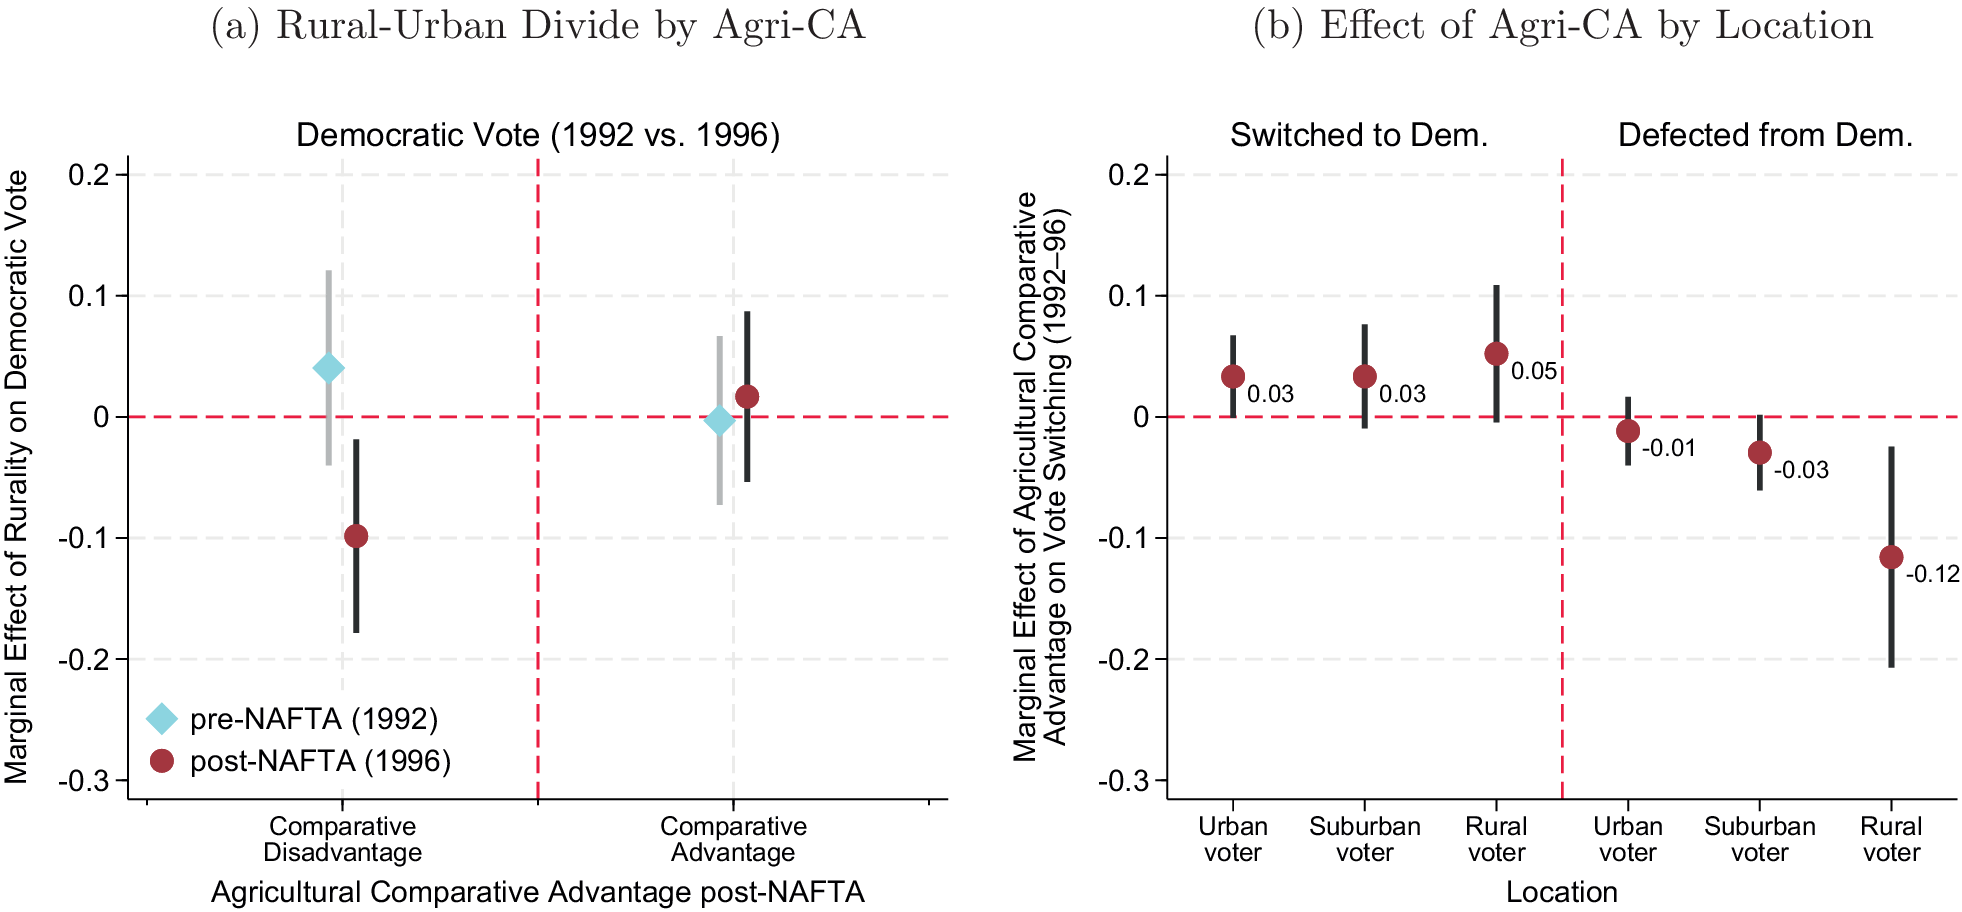


 Open access


Comments
No Comments have been published for this article.