Introduction
Alfalfa (Medicago sativa L.) (Fabales: Leguminosae) is the most extensively cultivated forage crop globally and is planted in over 80 countries (Cecen et al., Reference Cecen, Gurel and Karaca2008; Al-Kahtani et al., Reference Al-Kahtani, Taha and Al-Abdulsalam2017). It serves as a rich source of high-quality proteins and amino acids for livestock (Shi et al., Reference Shi, Nan and Smith2017). As the demand for alfalfa increases due to the growing livestock industry, the area dedicated to its cultivation continues to expand. However, to date, the actual supply of seed yield is still lower than expected (Haedo et al., Reference Haedo, Martínez, Graffigna, Marrero and Torretta2022). Alfalfa is a gynomonoecious and cross-pollinated species, its seed yield heavily depends on pollinators due to tripping agents; that is, pollination is only completed when pollinators open the unique keel petals of alfalfa flowers (Bohart, Reference Bohart1957). Thus, pollinators play a pivotal role in alfalfa seed yield, and effective pollination is essential for maximising seed yields (Pitts-Singer and Bosch, Reference Pitts-Singer and Bosch2010). Given this, it is necessary and urgent to deepen the understanding of the interactions between alfalfa and its pollinators, especially in relation to seed yield.
Approximately 70% of flowering plants in both natural and agricultural ecosystems rely on pollinators for reproduction (Ollerton et al., Reference Ollerton, Winfree and Tarrant2011). For alfalfa, the relationships between seed yield and their wild pollinators have received attention. Most studies to date have focused on the community composition of pollinators and found that bees were the main pollinators of alfalfa (Requier et al., Reference Requier, Pérez-Méndez, Andersson, Blareau, Merle and Garibaldi2023). Several wild bee species have been recognised as effective pollinators of alfalfa, including Megachile abluta, M. cephalotes, and M. lanata, all of which are closely associated with alfalfa seed yield (Wang et al., Reference Wang, Liu, Huang, Zhang, Deng, Li and Jin2012; Rauf et al., Reference Rauf, Saeed, Ali and Nadeem2021). Among these bee species, megachilids have been shown to have remarkable effects on increases in alfalfa seed yield (Shebl et al., Reference Shebl, Kamel, Abu Hashesh and Osman2008; Bao et al., Reference Bao, Zhu, Wester, Wang, Li, Ren, Yan and Wan2025). Despite their crucial role in plant reproduction, wild pollinators have been reported to decline due to climate change, habitat loss, and pesticide use (Greenleaf and Kremen, Reference Greenleaf and Kremen2006; Goulson et al., Reference Goulson, Nicholls, Botías and Rotheray2015). Domestic bees, particularly honeybees (Apis mellifera), have been widely introduced to maintain crop yields (Robinson et al., Reference Robinson, Cartar, Pernal, Waytes and Hoover2023), including alfalfa. Research on alfalfa pollination has shown that seed yield increased with higher bee density, with a yield peak at approximately 20 individuals/m2 (Al-Kahtani et al., Reference Al-Kahtani, Taha and Al-Abdulsalam2017; Bao et al., Reference Bao, Zhu, Wester, Wang, Li, Ren, Yan and Wan2025). However, honeybees have relatively low open tripping rates, limiting their effectiveness for alfalfa pollination (Bauer et al., Reference Bauer, Clayton and Brunet2017). As a result, alternative pollinators such as M. rotundata and B. terrestris have been introduced owing to exhibiting higher tripping rates, which could improve seed yields of alfalfa (Cane, Reference Cane2002; Robinson et al., Reference Robinson, Cartar, Pernal, Waytes and Hoover2023; Messellem et al., Reference Messellem, Aguib, Derradj and Shebl2025). For example, alfalfa seed yields have been shown to increase by 1.8–2.2 fold under the visitation of M. rotundata, and increased by 14% in the treatments of B. terrestris, compared to honeybee-systems (Cecen et al., Reference Cecen, Gurel and Karaca2008; Renzi et al., Reference Renzi, Coito, Reinoso, Quintana, Garcia and Cantamutto2022). Additionally, the effects of domestic megachilids and bumblebees on alfalfa yield are also density-dependent. Maximum yields have been observed at approximately 150,000 M. rotundata per ha, while B. lucorum performed best at a density of 10 individuals/m2 (Pitts-Singer and Bosch, Reference Pitts-Singer and Bosch2010; Pitts-Singer, Reference Pitts-Singer2013; Bao et al., Reference Bao, Zhu, Wester, Wang, Li, Ren, Yan and Wan2025). The above studies highlight the importance of domestic bees in achieving optimal densities for effective pollination of alfalfa. However, researchers found that wild bees enhance crop yield more, and domestic bees only serve as a supplement rather than a replacement for wild pollinators (Garibaldi et al., Reference Garibaldi, Steffan-Dewenter, Winfree, Aizen, Bommarco, Cunningham, Kremen, Carvalheiro, Harder, Afik, Bartomeus, Benjamin, Boreux, Cariveau, Chacoff, Dudenhoeffer, Freitas, Ghazoul, Greenleaf, Hipolito, Holzschuh, Howlett, Isaacs, Javorek, Kennedy, Krewenka, Krishnan, Mandelik, Mayfield, Motzke, Munyuli, Nault, Otieno, Petersen, Pisanty, Potts, Rader, Ricketts, Rundlof, Seymour, Schueepp, Szentgyoergyi, Taki, Tscharntke, Vergara, Viana, Wanger, Westphal, Williams and Klein2013; Klein et al., Reference Klein, Boreux, Fornoff, Mupepele and Pufal2018). Fewer studies indeed provide a clear understanding of the effects of these wild pollinators on alfalfa seed yield.
Wild pollinators have been shown to vary their diversity and abundance across different landscape types in a local site (Gaspar et al., Reference Gaspar, Loureiro, Castro, Siopa, Castro, Casais and Castro2022). For instance, meadows supported higher abundance and richness of wild bees than woodlands (Maurer et al., Reference Maurer, Sutter, Martínez‐Núñez, Pellissier and Albrecht2022). Similarly, there are differences in pollinator diversity across different landscapes at a regional scale. Changes in pollinator diversity at the regional scale are influenced by not only the difference in climatic factors (Nielsen et al., Reference Nielsen, Reitan, Rinvoll and Brysting2017) but also the synergism of landscape type and climate (Cohen et al., Reference Cohen, Best, DeVries, Vickruck and Galpern2025; Ganuza et al., Reference Ganuza, Redlich, Rojas-Botero, Tobisch, Zhang, Benjamin, Englmeier, Ewald, Fricke, Haensel and Kollmann2025). Woodland and grassland landscapes support the higher pollinator abundance and diversity, while agricultural and urban landscapes cause declines in pollinator abundance and diversity across different European biogeographic regions (Bottero et al., Reference Bottero, Dominik, Schweiger, Albrecht, Attridge, Brown, Cini, Costa, De la Rúa, de Miranda and Di Prisco2023). In regions with higher air temperatures, pollinator communities exhibited an increase in species richness and a decrease in abundance relative to regions with cooler temperatures (Oldham et al., Reference Oldham, Herold, Moulton, Gonzalez and Russo2025; Zanini et al., Reference Zanini, Dainese, Obwegs, Guariento, Kopf, Anderle, Leitinger and Tappeiner2026). Given the importance of pollinators on plant reproduction, the differences in pollinator diversity across different landscape types at varied regional scales may likely drive plant reproduction (Laterza et al., Reference Laterza, Ragone, Grossi, Cappellari, Agostinacchio, Seclì, Bari, Porro, Addante, Cornara and de Lillo2025). Meanwhile, plant reproduction can also be directly or indirectly affected by landscape types and climate factors (Toro-Manríquez et al., Reference Toro-Manríquez, Herrera, Soler, Lencinas and Pastur2023). Alfalfa is widely planted in different landscapes across a regional scale (Wang et al., Reference Wang, Liu, Huang, Zhang, Deng, Li and Jin2012; Shi et al., Reference Shi, Nan and Smith2017). However, whether and how geographic variation in alfalfa reproduction is affected by the combined effects of climate and pollinators, especially for different landscape types remains poorly understood.
In north-eastern China, alfalfa is often cultivated across heterogeneous landscapes, we hypothesise that pollinator richness and abundance differ significantly among diverse planting sites, and that these differences in pollinator diversity, together with climatic factors and landscape context, affect alfalfa seed yield in this study. Accordingly, we addressed two specific questions: (1) How do the diversity and abundance of floral visitors vary among alfalfa plantation sites with different landscape types? (2) How do changes in pollinator communities, in combination with climatic variables, influence alfalfa seed yield?
Materials and methods
Study site
This study was conducted in three experimental stations in north-eastern China: (1) Gongzhuling (GZL) of the Institute of Plant Protection, Jilin Academy of Agricultural Sciences; (2) Changling (CL) of the Jilin Songnen Grassland Ecosystem National Observation and Research Station; and (3) Harbin (HB) of the Institute of Forage and Grassland Sciences, Heilongjiang Academy of Agricultural Sciences (Figure S1). The distance among these three sites was greater than 150 km. All of the sites were located in the temperate zone with a continental monsoon climate but had distinct climate conditions (air temperature and precipitation amounts) (Table S1). The GZL site was located at the outskirts of GZL county, and alfalfa was cultivated over an area of approximately 4.5 ha at the experimental station. Other species of the alfalfa plantation include the perennial grass Leymus chinensis, Plantago asiatica, and Setaria viridis. The CL site was classified as a semi-natural grassland dominated by the L. chinensis, Phragmites australis, Calamagrostis epigejos, Kalimeris integrifolia, and Potentilla flagellaris (Wang et al., Reference Wang, Delgado-Baquerizo, Wang, Isbell, Liu, Feng, Liu, Zhong, Zhu, Yuan, Chang and Liu2019). Nearby, an alfalfa cultivation area covered approximately 5 ha. The HB site is categorised as farmland, with an alfalfa cultivation area of approximately 4 ha. Other crop plants include Zea mays, Glycine max, Solanum tuberosum, and Oryza sativa.
Study organism
Alfalfa is a cross-pollinating species, and its flowers have an explosive system where the anthers and the stigma are exposed only when the flower is tripped by a visitor. Tripping is an indispensable step for alfalfa reproduction because the process of pollination is completed only when the flowers are tripped (Bohart, Reference Bohart1957). The non-tripping flowers have only about a 5% probability of pods (Haedo et al., Reference Haedo, Martínez, Graffigna, Marrero and Torretta2022). Thus, the production of alfalfa strongly relies on pollinators. The flowering period of alfalfa occurs from early June to late July in north-eastern China, whereas the blooming period is longer, with approximately 25–30 days. Meanwhile, the pollination efficiency of alfalfa is higher at the blooming stage, when floral visitors are also more diverse. In practice, pollinators are often introduced into alfalfa fields at the blooming stage to maximise pollination and enhance seed production (Hagler et al., Reference Hagler, Mueller, Teuber, Machtley and Van Deynze2011; Zhang et al., Reference Zhang, Gao, Kim, Yu, Jiang, Wang, Zhang, Diao, Wu, Chen, Min, Chen, Sun, Wei and Yan2022).
Floral visitor sampling
Floral visitor surveys at each experimental site were conducted during the blooming stage when visitor abundance was the highest, accounting for approximately 60% of the total number of visitors throughout the entire blooming period in our study (H. Zhu, unpublished data). At each site, three sampling transects (80 m long and 2 m wide) were set up with a distance of 30–50 m between them. We used the sweep net survey method with a light muslin net (40 cm in diameter) along each transect to sample floral visitors, which were identified as those in contact with the reproductive parts of alfalfa flowers. Specifically, we conducted two sweeps per meter while walking slowly (1 m/min) along each transect line. After completing the sweeps for each 1-meter segment, the net was emptied into a vial containing ethyl acetate and stored in a refrigerator at 4°C for later identification. Sampling of each transect at each site lasted 80 min within a sampling round, with one in the morning (9:00–10:30) and the other in the afternoon (13:30–15:00), and the sampling was repeated twice on each sampling date. Visitor surveys were conducted over 2 consecutive days, a total of 960 survey minutes per site. Visitors were collected under sunny and weak windy conditions. The captured insects were pinned, labelled, and identified in the laboratory, referring to reference books and entomology experts. Adult insects were identified as recognisable taxonomic units using published keys with the help of reference specimens, and further classified into bees and hoverflies, respectively. The insect species richness per transect was cumulated by the number of visitor, bee, and hoverfly species, and insect abundance was accumulated by the sum of all individuals for visitors, bees, and hoverflies throughout two sampling dates with morning and afternoon per date in the given year. We pooled floral visitor data from the three sites for further analysis of the relative abundance. The relative abundance of each species was calculated using the formula pi = ni/N, where pi represents the relative abundance of species i, ni is the number of specimens for species i, and N is the total number of specimens (Table S2).
Measurements of alfalfa seed yield
In early August 2021, the pods and seeds of alfalfa were harvested when ripping in the three sites. We randomly selected 20 alfalfa individuals from each transect (the same transect with visitor sampling) at each site, ensuring a distance of at least 4 m between plant individuals. One basal branch of each plant individual was selected, and the number of pods for the alfalfa branch was counted. The number of seeds per pod, with random five pods per branch, was further counted, for a total of 100 pods per transect. The number of pods per branch was calculated by the average of pod number per 20 branches per transect, and the number of seeds per pod was calculated by the average of 100 pods per transect.
Climate variables
Climate data for the three experimental sites were obtained: the climate data for CL and HB were acquired from the records of the local meteorological station, and the climate data of GZL were sourced from the WorldClim database (www.worldclim.org/). We used the mean air temperature and the total precipitation amount during the growing season in the experimental year (April–September 2021) as environmental variables. Mean temperature was calculated as the average of the monthly mean temperatures, and total precipitation amount was obtained by calculating the sum of monthly precipitation amounts from April to September (Table S1).
Statistical analyses
Community composition of floral visitors at the three sites was examined by principal coordinate analysis (PCoA) on the Bray–Curtis dissimilarity index, and the permutational multivariate analysis of variance (PERMANOVA) with Adonis function using the ‘vegan’ package (Oksanen et al., Reference Oksanen, Simpson, Blanchet, Kindt, Legendre, Minchin, O’Hara, Solymos, Stevens, Szoecs, Wagner, Barbour, Bedward, Bolker, Borcard, Carvalho, Chirico, De Caceres, Durand, Evangelista, FitzJohn, Friendly, Furneaux, Hannigan, Hill, Lahti, McGlinn, Ouellette, Ribeiro Cunha, Smith, Stier, Ter Braak and Weedon2013). All data were tested for normality and homogeneity of variances, but no transformations were needed. The differences in the richness and abundance of visitors, bees, and hoverflies among the three experimental sites were analysed using generalised linear mixed models in the R package ‘lme4’ with a Poisson distribution, while the number of pods per branch and the number of seeds per pod were evaluated using the same models with a Gaussian distribution (Hothorn et al., Reference Hothorn, Bretz and Westfall2008). For post hoc comparisons, the ‘agricolae’ package was used with Least Significant Difference tests, and results were considered significant at the level of P < 0.05. Linear and quadratic models were used to examine the relationships between richness and abundance of floral visitors and climatic variables, and the relationships between richness and abundance of floral visitors and alfalfa seed yield, as well as the relationships between climate variables and alfalfa seed yield, respectively. Both linear and quadratic models were selected based on Akaike information criterion (AIC) values and P-values, with the model exhibiting the lowest AIC and P-values deemed the best fit (Goulnik et al., Reference Goulnik, Plantureux, Thery, Baude, Delattre, van Reeth, Villerd and Michelot-Antalik2020). To assess the importance of climate variables and floral visitors for alfalfa seed yield, we performed feature selection using a ‘random forest’ algorithm with the R package ‘Boruta’ (500 trees). Boruta determines whether the importance of each variable is significantly higher than that of a random variable (shadow features) (P < 0.05) by assigning randomness to the data and creating shuffled copies of all parameters as shadow features (Kursa and Rudnicki, Reference Kursa and Rudnicki2010). All data analyses were performed with the software R (version 4.4.1 × 64-bit, 2024; The R Foundation for Statistical Computing).
Results
Diversity and abundance of alfalfa floral visitors
A total of 3017 visitors belonging to 5 orders, 32 families, and 87 species were recorded (Table S2). Diptera (27 species) and Hymenoptera (27 species) were the most abundant visitors of alfalfa, representing 53.40% and 21.94% of all the visitors sampled, respectively (Figure S2a, b). At the order level, the community composition of visitors varied among the three sites. The richness (36.51% of the total number of species) and abundance (28.27% of the total number of individuals) of Hymenoptera were greater in CL than those in GZL and HB, with A. mellifera, Eutricharaea argentata, and Megachile sp. being the main species. The Diptera showed the lowest richness (28.57% of the total number of species) and abundance (30.10% of the total number of individuals) at the CL site (Figure S2c).
From the Venn diagram, 23 species of visitors were shared by the three sites (Figure S3a). Principal coordinates analysis clearly showed that visitor community composition significantly (P = 0.004, PERMANOVA) differed among the three sites. The first principal component (PCoA1) could explain 43.17% of the total variance, and the second principal component (PCoA2) could explain 43.05% of the total variance (Figure S3b).
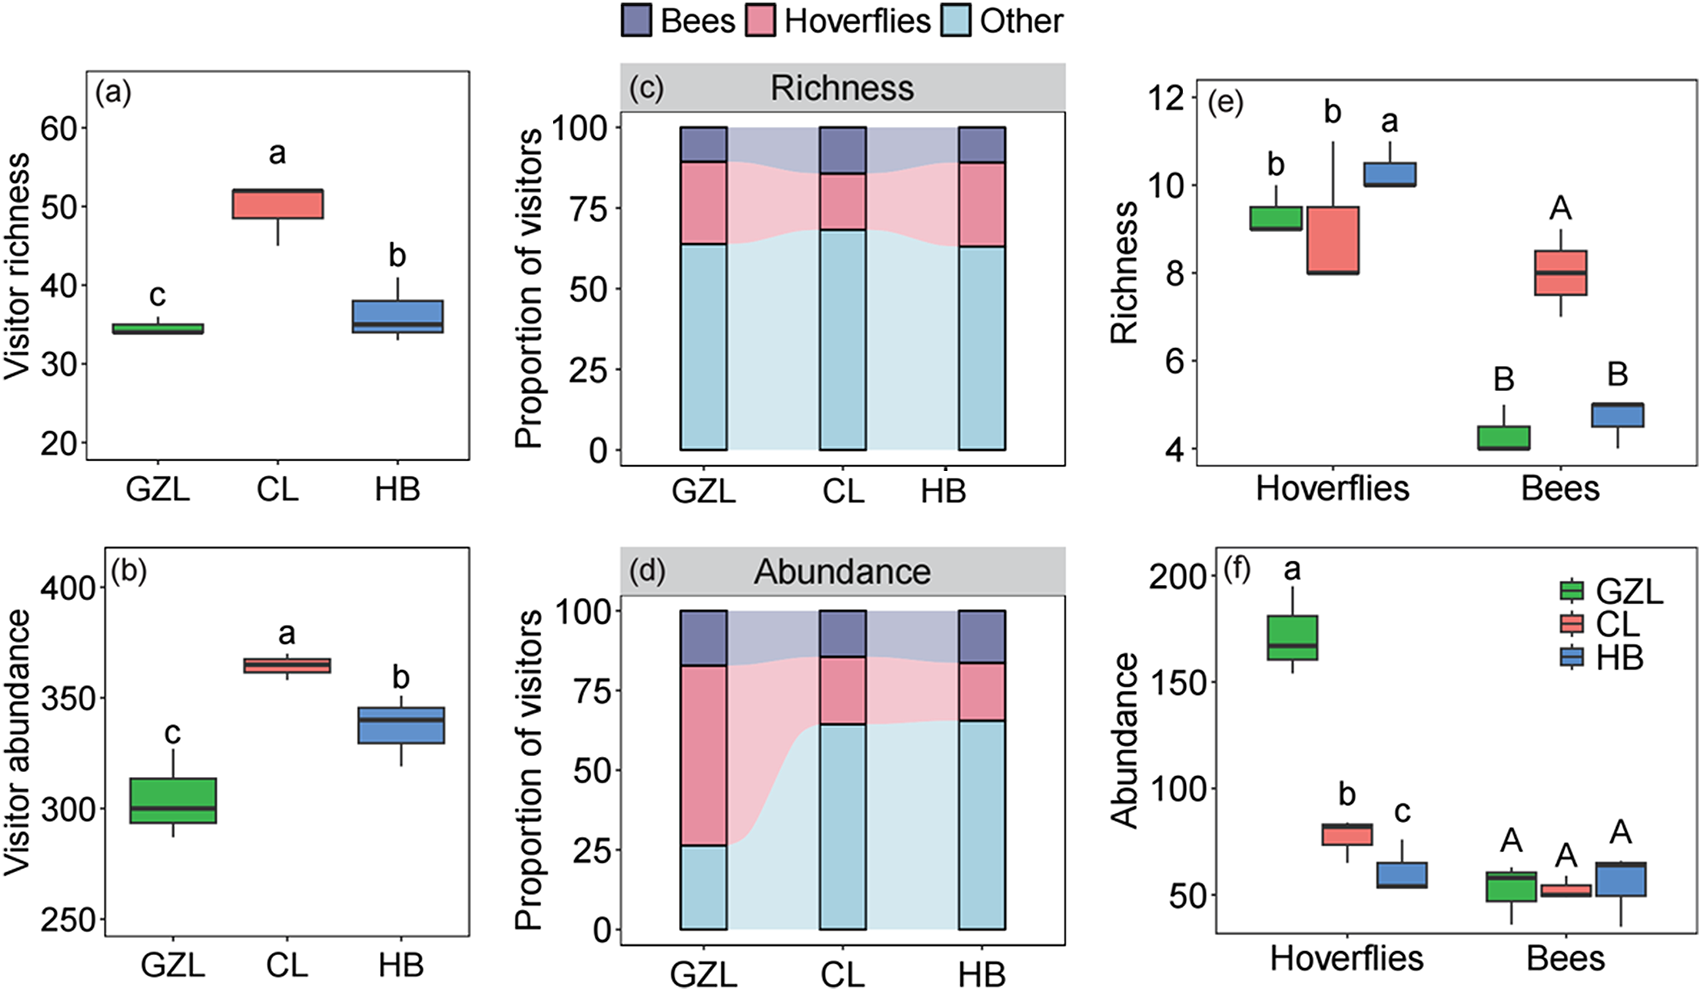
There are significant differences in the richness and abundance of floral visitors observed among the three experimental sites, with the highest numbers found in CL and the lowest in GZL (fig. 1a, b). The proportion of bee and other species richness in CL was higher than that of GZL and HB, whereas the opposite pattern was observed for the hoverfly richness (fig. 1c). The proportion of both bee and hoverfly abundance was higher in GZL than in CL and HB, with the opposite pattern observed for the abundance of other visitor species (fig. 1d). Bee richness in CL was notably greater than in GZL and HB, and the hoverfly richness of HB was significantly higher than that of GZL and CL (fig. 1e). The number of hoverflies showed significant differences among different sites, while there was no difference in the number of bees (fig. 1f).
The difference in richness and abundance of visitors, bees, hoverflies, and visitor composition among the three experimental sites: Gongzhuling (GZL), Changling (CL), and Harbin (HB). The difference in visitor richness(a), visitor abundance (b), richness of bees and hoverflies (e), and abundance of bees and hoverflies (f) among the three experimental sites. The proportions of richness (c) and abundance (d) of bees, hoverflies, and other visitors in the three experimental sites. Different lower or capital letters indicate significant differences among the sites.

Figure 1 Long description
The image contains six graphs comparing visitor richness, abundance and composition across three sites: Gongzhuling (GZL), Changling (CL) and Harbin (HB). Graph (a) is a box plot showing visitor richness. The vertical axis is labeled 'Visitor richness' with values 20, 40, 60. CL has the highest richness, followed by HB, then GZL. Graph (b) is a box plot showing visitor abundance. The vertical axis is labeled 'Visitor abundance' with values 250, 300, 350, 400. CL shows the highest abundance, followed by HB, then GZL. Graph (c) is a stacked bar chart titled 'Richness' with the vertical axis labeled 'Proportion of visitors' and values 0, 25, 50, 75, 100. It shows the composition of bees, hoverflies and others, with CL having a higher proportion of bees. Graph (d) is a stacked bar chart titled 'Abundance' with the vertical axis labeled 'Proportion of visitors' and values 0, 25, 50, 75, 100. GZL shows a higher proportion of hoverflies. Graph (e) is a box plot comparing richness of hoverflies and bees. The vertical axis is labeled 'Richness' with values 4, 8, 12. Hoverflies are richer in HB, while bees are richer in CL. Graph (f) is a box plot comparing abundance of hoverflies and bees. The vertical axis is labeled 'Abundance' with values 0, 50, 100, 150, 200. Hoverflies are more abundant in GZL, while bee abundance is similar across sites. The graphs collectively show that CL generally has higher richness and abundance, with varying compositions of bees and hoverflies across sites.
Alfalfa seed yield
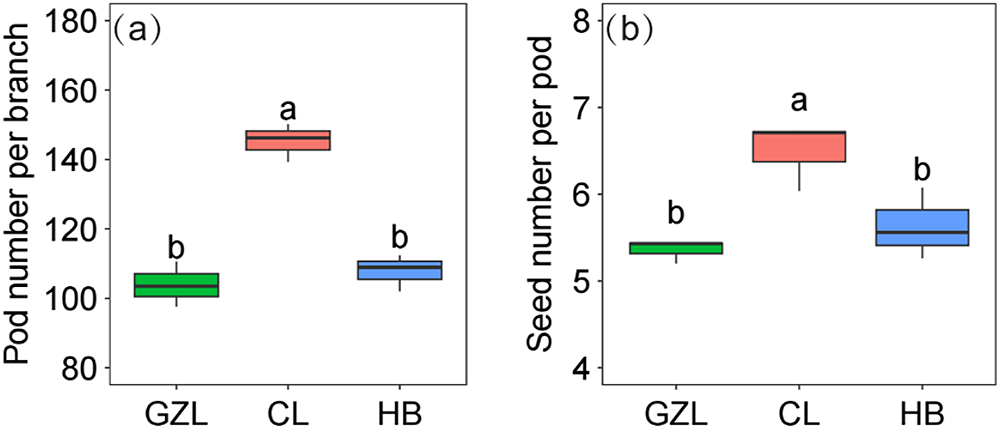
Significant differences in alfalfa seed production were observed among the three experimental sites. Specifically, the number of pods per branch and the number of seeds per pod in CL were significantly higher than in GZL and HB (fig. 2a, b).
The comparison of alfalfa seed production among the three experimental sites: Gongzhuling (GZL), Changling (CL), and Harbin (HB). The difference in the pod number per branch (a) and seed number per pod (b) among the sites. Different lowercase letters (a and b) indicate significant differences among the sites (P < 0.05).

Figure 2 Long description
Panel a shows the pod number per branch across three sites: Gongzhuling (GZL), Changling (CL) and Harbin (HB). The vertical axis ranges from 80 to 180. CL has the highest median pod number, indicated by 'a', while GZL and HB have lower medians, both marked 'b'. Panel b displays the seed number per pod, with the vertical axis ranging from 4 to 8. CL again shows the highest median seed number, marked 'a', whereas GZL and HB have similar lower medians, marked 'b'. The letters indicate significant differences among the sites. CL consistently shows higher values compared to GZL and HB, highlighting its superior seed production.
Effects of climate variables and floral visitors
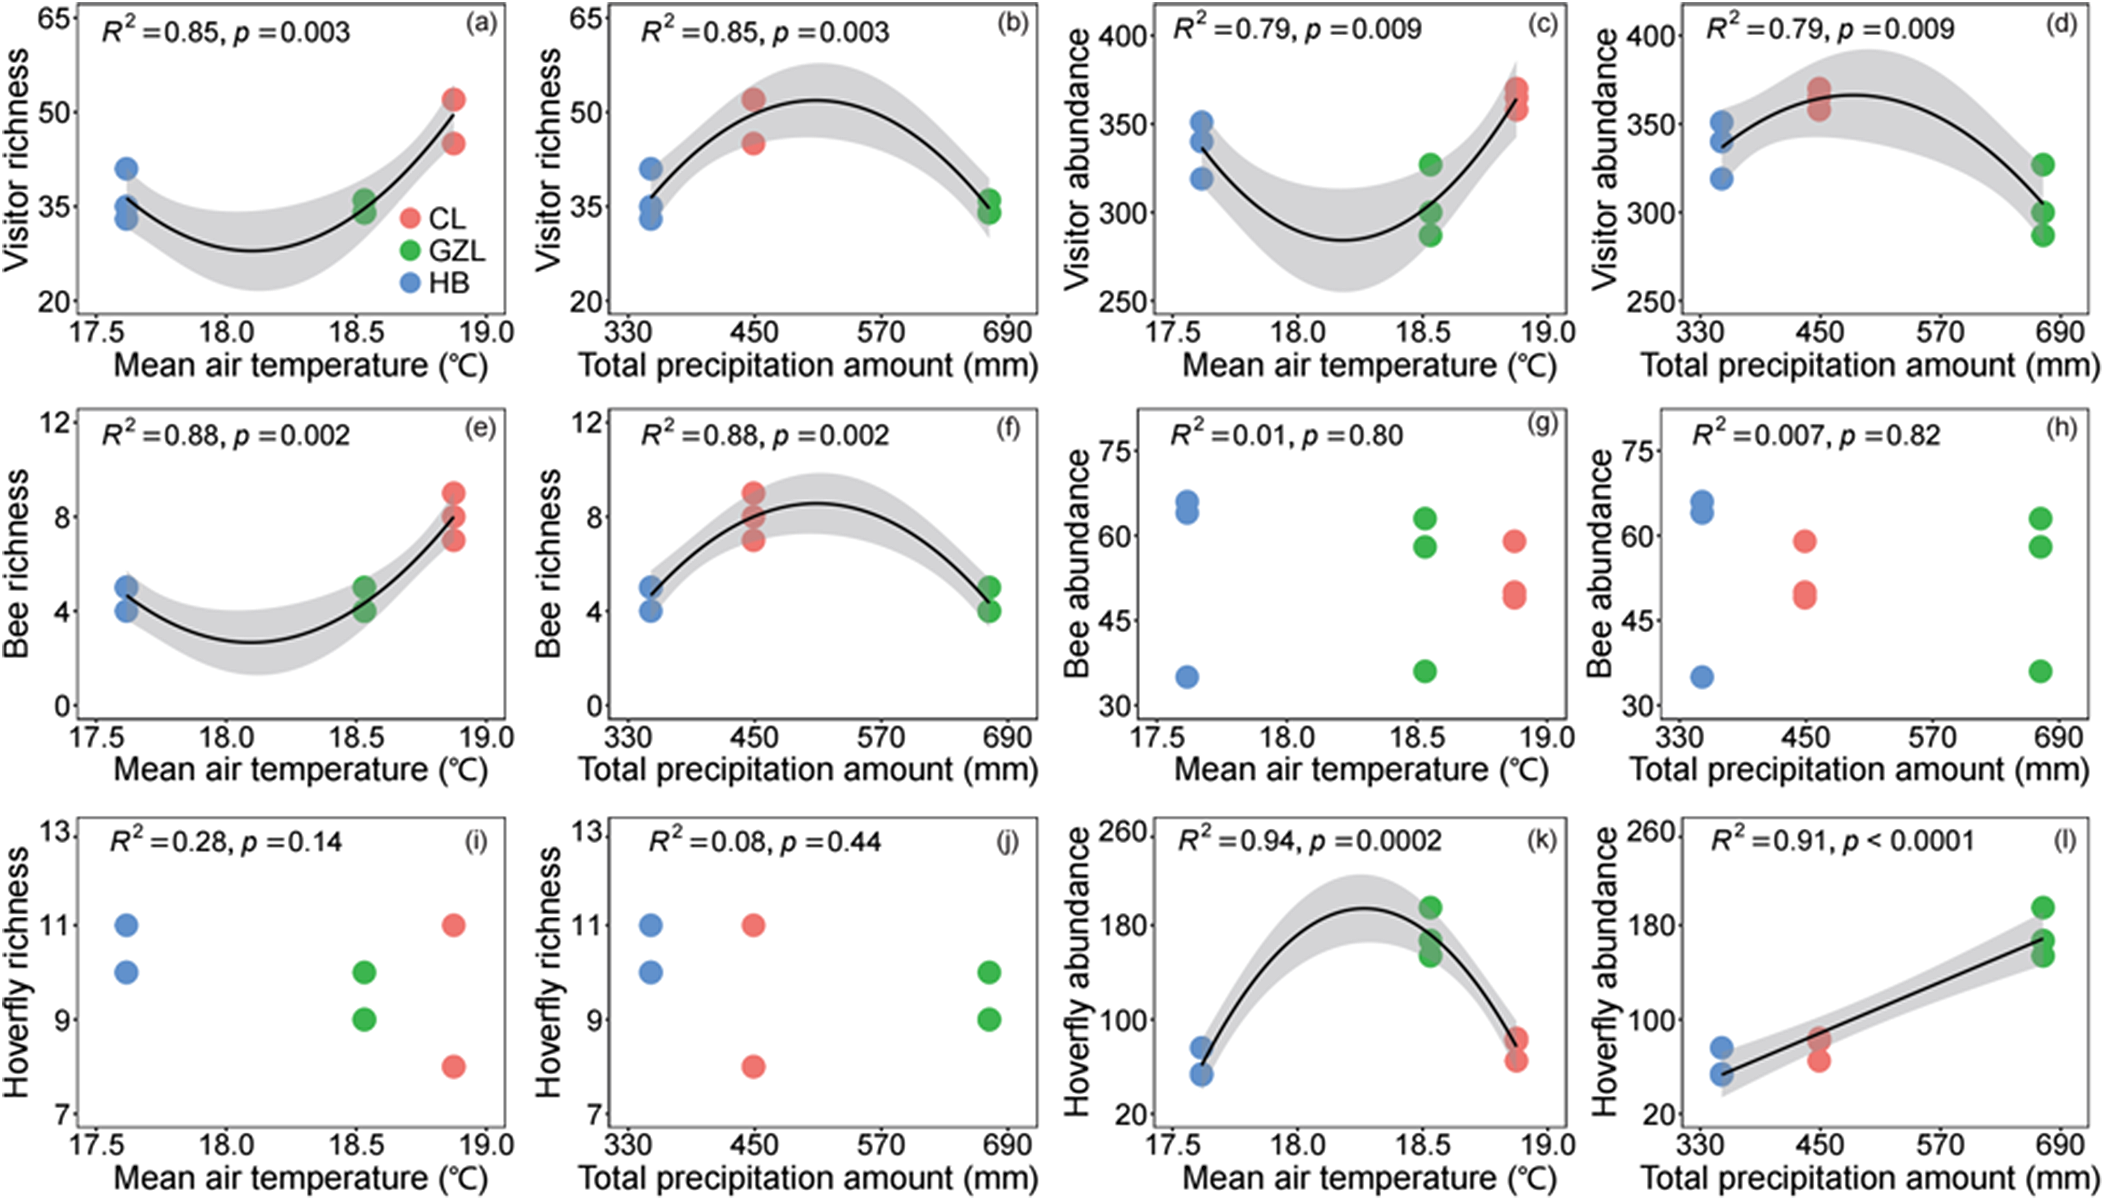
The richness of visitors and bees showed a pattern of first decreasing and then increasing in relation to the mean air temperature during the growing season (fig. 3a, e). No relationship was found between hoverfly richness and mean air temperature (fig. 3i). The richness of both visitor and bee species increased and then decreased with the increasing gradient of total precipitation amount during the growing season (fig. 3b, f). Hoverfly richness was not related to the total precipitation amount (fig. 3j). The abundance of visitors decreased and then increased with the increasing gradient of mean air temperature, whereas hoverfly abundance exhibited an opposite pattern (fig. 3c, k). No relationship was detected between bee abundance and mean air temperature (fig. 3g). The dynamics of the abundance of visitors firstly increased and then decreased with the increasing gradient of total precipitation amount, the abundance of hoverflies significantly increased with total precipitation amount, and there was no relationship between bee abundance and the total precipitation amount (fig. 3d, h, l).
Relationships between the mean air temperature or total precipitation during the growing season of the experimental year and the number of floral visitors (a–d: visitor richness and abundance; e–h: bee richness and abundance; i–l: hoverfly richness and abundance). Black lines show the ordinary least squares regression fits. The grey-shaded areas represent the 95% confidence intervals. GZL, Gongzhuling; CL, Changling; HB, Harbin.

Figure 3 Long description
Twelve scatter plots labeled (a) through (l). Each plot shows points for three groups listed in a legend: CL, GZL, HB. Each plot includes a fitted curve line and a shaded band. (a) Text: R superscript 2 equals 0.85, p equals 0.003. X-axis: Mean air temperature (degree celsius), range 17.5 to 19.0 with tick labels 17.5, 18.0, 18.5, 19.0. Y-axis: Visitor richness, range 20 to 35 with tick labels 20, 25, 30, 35. The fitted curve is U-shaped, with higher values near 17.5 and 19.0 and lower values near 18.5. (b) Text: R superscript 2 equals 0.85, p equals 0.003. X-axis: Total precipitation amount (millimeter), range 330 to 690 with tick labels 330, 450, 570, 690. Y-axis: Visitor richness, range 20 to 35 with tick labels 20, 25, 30, 35. The fitted curve is inverted U-shaped, with higher values near the middle of the precipitation range and lower values near 330 and 690. (c) Text: R superscript 2 equals 0.79, p equals 0.009. X-axis: Mean air temperature (degree celsius), range 17.5 to 19.0 with tick labels 17.5, 18.0, 18.5, 19.0. Y-axis: Visitor abundance, range 200 to 400 with tick labels 200, 250, 300, 350, 400. The fitted curve is U-shaped, with lower values near 18.5 and higher values near 17.5 and 19.0. (d) Text: R superscript 2 equals 0.79, p equals 0.009. X-axis: Total precipitation amount (millimeter), range 330 to 690 with tick labels 330, 450, 570, 690. Y-axis: Visitor abundance, range 200 to 400 with tick labels 200, 250, 300, 350, 400. The fitted curve is inverted U-shaped, with higher values near the middle of the precipitation range and lower values near 330 and 690. (e) Text: R superscript 2 equals 0.88, p equals 0.002. X-axis: Mean air temperature (degree celsius), range 17.5 to 19.0 with tick labels 17.5, 18.0, 18.5, 19.0. Y-axis: Bee richness, range 6 to 12 with tick labels 6, 8, 10, 12. The fitted curve is U-shaped, with lower values near 18.5 and higher values near 17.5 and 19.0. (f) Text: R superscript 2 equals 0.88, p equals 0.002. X-axis: Total precipitation amount (millimeter), range 330 to 690 with tick labels 330, 450, 570, 690. Y-axis: Bee richness, range 6 to 12 with tick labels 6, 8, 10, 12. The fitted curve is inverted U-shaped, with higher values near the middle of the precipitation range and lower values near 330 and 690. (g) Text: R superscript 2 equals 0.01, p equals 0.80. X-axis: Mean air temperature (degree celsius), range 17.5 to 19.0 with tick labels 17.5, 18.0, 18.5, 19.0. Y-axis: Bee abundance, range 25 to 75 with tick labels 25, 50, 75. The fitted line is nearly flat, with points spread across the y-axis range. (h) Text: R superscript 2 equals 0.007, p equals 0.82. X-axis: Total precipitation amount (millimeter), range 330 to 690 with tick labels 330, 450, 570, 690. Y-axis: Bee abundance, range 25 to 75 with tick labels 25, 50, 75. The fitted line is nearly flat, with points spread across the y-axis range. (i) Text: R superscript 2 equals 0.28, p equals 0.14. X-axis: Mean air temperature (degree celsius), range 17.5 to 19.0 with tick labels 17.5, 18.0, 18.5, 19.0. Y-axis: Hoverfly richness, range 1 to 3 with tick labels 1, 2, 3. The fitted line shows a small change across the x-axis range, with points at y values between 1 and 3. (j) Text: R superscript 2 equals 0.08, p equals 0.44. X-axis: Total precipitation amount (millimeter), range 330 to 690 with tick labels 330, 450, 570, 690. Y-axis: Hoverfly richness, range 1 to 3 with tick labels 1, 2, 3. The fitted line shows a small change across the x-axis range, with points at y values between 1 and 3. (k) Text: R superscript 2 equals 0.94, p equals 0.0002. X-axis: Mean air temperature (degree celsius), range 17.5 to 19.0 with tick labels 17.5, 18.0, 18.5, 19.0. Y-axis: Hoverfly abundance, range 80 to 260 with tick labels 80, 140, 200, 260. The fitted curve is inverted U-shaped, with higher values near the middle of the temperature range and lower values near 17.5 and 19.0. (l) Text: R superscript 2 equals 0.91, p less than 0.0001. X-axis: Total precipitation amount (millimeter), range 330 to 690 with tick labels 330, 450, 570, 690. Y-axis: Hoverfly abundance, range 80 to 260 with tick labels 80, 140, 200, 260. The fitted line increases across the precipitation range. Across the 12 plots, visitor richness and visitor abundance show curved relationships in both temperature and precipitation plots (a to d). Bee richness shows curved relationships in both temperature and precipitation plots (e and f), while bee abundance shows nearly flat fitted lines in both temperature and precipitation plots (g and h). Hoverfly richness shows small fitted-line changes in both temperature and precipitation plots (i and j), while hoverfly abundance shows a curved relationship with mean air temperature (k) and an increasing fitted line with total precipitation amount (l).
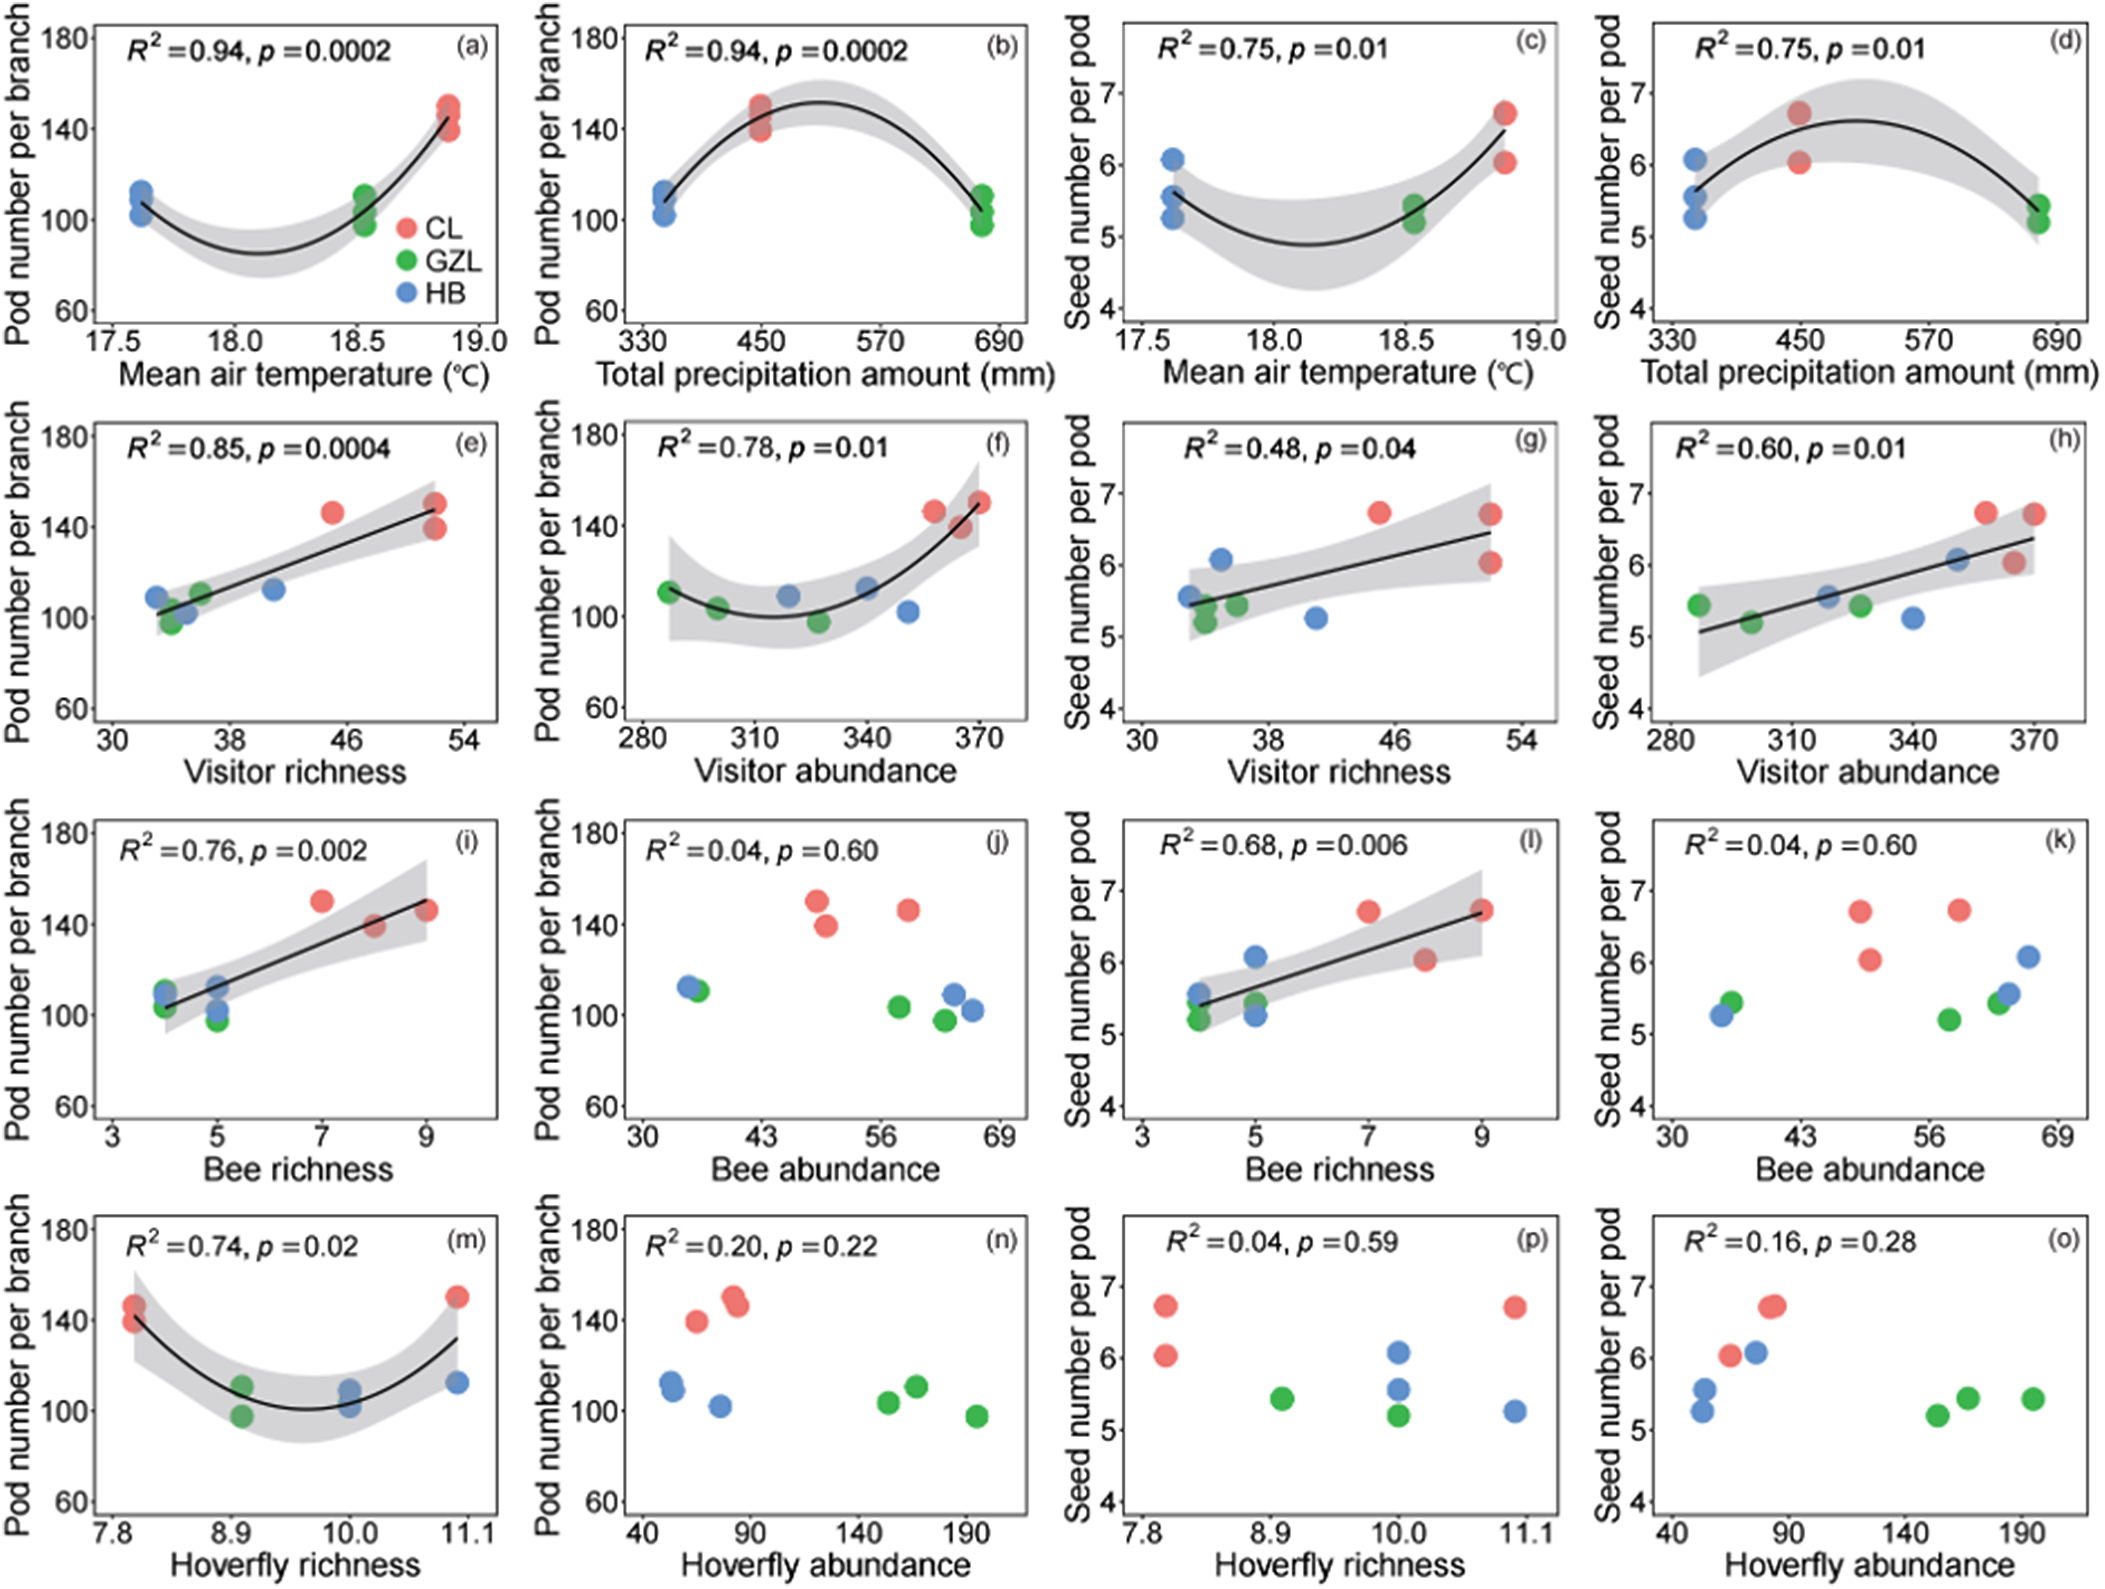
The pod number per branch and the seed number per pod were positively correlated with the mean air temperature during the growing season (fig. 4a, c). With the increase in total precipitation amount, the pod number per branch and the seed number per pod increased first and then decreased (fig. 4b, d). The number of pods per branch was positively associated with the richness of visitor and bee species (fig. 4e, i), and it firstly decreased and then increased with the increasing diversity of hoverflies (fig. 4m). The number of pods per branch initially decreased and then increased with the increasing abundance of visitors (fig. 4f), and it was not correlated with the abundance of bees and hoverflies (fig. 4j, n). The number of seeds per pod was significantly correlated with the richness of visitor and bee species, and the abundance of visitors (fig. 4g, k, h), but not with the richness of hoverflies or the abundance of bees or hoverflies (fig. 4o, l, p).
Relationships between the mean air temperature or total precipitation during the growing season of the experimental year and alfalfa seed yield (a and b: pod number per branch; c and d: seed number per pod). Relationships between the pod number per branch and the number of floral visitors (e and f: visitor richness and abundance; i and j: bee richness and abundance; m and n: hoverfly richness and abundance). Relationships between the seed number per pod and the number of floral visitors (g and h: visitor richness and abundance; k and l: bee richness and abundance; o and p: hoverfly richness and abundance). Black lines show the ordinary least squares regression fits. The grey-shaded areas represent the 95% confidence intervals. GZL, Gongzhuling; CL, Changling; HB, Harbin.

Figure 4 Long description
The image contains sixteen scatter plots comparing pod number per branch and seed number per pod with various environmental and visitor metrics. Each plot includes fitted regression lines and shaded confidence intervals. Plot (a) shows pod number per branch against mean air temperature in degrees Celsius, with R squared equals 0.94 and p equals 0.0002. Plot (b) shows pod number per branch against total precipitation in millimeters, with R squared equals 0.94 and p equals 0.0002. Plot (c) shows seed number per pod against mean air temperature in degrees Celsius, with R squared equals 0.75 and p equals 0.01. Plot (d) shows seed number per pod against total precipitation in millimeters, with R squared equals 0.75 and p equals 0.01. Plot (e) shows pod number per branch against visitor richness, with R squared equals 0.85 and p equals 0.0004. Plot (f) shows pod number per branch against visitor abundance, with R squared equals 0.76 and p equals 0.002. Plot (g) shows seed number per pod against visitor richness, with R squared equals 0.48 and p equals 0.04. Plot (h) shows seed number per pod against visitor abundance, with R squared equals 0.59 and p equals 0.01. Plot (i) shows pod number per branch against bee richness, with R squared equals 0.78 and p equals 0.002. Plot (j) shows pod number per branch against bee abundance, with R squared equals 0.04 and p equals 0.50. Plot (k) shows seed number per pod against bee richness, with R squared equals 0.68 and p equals 0.006. Plot (l) shows seed number per pod against bee abundance, with R squared equals 0.04 and p equals 0.59. Plot (m) shows pod number per branch against hoverfly richness, with R squared equals 0.74 and p equals 0.02. Plot (n) shows pod number per branch against hoverfly abundance, with R squared equals 0.22 and p equals 0.22. Plot (o) shows seed number per pod against hoverfly richness, with R squared equals 0.04 and p equals 0.59. Plot (p) shows seed number per pod against hoverfly abundance, with R squared equals 0.16 and p equals 0.28. The plots indicate varying strengths and directions of relationships, with some showing significant correlations and others not. Gongzhuling, Changling and Harbin are represented by different markers.
Relative importance of climate variables and floral visitors
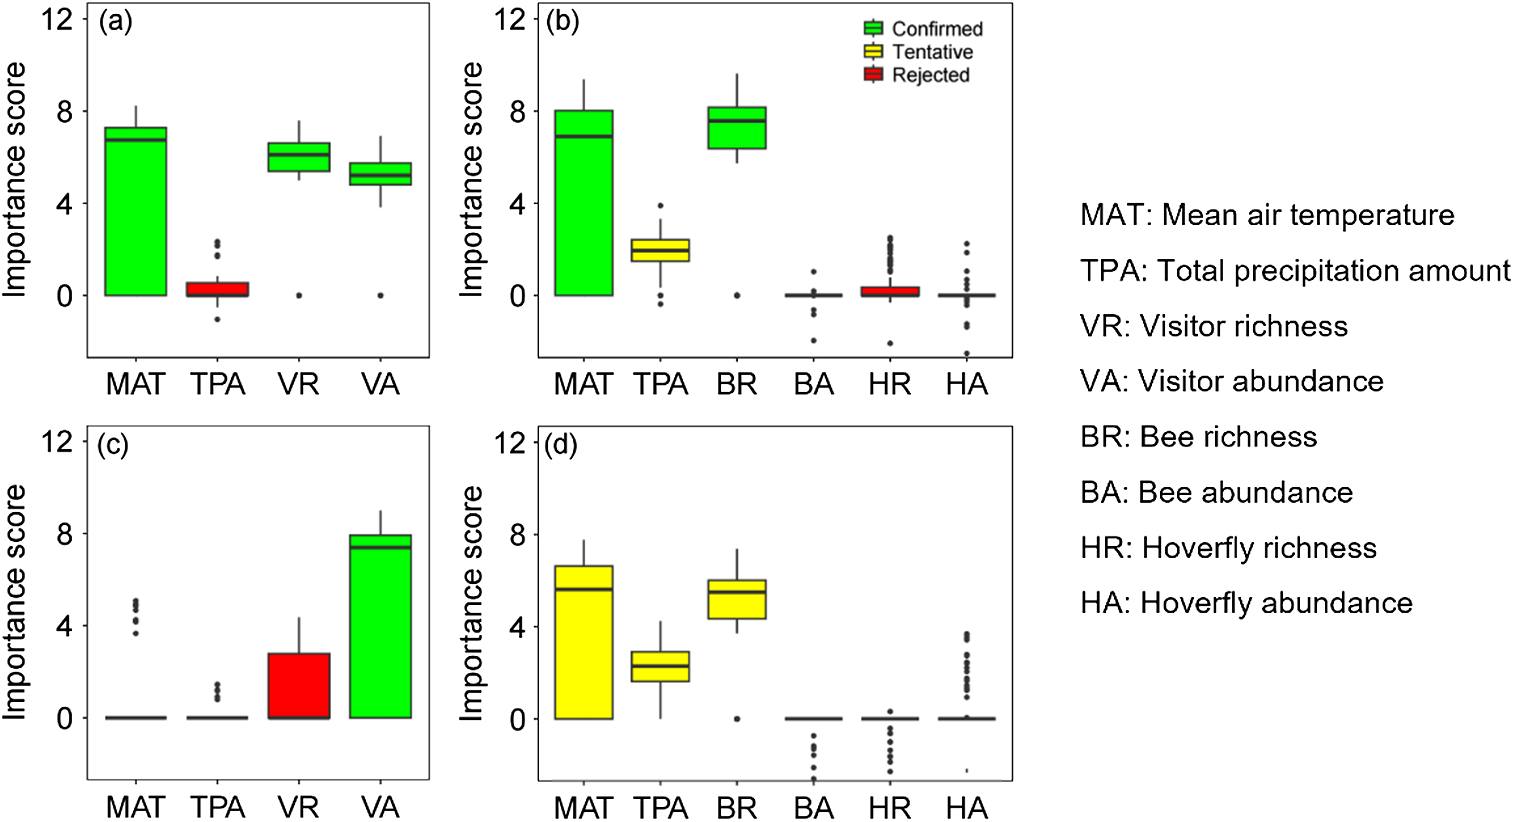
The importance score ranking shows that air temperature, visitor richness, visitor abundance, and bee richness are all quite important for the number of pods per branch of alfalfa, as they have relatively high importance scores (fig. 5a, b). For the number of seeds per pod, visitor abundance has the highest importance score and serves as the key factor affecting alfalfa seed yield (fig. 5c, d). Meanwhile, the relatively low importance score of other factors was considered to have a poor effect on the seed yield of alfalfa.
The relative importance of floral visitors and climate variables for alfalfa seed production based on Boruta analysis (a and b: pod number per branch; c and d: seed number per pod). Green boxplots correspond to factors that are marked as ‘confirmed,’ indicating that they are highly significant factors (P < 0.05). Yellow and red boxplots correspond to factors marked as ‘tentative’ and ‘rejected’ respectively, indicating that these factors are unimportant (P > 0.05).

Figure 5 Long description
The image consists of four boxplot graphs labeled (a), (b), (c) and (d). Each graph displays Boruta importance scores for various climate and floral-visitor variables. The x-axis labels are MAT (Mean air temperature), TPA (Total precipitation amount), VR (Visitor richness), VA (Visitor abundance), BR (Bee richness), BA (Bee abundance), HR (Hoverfly richness) and HA (Hoverfly abundance). The y-axis is labeled 'Importance score' with no specific units, ranging from 0 to 12. Graph (a) shows the importance scores for pod number per branch. MAT, TPA, VR and VA are marked as 'confirmed' with green boxplots, indicating high significance. Graph (b) also represents pod number per branch, with MAT, VR and VA confirmed as significant. TPA, BR, BA, HR and HA are marked as 'tentative' or 'rejected' with yellow and red boxplots, indicating lower significance. Graph (c) shows seed number per pod, with VA confirmed as significant. MAT, TPA and VR are marked as 'rejected'. Graph (d) also represents seed number per pod, with VA confirmed as significant. MAT, TPA, BR, BA, HR and HA are marked as 'tentative'. Overall, VA has the highest importance score across all graphs, indicating it is the key factor affecting alfalfa seed yield. MAT and VR are significant for pod number per branch, while other factors show lower importance.
Discussion
Variation in the pollinator community and their consequences for plant production and crop yield are extensively focused (Gibbs et al., Reference Gibbs, Elle, Bobiwash, Haapalainen and Isaacs2016; Park et al., Reference Park, Raguso, Losey and Danforth2016; Laina et al., Reference Laina, Gfrerer, Scheurecker, Fuchs, Schleifer, Zittra, Wagner, Gibernau, Comes, Hörger and Dötterl2022). In our study, using the alfalfa plantation system model, we found differences in the community composition, diversity, and abundance of alfalfa pollinators across the three experimental sites with different landscape types, which are mainly driven by landscape types along with climatic variables. Changed pollinator diversity, combined with climatic factors in turn affected alfalfa seed yield. Our study provided new experimental evidence that the effects of pollinators on alfalfa reproduction are more complex than previously thought.
As expected, we found significant differences in the community composition, richness, and abundance of visitors to alfalfa across three experimental sites. The CL site, situated in a semi-natural grassland in this study, supported greater richness and abundance of pollinators than the two other sites, which is consistent with most previous studies (Gaspar et al., Reference Gaspar, Loureiro, Castro, Siopa, Castro, Casais and Castro2022; Maurer et al., Reference Maurer, Sutter, Martínez‐Núñez, Pellissier and Albrecht2022). Semi-natural landscapes consistently maintain higher richness and abundance of pollinators than farmland landscapes (Ganuza et al., Reference Ganuza, Redlich, Rojas-Botero, Tobisch, Zhang, Benjamin, Englmeier, Ewald, Fricke, Haensel and Kollmann2025), because semi-natural grasslands are often accompanied by more flowering forb plants, such as Kalimeris integrifolia, Potentilla flagellaris, and these flowering plants could provide sufficient food resources for pollinators (Khalil et al., Reference Khalil, Sykes and Russo2023). Meanwhile, abundant plant species richness and heterogeneous structure of grass-forb community could also increase habitat complexity, subsequently offering more nesting options for pollinators and helping minimise predation risk by providing refuges (Gaspar et al., Reference Gaspar, Loureiro, Castro, Siopa, Castro, Casais and Castro2022). Compared to semi-natural grasslands, lower pollinator richness and abundance in the HB site with a farmland landscape were found. As the farmland habitats were cultivated by non-flowering crops, such as Zea mays and Oryza sativa, resulting in habitat simplification that provided fewer food resources and habitat for pollinators (Udy et al., Reference Udy, Reininghaus, Scherber and Tscharntke2020). Meanwhile, the use of chemical pesticides could also reduce pollinator richness and abundance by directly causing acute or chronic toxicity (Goulson et al., Reference Goulson, Nicholls, Botías and Rotheray2015). With the rapid spread of urbanisation, pollinator diversity has been increasingly threatened (Liang et al., Reference Liang, He, Theodorou and Yang2023). In our study, the results found the lowest pollinator richness and abundance at the GZL site of the urbanised landscape, compared with the CL and HB sites. Although diverse ornamental flowering plants are often used in the urban landscape, habitat simplification, extensive buildings, and impervious surfaces severely limit opportunities for pollinators to find nests and food resources (Baldock et al., Reference Baldock, Goddard, Hicks, Kunin, Mitschunas, Osgathorpe, Potts, Robertson, Scott, Stone and Vaughan2015; Bennett and Lovell, Reference Bennett and Lovell2019; Fijen et al., Reference Fijen, Read, Walker, Gee, Nelson and Howlett2022). Thus, it is suggested that semi-natural grassland ecosystems are more beneficial to the conservation of wild pollinators.
Generally, climatic variables (i.e. air temperature and precipitation patterns) are important abiotic factors in influencing pollinator diversity through direct and indirect effects (Fourcade et al., Reference Fourcade, Åström and Öckinger2019). In this study, the higher mean air temperature recorded at the CL site corresponded to increased pollinator richness and abundance, which is consistent with the observations from the European Alps (Corcos et al., Reference Corcos, Cerretti, Mei, Taglianti, Paniccia, Santoiemma, De Biase and Marini2018). The positive effects of air temperature on pollinators may be driven by its dual role: direct enhancement of the development duration, reproductive capabilities, and survival rates of pollinators (Chick et al., Reference Chick, Strickler, Perez, Martin and Diamond2019), and indirect modulation of floral availability for pollinators (Lessard et al., Reference Lessard, Sackett, Reynolds, Fowler and Sanders2011). Besides air temperature, precipitation also plays a central role in influencing pollinator richness and abundance (Zhu et al., Reference Zhu, Wang, Wang, Fang, Sun and Ren2014; Fourcade et al., Reference Fourcade, Åström and Öckinger2019). Our results found that higher precipitation amount was closely related to lower floral visitor richness and abundance. The negative relationships were likely attributed to multiple pathways: an unfavorable habitat with excessive humidity, direct damage to the wings, and the dilution of pollen and nectar nutrients (Frampton et al., Reference Frampton, Van Den Brink and Gould2000; Lawson and Rands, Reference Lawson and Rands2019; Frigero et al., Reference Frigero, Boaro, Galetto, Tunes and Guimarães2025).
A growing number of studies have confirmed that variations in the richness and abundance of pollinators significantly affect seed production in flowering plants (Woodcock et al., Reference Woodcock, Garratt, Powney, Shaw, Osborne, Soroka, Lindström, Stanley, Ouvrard, Edwards and Jauker2019; Robinson et al., Reference Robinson, Cartar, Pernal, Waytes and Hoover2023). In this study, alfalfa seed yield exhibited distinct variations across the three experimental sites, with higher yields at the CL site, and lower yields at the GZL site. The alfalfa yield pattern was likely attributed to changes in the richness and abundance of floral visitors. Our results found that the species richness and abundance of total visitors and bees were significantly higher at the CL site, and diverse visitor species played an important role in the higher alfalfa seed production. Firstly, diverse pollinator species may enhance pollination efficiency through complementary or synergistic effects (Garibaldi et al., Reference Garibaldi, Carvalheiro, Vaissière, Gemmill-Herren, Hipólito, Freitas, Ngo, Azzu, Saez, Astroem, An, Blochtein, Buchori, Chamorro García, Oliveira da Silva, Devkota, de Fátima Ribeiro, Freitas, Gaglianone, Goss, Irshad, Kasina, Pacheco Filho, Piedade Kiill, Kwapong, Nates Parra, Pires, Pires, Rawal, Rizali, Saraiva, Veldtman, Viana, Witter and Zhang2016). Particularly, among these floral visitors, bees are recognised as efficient pollinators and play a vital role in increasing seed yield for most plant species (Garibaldi et al., Reference Garibaldi, Steffan-Dewenter, Winfree, Aizen, Bommarco, Cunningham, Kremen, Carvalheiro, Harder, Afik, Bartomeus, Benjamin, Boreux, Cariveau, Chacoff, Dudenhoeffer, Freitas, Ghazoul, Greenleaf, Hipolito, Holzschuh, Howlett, Isaacs, Javorek, Kennedy, Krewenka, Krishnan, Mandelik, Mayfield, Motzke, Munyuli, Nault, Otieno, Petersen, Pisanty, Potts, Rader, Ricketts, Rundlof, Seymour, Schueepp, Szentgyoergyi, Taki, Tscharntke, Vergara, Viana, Wanger, Westphal, Williams and Klein2013; Zhang et al., Reference Zhang, Gao, Kim, Yu, Jiang, Wang, Zhang, Diao, Wu, Chen, Min, Chen, Sun, Wei and Yan2022). Higher bee richness, mainly leaf-cutting bees in the CL site enhanced the seed yield of alfalfa. In fact, leaf-cutting bees are commonly used to improve alfalfa seed yield in agricultural systems (Pitts-Singer, Reference Pitts-Singer2013; Haedo et al., Reference Haedo, Martínez, Graffigna, Marrero and Torretta2022). In addition to richness, visitor abundance is also a critical factor affecting seed yield of crops (Eeraerts, Reference Eeraerts2022; Gaspar et al., Reference Gaspar, Loureiro, Castro, Siopa, Castro, Casais and Castro2022; Bao et al., Reference Bao, Zhu, Wester, Wang, Li, Ren, Yan and Wan2025), and these studies have shown that high pollinator abundance could increase the probability of pollen transfer by enhancing floral visit frequency, and consequently for plant reproductive success (Woodcock et al., Reference Woodcock, Garratt, Powney, Shaw, Osborne, Soroka, Lindström, Stanley, Ouvrard, Edwards and Jauker2019). In this study, more abundant visitors resulted in the higher seed yield of alfalfa in the CL site, while the lower seed yields in the other two sites were linked to lower abundance of visitors and bees. Although hoverflies were relatively abundant at GZL and HB sites, they did not contribute to higher alfalfa seed yields. This contradicts the findings of other studies where hoverflies promoted seed yield of strawberries and caraway (Toivonen et al., Reference Toivonen, Karimaa, Herzon and Kuussaari2022; Van Oystaeyen et al., Reference Van Oystaeyen, Tuyttens, Boonen, De Smedt, Bellinkx, Wäckers and Pekas2022), which may be likely due to the mismatch between the specific tripping mechanism of alfalfa and the visiting behaviour of hoverflies. Therefore, it is implied that hoverflies may be less effective as pollinators of alfalfa.
While pollinators exert significant impacts on plant reproduction, climatic variables also serve as key drivers regulating crop yield (Alsajri et al., Reference Alsajri, Wijewardana, Irby, Bellaloui, Krutz, Golden, Gao and Reddy2020). In this study, higher air temperatures were observed to positively affect alfalfa seed yield, consistent with conclusions from previous research that air temperature promotes plant seed production (Bogdziewicz et al., Reference Bogdziewicz, Szymkowiak, Fernández-Martínez, Peñuelas and Espelta2019). Increase in air temperature could directly accelerate pollen germination and enhance reproductive efficiency, and indirectly regulate pollinators, thereby influencing the seed yield of crops (Pahadi et al., Reference Pahadi, Chen, Annis, Calderwood, Drummond, Wason and Zhang2025; Zanini et al., Reference Zanini, Dainese, Obwegs, Guariento, Kopf, Anderle, Leitinger and Tappeiner2026). In contrast, precipitation in this study showed a negative correlation with alfalfa seed yield. This stands in contrast to the findings that higher rainfall amounts increased plant yield (Hu et al., Reference Hu, Soolanayakanahally, Guy, Lu, Silim, Cober and Morrison2025). This phenomenon is likely linked to the ecological adaptability of alfalfa in arid and semi-arid regions (Tlahig et al., Reference Tlahig, Mohamed, Triki, Yahia, Yehmed, Yahia, Guasmi and Loumerem2025). Excessive rainfall amounts can induce yield loss through restricted root development, and poor uptake of water and nutrients (Parent et al., Reference Parent, Capelli, Berger, Crèvecoeur and Dat2008; Li et al., Reference Li, Guan, Schnitkey, DeLucia and Peng2019), and by decreasing both the frequency of flower visitations and the abundance of pollinators (Lawson and Rands, Reference Lawson and Rands2019). Notably, the effects of climatic variables and pollinators on crop seed yield are often non-independent, they may typically exhibit additive or combined effects (Olsen et al., Reference Olsen, Evju, Åström, Løkken, Dahle, Andresen and Eide2022; Zanini et al., Reference Zanini, Dainese, Obwegs, Guariento, Kopf, Anderle, Leitinger and Tappeiner2026). Our results revealed the combined effects of climate and pollinators on alfalfa seed yield, where diverse pollinator richness/abundance jointly with high air temperatures significantly increased alfalfa seed production. Although the findings are not tested by a controlled experiment, these results confirmed that both pollinators and climate variables are important factors in influencing alfalfa yield.
Conclusions
Numerous studies have established the critical role of pollinators in alfalfa seed production (Cecen et al., Reference Cecen, Gurel and Karaca2008; Pitts-Singer and James, Reference Pitts-Singer and James2008), but there is a notable scarcity of research examining the integration of landscape, climate, and pollinators. This study clarifies the relationships among climate, floral visitors, and alfalfa seed yield across different landscape types, revealing that visitor variations are driven by climatic variables, and that changed visitors, in conjunction with climate, influence alfalfa seed yield. These results enrich the understanding of climate-mediated pollinator dynamics and their combined effects on crop yield. It suggests that protecting wild pollinators is crucial for enhancing alfalfa seed yield, especially under different landscape types and climatic changes.
Supplementary material
The supplementary material for this article can be found at https://doi.org/10.1017/S0007485326100820.
Acknowledgements
This work was supported by the State Key Laboratory of Resource Insects (SKLRI-ORP202412), the National Natural Science Foundation of China (32371775), Science and Technology Development Program of Jilin Province (20250102250JC), and the Program of Introducing Talents of Discipline to Universities (B16011).
Author contributions
Sachurula Bao: Investigation, data curation, formal analysis, writing – original draft, writing – review and editing. Xuerong Lei: Investigation. Chao Gao: Investigation. Duofeng Pan: Data curation. Yanchun Zhou: Data curation. Zhijian Li: Data curation. Qinfeng Guo: Writing – review and editing. Chuan Ma: Conceptualization. Bingzhong Ren: Conceptualization. Hui Zhu: Conceptualization, formal analysis, funding acquisition, writing – original draft, writing – review and editing.
Financial support
We thank Xiaona Lan, Chenxin Wang, Yan Sun, Liqi Zhou, and Xinyu Bai for their assistance with work in the field.
Competing interests
The authors declare no conflict of interest.