The seminal studies by Moses Abramovitz and Robert Solow found that, in comparison with the nineteenth century, a large gap had opened up in the first half of the twentieth century between the growth of real output and a weighted average of inputs conventionally measured.1
Abramovitz, “Resource and Output Trends”; and Solow, “Technical Change.”
This gap, termed the “residual,” was subsequently interpreted by Abramovitz as reflecting a shift to a knowledge-based type of economic development, which, from the vantage point of mid-century, was expected to persist.
2 The residual, or total factor productivity growth, is traditionally calculated as the difference between the growth rate of real GDP (or a portion thereof) and a weighted average of labor and capital inputs, the weights corresponding to shares of these factors in national income
where a, y, k, and n represent continuously compounded annual growth rates of TFP, value added, capital services, and hours, respectively, and β is capital's share in national income.
A rearrangement yields the very useful labor productivity version: growth in output per hour is the sum of TFP growth and capital's share times the rate of capital deepening
It is common to augment the hours series to take account of improvements in worker quality; absent that adjustment the effect of rising human capital per person will also show up in the residual.
Equation 1.3, another rearrangement, shows that while growth of the residual positively affects growth rates of both labor and capital productivity, it is in turn, arithmetically, a weighted average of the two.
By and large it did so for another quarter century. The years 1948–1973 stand out as the golden age of labor productivity growth and living standard improvement in the United States—the result of a combination of respectable total factor productivity (TFP) growth and robust rates of capital deepening. But the more-than-two-decade period of slow productivity growth generally dated from 1973 forced a reassessment of the view that this was a permanent change. The end-of-century uptick, in turn, has focused attention on what caused the growth of the residual to accelerate and how much of it could be laid at the feet of information technology (IT).
With the exception of work by Abramovitz and Paul David, Paul David and Gavin Wright, and Robert Gordon, most recent research on productivity embraces a historical perspective that reaches back no further than 1948, when the standard series maintained by the Bureau of Labor Statistics begin.3
Abramovitz and David, “American Macroeconomic Growth (1999)” and “American Macroeconomic Growth (2000)”; David and Wright, “General Purpose Technologies”; and Gordon, “U.S. Economic Growth” and “Interpreting the ‘One Big Wave’.”
This article focuses on total factor productivity growth during the interwar period, and more particularly, on differences in the magnitude and sources of growth in the Great Depression years (1929–1941) as compared with the 1920s (1919–1929).
4 Some scholars refer to the years 1929–1933 as the depression (Friedman and Schwartz called it the Great Contraction). As a terminological matter, I treat the depression as having extended over the 12 years 1929–1941; during these years output was persistently depressed below its potential.
It seeks as well to situate these periods appropriately within a revised narrative of twentieth-century U.S. growth. John Kendrick's productivity estimates, which form the starting point for all modern work on the pre-1948 period, have been available for over four decades.
5 Kendrick, Productivity Trends.
But his choice of 1937 as a benchmark, as opposed to 1941, has prevented until recently a full appreciation of the extent to which TFP, and with it, potential output, grew during the depression.
6 On the reasons for preferring 1941 to 1937, see Field, “Most Technologically Progressive Decade,” pp. 1402–04. Cole and Ohanian, “Great Depression,” examined Kendrick's data over the interval 1929–1939, noting the sharp decline through 1933 and rapid recovery thereafter, and observing that TFP growth overall over the decade they examined was “about normal.” But 1939, with its 17.2 percent unemployment, is even less desirable than 1937 as a benchmark in a period characterized by strongly procyclical productivity movements (see footnote 15).
The productivity achievements of the interwar period are best viewed when placed in the context of advance across the entire recently completed century. Table 1 provides a statistical summary of rates of increase of total factor, labor, and capital productivity between 1901 and 2000. The most striking feature of this table is that the fastest rates of peacetime peak-to-peak total factor productivity growth in the private nonfarm economy (PNE) occurred during the depression years. More generally, the highest twentieth-century rates of growth of the residual occurred during the interwar years, and there has been, on balance, a downward trend in the second half of the century.7
For further exploration of the implications of this trend, and particularly its association with an increasing equipment share in investment, see Field, “Equipment Hypothesis.”
Although it is true that TFP growth between 1989 and 2000 was more than twice as fast as during the anemic years 1973–1989, it was less than a third the rate registered during the depression years.
Because of the influence of cyclical factors on productivity levels, it is customary in historical research to restrict calculations of productivity growth rates to peak-to-peak comparisons. For the most recent episode, this requires measurement from 1989 to 2000. Many students of the productivity revival prefer nevertheless to measure from 1995. Although 1995 is not a business cycle peak, the acceleration in output growth after 1995 makes the revival look more impressive. Whether it is desirable or appropriate to choose one's start date with the objective of showing IT in its best light is of course an open question. Nevertheless, in deference to current practice, I have also calculated growth rates using 1995 as a breakpoint. These show that although TFP growth between 1995 and 2000 (1.14 percent per year) was triple what it had been between 1973 and 1995 (0.38 percent per year), it was still less than half what it was between 1929 and 1941.8
For more detailed analysis of the end of century boom, see Field, “Technical Change.”
A number of authors, including Abramovitz and David and Gordon, have noted that the fastest rate of growth of TFP in the century took place during its second quarter.9
Abramovitz and David, “American Macroeconomic Growth (1999)”; and Gordon, “U.S. Economic Growth” and “Interpreting the ‘One Big Wave’.”
But the productivity levels of 1948, the basis of our military and economic dominance in the postwar period, have traditionally been credited in large part to innovation and experience gained during the immediately preceding war. The argument of this article, in contrast, is that almost all of the foundations for postwar prosperity were already in place by 1941.
10 The productivity experience of the U.S. economy during the war is explored more fully in Field, “Impact.”
The extent of the growth of potential output during the depression years can be appreciated in observing that labor and capital inputs conventionally measured were basically unchanged in 1941, compared with what they had been in 1929.11
Man hours declined slightly while quality adjusted labor input barely rose at 0.12 percent annually; capital input declined at –0.13 percent annually (see Kendrick, Productivity Trends).
Real output, however, was 32.3 percent higher, having increased at a compound annual average rate of 2.33 percent annually over the 12-year period.
Virtually all of the growth in output and in output per hour between 1929 and 1941 was therefore due to total factor productivity growth. Even though the depression experienced a collapse in private capital formation, labor productivity rose faster over this 12-year period (2.35 percent annually) than it had in the 1920s (2.27 percent annually), and much faster than it did over the years 1941 to 1948 (1.71 percent).12
Kendrick, Productivity Trends, table A-23; also see Table 1.
What were the sources of this extraordinary achievement? How did it compare with what had been accomplished in the 1920s?
SELECTIVE RETENTION AND OTHER FACTORS INFLUENCING LABOR QUALITY
A number of economists and economic historians have remarked on the high rate of labor productivity and real wage growth during the depression years, and asked how it was that high unemployment coincided with stable or increasing real wages.13
See, for example, Margo, “Employment,” p. 43.
A common explanation for why wages increased as employment fell has been selective retention. As demand declined, it is argued, firms laid off their less skilled workers, and within occupational categories, they laid off their poorer performers, a selectivity that improvements in personnel and human resource management practices made it easier for employers to practice. Thus the high and rising wages that appear to have accompanied the downturn, it is argued, are largely a compositional effect.
14 Margo, “Microeconomics,” p. 341. But note the very sharp increase in man hours per unit of output for the automobile industry reported for 1930, 1931, and 1932 in Weintraub (“Some Measures,” p. 161), and the drop in output per hour between 1929 and 1933 evident in Kendrick. These data raise some questions about the relative empirical importance of selective retention, even during the downturn.
The type of effect Robert Margo describes, however, is a cyclical phenomenon, and should not be relevant peak to peak. As one comes out of a downturn, these effects would simply be unwound as labor markets tightened and the more marginal members of the labor force were rehired. In fairness to the selective retention hypothesis, 1941 still had 9.9 percent unemployment, compared with 1929 (3.2 percent). 1941 is far better than 1937 or 1940 in this regard, but not ideal. For the purposes of my argument it would have been helpful had the Japanese delayed by eight to 12 months their attack on Pearl Harbor, so that the U.S. economy could have returned to full employment, as it was in the process of rapidly doing, prior to full-scale war mobilization.
Nevertheless, there is enough evidence to suggest that whatever role selective retention may have played in measured productivity growth between 1929 and 1941, it was likely small in comparison with the influence of other factors. If one regresses the change in PNE TFP on the change in the unemployment rate for the 1929–1941 period, one confirms an impression that productivity was strongly procyclical during the depression years. When the unemployment rate rose, the level of TFP dropped, and when the unemployment rate declined, TFP rose, with these cyclical effects superimposed upon a strong trend growth rate.15
The regression yields these results:
R2 = 0.647; t-statistics are in parentheses; data are for 1929–1941; N = 12.
This regression is the basis for a cyclically adjusted estimate of TFP growth between 1929 and 1941 of 2.78 percent per year, about half a percentage point higher than the numbers in Table 1 suggest. The adjustment is made by using the regression to predict a 1941 TFP level assuming unemployment had been at the 1948 rate of 3.8 percent. Growth is then calculated relative to the actual 1929 level. For full discussion, see Field, “Impact.”
More specifically, TFP growth accelerated as the unemployment rate fell after 1938. It did not decelerate as would have been the case if selective retention were the main force affecting productivity levels.
16 Because of the absence of capital deepening, statements true for TFP are generally true as well for trends in output per hour. As the unemployment rate dropped from 19.1 percent in 1938 to 14.6 percent in 1940, the increment to output per hour was lower (4.18 percent) than that obtained (6.59 percent) in moving from 14.6 percent unemployment in 1940 to 9.9 percent in 1941. (Kendrick, Productivity Trends, table A-XXIII.
A second factor that could have influenced labor productivity growth over the depression years, not subject to this same critique, is secular improvement in the educational qualifications of the labor force. Claudia Goldin has called attention to the very rapid rise in high school graduation rates during the 1930s to levels not exceeded until the 1960s.17
Goldin, “America's Graduation from High School,” p. 359.
As is suggested by the data on R&D employment (presented later), demand for scientific and technical personnel was very strong during the depression, consistent with the evidence Margo has collected that managerial, scientific, and professional status or higher years of schooling provided substantial protection against unemployment during these years. The opportunity cost of high school attendance was also much lower during the 1930s, because the likelihood of unemployment as a young worker without a high school degree was considerably higher than it had been in the previous decade. By the end of the 1930s, the United States was also benefiting from the influx of highly educated Europeans fleeing Hitler.
One way to estimate how much of the growth in output per hour might have been due to labor quality improvement between 1929 and 1941 is to look at the difference in that calculation when one substitutes in the denominator an index of “adjusted” labor hours (column 3 as compared with column 2 of Table 1). This index is constructed weighting different occupational or industry categories by their respective wage rates. Kendrick's data show that although “raw” hours declined slightly between 1929 and 1941, augmented hours rose slightly, at about 0.12 percent per year. As a consequence, output per hour growth is about 6 percent lower over this period using adjusted as opposed to unadjusted hours (see Table 1, columns 2 and 3).
It may be that Kendrick's adjustments are insufficient, but this calculation confirms my sense that the effect of labor quality improvement on growth in output per hour or TFP growth over the entire period 1929–1941 was dwarfed by other factors.18
Denison's education quality index for civilian employment shows a 4.8 percent increase for males and a 4.5 percent improvement for females between 1929 and 1941 (Denison, “Accounting for United States Economic Growth,” table I-18, p. 252). This again shows positive but modest improvement in labor force quality over these years.
Writing in 1993 Margo accepted the conventional wisdom that technical change during the depression was “concentrated in a few industries and modest overall.”
19 Margo, “Employment,” p. 49.
The extent to which growth in output per hour and, perforce, wages, is attributable to very rapid growth in TFP has not been fully appreciated, even by those labor economists aware of the trends in hourly wages and labor productivity.
THE RISE IN OUTPUT PER HOUR: CAUSES AND CONSEQUENCES
Physical capital deepening, at least in the private sector, was not among the forces influencing growth in output per hour. Labor input was about the same and the net stocks of both equipment and structures were lower in 1941 than they had been in 1929, yet output and output per hour were each more than 30 percent higher.20
The BEA's index of the net stock of private nonresidential fixed assets stood at 19.29 in 1941 as compared with 19.63 in 1929. See below for discussion of the role of public infrastructure.
If neither labor quality improvement nor capital deepening can account for the growth in output per hour, the explanation, within the context of the growth accounting tradition, must be an increase in total factor productivity.
Simon Kuznets was probably the first fully to appreciate the magnitude of the expansion in capacity that had taken place during the depression. As part of the war planning process, he was tasked with estimating the potential output of the U.S. economy in order to allow the setting of war production goals consistent with planned force levels and civilian consumption. His estimates turned out to be considerably higher than most had expected, leading the military to multiply their production targets and forcing Kuznets and others to fight a rear guard action to bring them down to realistic levels.21
The outward shift of the production possibility frontier during the depression years was the principal reason potential output in 1942 was so much higher than had been anticipated.
When the argument was first made that the depression years had experienced the highest TFP growth of the century, many asked whether this claim included consideration of the “New Economy” boom of the 1990s. It does. The upwardly spiraling equity valuations of the 1990s were propelled by human fallibility and one of the most formidable marketing machines ever assembled. With assists from research departments of brokerage firms, IT companies celebrating their own prospects, independent public relations firms, radio, television, and print media and, at times, government officials and academic economists, warm air fanned speculative fires fueled by dreams of Dow 36,000. For better or for worse, the drum beat lead to a reorganization of the Federal government's statistical apparatus in an effort to make it more sensitive to the possible contributions of the IT revolution to growth.
But the reality is that during the last decade of the twentieth century, revolutionary technological or organizational change—the sort that shows up in TFP growth—was concentrated within distribution, securities trading, and a narrow range of industries within a shrinking manufacturing sector. TFP advance within industry was largely localized within the old SIC 35 and 36, sectors that included the production of semiconductors, computers, networking, and telecommunications equipment.22
The Standard Industrial Classification (SIC) codes are being replaced in post 1997 reporting with North American Industrial Classification System (NAICS) codes, but I retain the older vocabulary in this article.
This technical advance, although undeniably dramatic in many ways, was more localized and smaller in its aggregate impact than what took place during the 1930s.
The 1930s, in contrast, were characterized by advances across a broader frontier of the economy, including manufacturing, which was then more than twice as large as a fraction of national income; transportation, communication and public utilities; and to a somewhat lesser degree, wholesale and retail distribution. Examining productivity growth in the United States over the entire twentieth century places recent progress and interwar performance within a more encompassing historical narrative.
MANUFACTURING'S CONTRIBUTIONS TO TFP GROWTH
To explore the changing sectoral contributions to aggregate PNE TFP advance, we need first to consider how the structure of the economy has evolved.23
For the postwar period calculations are of sectoral or industrial value added as a share of GDP. Data can be found at http://www.bea.doc.gov/bea/pn/GDPbyInd_VA_SIC.xls. For 1929 to 1948, the calculations are of sectoral or industrial national income as a share of national income. Data are from U.S. Bureau of the Census, Historical Statistics, Series F-226–237.
An examination of the industrial or sectoral distribution of value added shows that the shares of all commodity or goods-producing sectors of the economy, with the exception of construction, fell dramatically in the postwar period. Between 1948 and 2000, agriculture dropped from almost 9 percent of GDP to under 1.5 percent, mining from 3.5 to 1.4 percent, and manufacturing from 27.8 percent to 15.5 percent. The share of manufacturing in value added in the United States today is approximately what it was in 1850. Most of the drop in manufacturing's share occurred after 1973.
Within manufacturing, declining shares were evident at the two-digit level pretty much across the board, and are especially notable in primary metals, textiles, apparel, and leather goods. At the two-digit level the only sectors to buck the trend were instruments and related products, electric and electronic equipment, chemicals and allied products, and rubber and miscellaneous plastic. All four had higher shares than in 1948, although all but the first have been declining in share since 1973. Three other sectors: nonelectrical machinery, motor vehicles and equipment, and other transport equipment, increased in share between 1948 and 1973, but then declined rapidly, so that their 2000 shares were significantly below those in 1948.
If one looks back at prewar numbers, it is clear that in 1941 manufacturing's share of national income—almost 32 percent—was close to its all time peak (it would rise further, but only temporarily, during the war). Yet a great deal of economic analysis continues to be written based on the history of manufacturing alone. Partly this is because we have more detailed data for this sector and because, as Zvi Griliches argued, productivity advance may be easier to measure in the goods producing sectors.24
But we should be careful about searching for our keys under the lamppost simply because the light there is better. Even in the depression years, when manufacturing's share of national income was close to its peak, almost as much TFP growth originated in transportation, public utilities, and distribution as in manufacturing.
The 1920s were a different story. More than four-fifths of TFP growth was contributed by manufacturing alone. In contrast, between 1948 and 1973, only 27 percent of TFP growth in the private nonfarm economy can be attributed to the sector.25
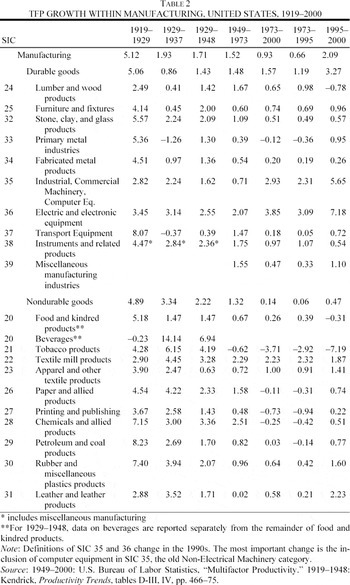
Table 2 allows a disaggregated examination of TFP growth within manufacturing in different periods. It shows that whereas TFP growth rates were roughly comparable in durables and nondurables between 1949 and 1973 (1.48 vs. 1.32 percent continuously compounded), TFP advance virtually disappeared in nondurables between 1973 and 1995, aside from textiles. There is a modest acceleration between 1995 and 2000 led by advance in leather goods and apparel, but these sectors were trivially small by the end of the century. The record in durables over the last quarter of the century is scarcely better, with the notable exceptions of SIC 35 and 36, where we see accelerating growth and the impact of revolutionary change in the IT producing industries.
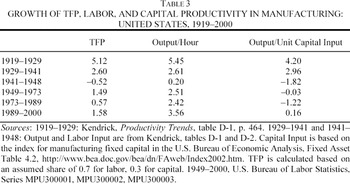
This record can be compared with the manufacturing sector's performance during the 1930s. The BLS data at the two-digit level for manufacturing extend back only to 1948, but Kendrick provides estimates at the two-digit level for his benchmark years 1929, 1937, and 1948. In the absence of annual data we cannot calculate TFP growth at the two-digit level for 1929–1941 directly, but we can look at growth from 1929–1937 or 1929–1948. If we compare the 1929–1948 numbers with the 1973–2000 data, they show first of all a much higher advance of TFP across the board in nondurables for the earlier period: 2.22 percent per year vs. a very low 0.14 percent per year for 1973–2000. In durables, the 1973–2000 period registers a slight advantage: 1.57 vs. 1.43 percent, but this is entirely accounted for by SIC 35 and 36. Aside from these two sectors and apparel (SIC 23), TFP advance in every single two-digit industry was higher over the years 1929–1948 than it was between 1973 and 2000, and often by a substantial amount. (The average rate of advance within manufacturing between 1929 and 1941 was even higher because, as Table 3 shows, TFP growth in manufacturing was negative between 1941 and 1948.) Comparing 1929–1948 with 1949–1973, we find that the advantage again goes to the earlier period for every two digit industry except lumber (SIC 24), transport equipment (SIC 37) and, again, apparel (SIC 23).
Table 2 shows that overall manufacturing TFP growth grew faster between 1929 and 1937 than it did between 1929 and 1948, due to a slower growth rate within nondurables after 1937. (Some of the slowness in durables between 1929 and 1937 is probably attributable to the poor showing in primary metals and transport equipment, which may be reflective of labor unrest during the latter year).
Kendrick's data do not allow calculation of TFP growth rates within manufacturing for the 1929–1941 and 1941–1948 subperiods, but I have done so for the sector as a whole using his estimates for output and labor input combined with capital input data from the U.S. Bureau of Economic Analysis (BEA) Fixed Asset Table 4.2.26
The use of a net rather than gross capital stock measure as proxy for capital service flow is consistent with Kendrick's practice (for arguments as to why this is appropriate, and preferable to using a gross measure, see Kendrick, Productivity Trends, pp. 34–36). Although adjustments for capacity utilization are not explicitly made, measuring from peak to peak largely controls for the variations in capacity utilization that occur over the business cycle.
This calculation shows TFP growth within manufacturing over the 1929–1941 period at the rate of 2.60 percent per year. This is higher than in any subsequent period of the twentieth century. It does, however, represent a halving of the 5.12 percent rate registered over the 1919–1929 period. This calculation also suggests, consistent with arguments advanced in two of my other articles, a negative rate of TFP advance in manufacturing over the 1941–1948 period.
27 Field, “Most Technologically Progressive Decade” and “Impact.”
What this implies then, going back to
Table 2, is, on average, a pattern of sharp advance in TFP within the sector between 1937 and 1941, followed by retrogression to 1948.
Although it is difficult to make precise inferences about the loci of rapid advance between 1929 and 1941, the data through 1937 suggest that progress was particularly pronounced in beverages, tobacco, textiles, paper, rubber, leather, electric machinery, chemicals, instruments, and petroleum and coal products.28
Kendrick, Productivity Trends, table D-IV, pp. 468–75.
Chemicals was the only sector to attain TFP growth of 3 percent or more in both 1929–1937 and 1937–1948, although tobacco, textiles, and electric machinery came close. Textile mill products also turns in a surprisingly strong performance both pre- and postwar.
29 Only SIC 35 and 36 turned in stronger performances over eight decades, and textiles is the only two digit industry to register higher TFP growth in the 1929–48 period as compared with 1919–1929. And it did so while ranking towards the bottom of industries in terms of the educational attainments of its workers (Goldin and Katz, 1998, p. 709). The main source of productivity advance in textiles into the 1930s appears to have involved changes in plant layout, with the shift to linear arrangements of machines, and improved speed of material work flow (see Weintraub, 1939). Gavin Wright has suggested a role for New Deal minimum wage mandates in encouraging this (personal communication). Other industries, however, had already benefited in the 1920s from such reorganization (see David and Wright, 2003). Cole and Ohanian (2004) can also be read as suggesting a link between New Deal wage policy and productivity advance, although their main concern is with its effect on employment.
Notably absent from this group, however, is transport equipment, which had been the standout performer between 1919 and 1929, although, again, the 1937 numbers for this industry may be distorted by the effect of strikes.
The sources of TFP advance in manufacturing during the 1929–1941 period differed from those during the previous decade. In contrast to the 1920s, TFP growth, at least through 1937, took place in the absence of any net capital accumulation. Advance was also, in a number of subsectors, increasingly dependent on organized research and development. It is quite astonishing for those not inclined to think of the depression as a technologically progressive era to note the increase in R&D employment during the worst years of the downturn. Total R&D employment in U.S. manufacturing rose from 6,274 in 1927 to 10,918 in 1933, and then almost tripled in the following seven years of double-digit unemployment, reaching 27,777 in 1940.30
National Research Council; see Mowery, “Emergence”; and Mowery and Rosenberg, “Twentieth Century Technological Change,” p. 814.
Margo has documented how much lower was the incidence of depression unemployment among professional, technical, and managerial occupational classifications as compared, for example, with unskilled or blue-collar labor, or those with fewer years of schooling.31
It is a stretch, however, to interpret this increase in the relative demand for high end labor as the consequence of what Goldin and Lawrence Katz have described as capital-skill complementarity.
32 Goldin and Katz, “Origins.”
There was no net capital formation, at least in the private sector, and even within manufacturing, the real net capital stock was less than 10 percent higher in 1941 than it had been in 1929.
33 U.S. Bureau of Economic Analysis, Fixed Asset Table 4.2.
To the degree there was complementarity, it was between skill and the disembodied technical change that was such an important feature of the depression years.
If one ranks two-digit manufacturing industries by the number of scientists and engineers employed in 1940, chemicals tops the list by a wide margin and, as noted, its TFP performance was stellar over the entire 1919–1948 period. Chemicals, electrical machinery, and petroleum account for almost half of R&D employment in 1940, and the 11 industries employing more than 1,000 R&D workers in 1940 accounted for over 95 percent of the total in that year. Absent from this group were tobacco, textiles, apparel, lumber, furniture, paper, publishing, and leather—industries which, with the possible exception of tobacco manufacture, can be identified with the first, pre–Civil War industrial revolution. It should be noted, however, that a number of these latter industries, particularly tobacco and textiles, also turned in very respectable TFP performance over this period.
The overall trends revealed in the employment data are echoed in other R&D indicators. Between 1929 and 1936 the annual rate of founding of new R&D labs (73) exceeded the comparable statistic between 1919 and 1928 inclusive (66), and real spending on R&D in manufacturing more than doubled during the 1930s, with an acceleration at the end of the decade.34
Mowery and Rosenberg, “Twentieth Century Technological Change,” pp. 814, 819.
DISAGGREGATION OF PRODUCTIVITY GROWTH, 1929–1941
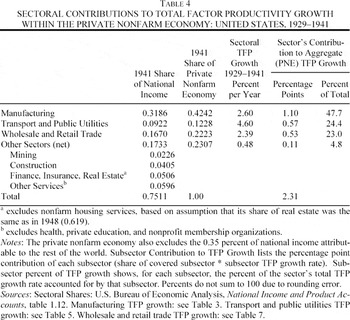
Between 1929 and 1941, as noted, TFP growth in manufacturing fell by half (see Table 4). There are really two questions to be addressed here; one focusing on the doughnut and the other on the hole. On the one hand, why did TFP growth fall from 5.12 percent per year to 2.60 percent per year comparing the 1920s with the 1930s? The most likely explanation is that the extraordinary across-the-board gains from exploiting small electric motors, and reconfiguring factories from the multistory pattern that mechanical distribution of steam power required to the one story layout that was now possible, were diminishing in aggregate magnitude by the end of the 1920s. They were not exhausted. It is simply that one could no longer hope to continue to generate 5 percent per year growth in the sector's residual from this source.
The second question, then, is why did not TFP growth in manufacturing fall even more? Here the answer has to do with the remaining mileage from reconfiguring factory floor layout; a trend toward larger capacity equipment and fixed installations; the use of new materials, particularly plastics and alloy steels; modest investments in instrumentation that saved both capital and labor; improved chemical processes for extracting minerals and processing agricultural materials; and a variety of advances that increased thermal efficiency (for details, see the penultimate section of this article).
Many of these initiatives, and others, benefited from the contributions of a maturing and expanding privately funded research and development system that had begun with Edison at Menlo Park. The lion's share of private R&D spending was then and is now done in manufacturing, and a variety of new technological paradigms, most notably in chemical engineering, were ripe for exploitation. Although the rate of TFP advance in manufacturing dropped by half if we compare 1929–1941 with 1919–1929, it remained at very high levels by the standards of the twentieth century. What is striking about the 1930s in comparison with the post 1973 period in the United States is the broader base of productivity advance within the sector (see Table 2).
The growing importance of the manufacturing sector—it generated about a quarter of national income in 1929, almost a third in 1941—helped counterbalance the within-sector decline in TFP growth in terms of the ability of the sector to contribute to high and indeed accelerating TFP growth in the aggregate economy during the 1930s. Still, this roughly 2.6 percentage point decline in the TFP growth rate in the sector worked in the opposite direction, reducing the overall importance of manufacturing in aggregate TFP growth. Clearly, one had to have substantial accelerations in TFP growth in other sectors in order to produce the 2.31 percent per year growth rate reported in Table 1 for the private nonfarm economy.
That acceleration, as I will show, came principally within transportation and public utilities (about a tenth of the economy) and wholesale and retail distribution (about a sixth of national income). Transport and public utilities' TFP growth rate was higher—4.60 as compared with distribution's 2.39 percent per year, but because distribution was a larger share of the economy, it contributed about the same percentage of PNE TFP growth as did transport and public utilities. Together, these two sectors were almost as important for TFP growth as was manufacturing, and along with manufacturing, they account for over 95 percent of advance in the private nonfarm economy during the depression years.
These calculations are based on a division of the economy into four main subsectors: manufacturing, transport and public utilities, wholesale and retail distribution, and other. I begin by calculating each sector's share of national income, and then calculate each sector's share of the private nonfarm economy. In 1941 agriculture, forestry, and fishing generated 8.06 percent of national income, and government 10.07 percent. Also excluded from the private nonfarm economy are nonfarm housing services, and the nonprofit sector, defined as the sum of health, private education, and nonprofit membership organizations. Real estate's share of national income is partitioned into its nonfarm housing portion and a remainder according to the ratios in the 1948 data. Taking into account these various exclusions, the private nonfarm economy covers about three-fourths of the aggregate, and approximates the BLS definition and that used by Kendrick. Thus, for example, whereas manufacturing contributed 31.9 percent of national income in 1941, it comprised 42.4 percent of the private nonfarm economy.
I begin with two critical numbers, the 2.31 percent per year growth of TFP for the private nonfarm economy reported by Kendrick, and the estimate for manufacturing TFP growth (2.60 percent per year) whose calculation was discussed previously. I proceed by constructing an estimate for TFP advance in transportation and public utilities (4.60 percent per year), and one for wholesale and retail trade (2.39 percent per year). I am then able to back out an implied net TFP advance in the remaining “other” sector of 0.48 percent per year. Table 4 summarizes these results.
TRANSPORT AND PUBLIC UTILITIES
The calculations for transport and public utilities are the most complex. This sector constituted about 12 percent of the private nonfarm economy—a little more than half the share of wholesale and retail trade. But the estimated growth of TFP is approximately twice as high, and the rapid acceleration of TFP growth in this sector means that it contributed slightly more to aggregate growth than did advance in distribution.
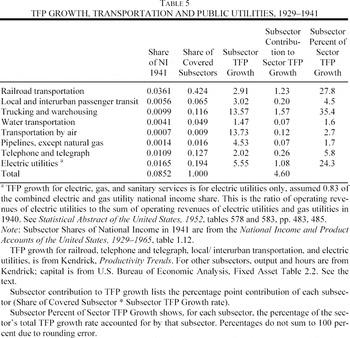
The 4.60 percent per year figure is based on estimates for eight subsectors: railroad transportation, local and interurban passenger transport, trucking and warehousing, water transport, air transport, pipelines, telephone and telegraph communication, and electric utilities. All told these eight sectors cover 92.5 percent of the entire transport and public utilities sector. Within the covered sectors, the largest weight is on railroads (0.42), followed by electric utilities (0.19), telephone and telegraph (0.13), and trucking and warehousing (0.12).
From Kendrick, we can obtain TFP estimates directly for railroads, local and interurban passenger transport, telephone and telegraph, and electric utilities. For the other subsectors, one can get output and persons employed from Kendrick on an annual basis. To obtain subsector capital input series, I go to the BEA's Fixed Asset Table 2.2. For trucking I use the real net capital stock data for trucks, buses, and truck trailers; for airline transport, aircraft; for water transport, ships and boats; and for pipelines, petroleum pipelines. For trucking and water transport, my calculations are for 1942 and 1940 respectively, because of the years for which Kendrick provides output and employment data.
These calculations (see Table 5) reveal a stellar across-the-board productivity performance in transportation and public utilities between 1929 and 1941, with the exception of water transport. Of the 4.60 percent per year TFP growth in transport and public utilities, trucking and warehousing account for 35 percent of the total (1.57 percentage points), railroads an additional 28 percent (1.23 percentage points). Thus almost two thirds of the advance in this sector took place in surface transportation. Electric utilities makes the third largest contribution (24 percent) to sectoral growth.
In terms of subsector rates of productivity growth, airline transport and trucking top the list, with compound annual average growth rates of TFP over the period of 13.73 and 13.57 respectively. Both of these industries benefited from public spending, the airlines from subsidized airmail transport and the construction of airports during the 1930s, and trucking from the build out of the surface road and bridge and tunnel network during the depression.35
See Field, “Most Technologically Progressive Decade,” tables 4 and 5, p. 1408, and “Origins.”
Because my analysis emphasizes the importance during the depression of private sector spillovers consequent in part upon government infrastructural investment, one might ask by how much the PNE TFP growth rate for 1929–1941 would be reduced were one to add to private sector capital input a portion of government infrastructural investment complementary to private sector activity, and whether this would affect the rankings of time periods by TFP growth rates reflected in
Table 1. In other words, is what we see here simply a matter of private sector TFP rising because of a changeover from privately owned infrastructural capital in railroads to publicly owned infrastructural investment in streets and highways?
SPILLOVERS FROM PUBLIC INVESTMENT
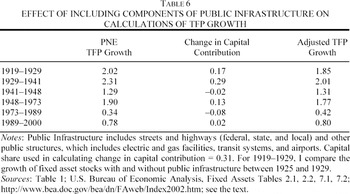
Table 6 reports how much calculated TFP growth rates change if we augment the private capital sector input with government street and highway capital plus “other” government structures (electric and gas facilities, transit systems, and airports). Tables 2.1 and 7.1 of the BEA's Fixed Asset Tables provide annual estimates in current dollars of private and government capital stocks from 1925 onwards. Tables 2.2 and 7.2 provide chained index numbers for components of the real net stock starting in 1925.
In order to construct a measure of private sector fixed capital augmented by these components of government infrastructure, I start with the chained indexes, and, for convenience, rescale them using multiplicative constants so that the 1925 index (rather than 1996) equals 100. I then obtain series for the real net stocks as the product of this transformed index number and the 1925 current dollar start value. Because the growth of the chain index between two years is based on a geometric average of the differences calculated using current dollar and prior year prices, it provides a result intermediate between a Paasche and a Laspeyres index of growth of an asset component.
Using these data, I calculate the growth rate of the real net stock of fixed private assets between 1929 and 1941, and the rate of growth of this stock augmented by government street and highway capital and other structures as described previously.36
Most of the government infrastructural addition is streets and highways: 90.8 percent in 1929 and 90.2 percent in 1941.
Between 1929 and 1941, the private capital stock fell by –0.14 percent per year, while the augmented stock grew by 0.80 percent per year, a difference of 0.94 percentage points. Because quality-adjusted labor input rose at 0.12 percent per year, and assuming it is reasonable to talk of private and government capital contributing additively to a combined capital measure, including this public infrastructure does change the depression years from a period of capital shallowing to one of mild capital deepening.
37 For labor input, see Kendrick, Productivity Trends, table A-XXIII.
If we multiply the change in the rate of capital growth (0.94) by 0.31, the estimate I have been using for capital's share, we conclude that adding in the services of this government infrastructural capital increases the contribution to growth attributable to capital by 0.29 percentage points per year. Consequently, TFP growth between 1929 and 1941 is reduced from 2.31 to 2.02 percent per year on this account.
Table 6 also reports how much difference this type of calculation would make in other periods. For 1919–1929, I rely on capital data for the years 1925–1929. Note that for 1941–1948 and 1973–1989, the augmented capital stock grows more slowly than the private stock alone. In these instances the effect of including government infrastructure is to raise estimates of TFP growth. But the main conclusion is that adding these components of public infrastructure to private sector capital input does not alter the preeminence of 1929–1941 in comparisons of TFP growth across the twentieth century. It is not just the physical capital deepening associated with government infrastructure spending in the 1930s that helps explain high labor productivity growth rates. It is also the positive production externalities such investment engendered in the private sector, especially in transport and public utilities and in distribution. In particular, public investment in the surface road network during the 1930s allowed very rapid TFP advance in trucking and warehousing and quite respectable productivity growth in railroads as the economy was reconfigured to take advantage of a transport system in which long-haul rail distribution could be more extensively integrated with local and regional use of trucks.38
Because of the much larger size of high schools in comparison with elementary schools, and the need to assemble students together from a much larger area, surface road improvement may also have played a role in the acceleration of high school graduation rates across the country during the 1930s (see Goldin, “America's Graduation from High School,” p. 368).
In turn, as is shown below, it was also associated with rising TFP growth in distribution, a trend that continued into the 1941–1948 period.
Even though housing services are excluded from the private nonfarm economy statistical analysis, some discussion of the effects on this sector of the depression era surface road build-out are warranted.39
Productivity trends in housing services are distinct from those in construction, which are discussed in what follows.
Street and highway construction proceeded at rapid rates during the depression, and then essentially ceased between 1941 and 1948. During the 1930s design principles for residential subdivision in an automobile age were worked out under the aegis of the Federal Housing Authority. A few demonstration projects were constructed, but the impact on housing sector productivity was small before the war because housing construction took so long to recover. Nevertheless, government- and university-financed research and development during the 1930s provided the foundation for the acceleration in both housing construction and housing productivity (flow of real rental services per unit of housing capital) that took place between 1948 and 1953 and continued at somewhat slower rates in the postwar period.
Edward Denison's data show an index of housing sector real national income at constant (1958) occupancy rates growing from 40.7 to 70.8 over this five year period.40
Denison, Accounting for United States Economic Growth, table 3–6, p. 28; 1958 = 100.
The BEA's Fixed Asset Table 5.2 shows an index of the net stock of private residential fixed assets growing from 23.1 in 1948 to 28.2 in 1953. In other words, sector output, adjusted for occupancy rates, grew at a compound annual average growth rate of 11.1 percent a year while input grew at 3.99 percent per year, implying a sectoral productivity growth rate of over 7 percent per year.
41 Because housing services are largely generated using housing capital alone, TFP growth in the sector is almost identical to the growth in output per unit of capital.
It is certainly true that some of the advance between 1929 and 1941 benefited from ground work done in earlier decades. But if the depression period drew from this larder, it also replenished it, establishing the basis for subsequent productivity advance. Another example: Almost all of the development work done by Philo Farnsworth on the quintessential postwar consumer commodity was carried out during the depression, supported by venture capital funding. The new product was introduced to a wide public in 1939 at the New York World's Fair, but the demands of war forestalled its full exploitation until after 1948. Thus although it is undoubtedly true that the technological achievements of the 1930s built on foundations put in place during the depression years as well as work done in the 1920s and earlier, it is also the case that the period laid the foundation for much of the productivity growth of the 1950s.
It is useful to contrast the effects of the boom in street, highway, and other infrastructure construction during the 1930s with those of the rather different government-financed capital formation boom that took place during the 1940s. The latter effort poured more than $10 billion of taxpayer money into GOPO (government owned, privately operated) plants. Almost all of this infusion was in manufacturing, and a large part of it went for equipment, particularly machine tools, in such strategic sectors as aluminum, synthetic rubber, aircraft engines, and aviation fuel refining.42
Most of this capital was then sold off to the private sector after the war.
The most spectacular expansion of equipment investment in the history of the U.S. economy was associated with negative TFP growth in manufacturing between 1941 and 1948 and, partly as a result, a slowdown in private nonfarm economy TFP growth overall (see Tables 1 and 3). Outside of manufacturing, in sectors which were largely spared this infusion of equipment investment, productivity growth picked up speed somewhat during the 1941–1948 period.43
Manufacturing's share of value added in 1948 was 0.2776. The private nonfarm economy, which excludes agriculture, government, nonfarm housing services, health services, private education services, social services, and membership organizations, was 0.7284 of value added. Thus manufacturing's share of the private nonfarm economy was 0.381, and it contributed –0.20 percentage points per year to the PNE's TFP growth rate of 1.29 percent. This implies that TFP growth outside of manufacturing must have been 2.41 percent per year.
A forthcoming paper explores more comprehensively the implications of this experience for the equipment hypothesis.
44 Field, “Equipment Hypothesis.” See also De Long and Summers, “Equipment Investment.”
WHOLESALE AND RETAIL TRADE
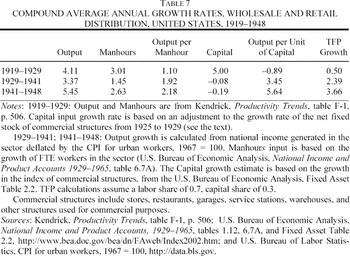
Wholesale and retail trade comprised over a fifth of the private nonfarm economy during the depression years, but Kendrick's data do not allow an estimate of TFP growth in the sector between 1929 and 1941. Key assumptions underlying my own estimate include the use of full time equivalent workers to calculate input growth rates for labor, and the use of the index of the net stock of commercial structures to calculate the growth of capital input. Table 7 shows a 2.39 percent growth rate in the sector, in the same range as in manufacturing, but less than in transport and public utilities. Because of the sector's larger share, however, distribution contributed almost as much to the growth of PNE TFP as did transport and public utilities.
The depression years present a complex picture in terms of advances in distribution. On the one hand, it experienced the high tide of such restrictive legislation as resale price maintenance (the Robinson-Patman Act) as well as various anti chain store legislation at the state level.45
See Field, “Relative Productivity.”
At the same time these legislative reactions are testimony to the inroads made by A & P supermarkets, Woolworth's, and other distributors who were taking advantage of the extension of the long distance telephone network as well as a more flexible distribution system associated with the rapidly expanding surface road network.
After taking into account the contributions of manufacturing, transport and public utilities, and distribution, the remaining (other) portion of the private nonfarm economy which includes mining, construction, finance, insurance, and other services, experienced TFP growth of less than half a percent a year, and accounted for less than five percent of PNE TFP growth during the depression. I do not attempt a detailed breakdown within this remainder category, some of whose components certainly experienced TFP advance higher than 0.48 percent per year, and others lower and possibly negative rates.
Within the former category, mining is a promising candidate. If we follow procedures used within the transport and public utilities sectors, using Kendrick output and labor input data and a weighted average of mining equipment/oilfield machinery and mining structures and wells from the BEA's Fixed Asset Table 2.2, TFP growth within the sector comes in at 1.47 percent per year between 1929 and 1941.
My candidates for laggards would include construction, which took a long time to recover from its collapse in the first part of the depression.46
Output in construction only began to reapproach levels typical in the 1920s after 1938 (see Field, “Uncontrolled Land Development” and “Impact.”
Kendrick estimates that output per man hour in the sector fell between 1929 and 1937, and in 1948 it was barely above its 1929 level.
47 See Kendrick, Productivity Trends, table E-1, p. 498.
In a relatively non-capital-intensive sector this suggests low or perhaps even negative TFP growth over the period.
A second candidate would be the remainder of the finance, insurance, and real estate (FIRE) sector. Stock market trading volume plummeted, and there is no evidence of significant organizational or technological change during the 1930s. The basic system for ordering securities trades and receiving confirmation of execution, which developed after the Civil War, persisted for almost a century, breaking down only in 1968, the year in which peak 1929 daily trading volume was finally reattained and then repeatedly breached. Subsequent to the crisis, which forced Wednesday closings of the New York Stock Exchange for most of the second half of 1968 as brokerage houses struggled to deal with the backlog, technological and organizational changes in the sector have permitted average daily trading volume to increase by two orders of magnitude. But all this took place several decades after the end of the depression.48
See Field, “Telegraphic Transmission.”
Banking, of course, was profoundly affected by the downturn, with failures of thousands of banks and persisting disruptions of the normal functioning of financial intermediation. The entire FIRE sector shrank in relative importance between 1929 and 1941, from 14.75 percent of national income in 1929 to 8.93 percent in 1941.
1919–1929 DISAGGREGATION OF TFP GROWTH
How did the drivers of TFP advance in the 1930s differ from those in the 1920s? Using a similar approach, we begin by using 1929 sectoral weights, making adjustments to real estate and other services similar to those made for 1929–1941. From Kendrick, we have an estimate of annual TFP growth within manufacturing (5.12 percent per year). Based on the earlier discussion of wholesale and retail trade, I estimate TFP growth within the sector at 0.50 percent per year. What about transport and public utilities? How much had TFP growth in this sector accelerated during the 1929–1941 period, in comparison with the 1919–1929 period?
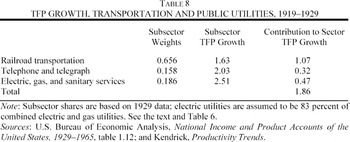
The absence of detailed subsector capital stock data for 1919 (the BEA's fixed asset data begin in 1925) makes it difficult to estimate TFP growth in the sector in as comprehensive a fashion as is done for the 1930s. But we can calculate from Kendrick TFP growth rates for three of the subsectors: railroads, telephones and telegraphs, and electric utilities. For the 1919–1929 period, these TFP growth rates clock in respectively at 1.62, 2.03, and 2.51 percent.49
See Kendrick, Productivity Trends.
Using 1929 subsector weights, we get an estimate of TFP growth in the sector of 1.86 percent per year between 1919 and 1929 (
Table 8).
Kendrick reports that output per hour in distribution between 1919 and 1929 rose at 1.1 percent per year, and the question is how much of this can be attributed to capital deepening. The BEA's Fixed Asset Table 2.2 shows that the net stock of other commercial structures grew at 5.76 percent per year between 1925 and 1929. How much can we assume it grew between 1919 and 1929? An acceleration of apartment and commercial office building construction followed culmination of the single family residential housing boom in the mid 1920s, so the end of decade rate was probably somewhat higher than that prevailing between 1919 and 1925.50
Field, “Uncontrolled Land Development.”
I have assumed an overall rate of increase of physical capital in distribution of 5 percent per year over the entire ten-year period 1919–1929. This implies 4.45 percent growth between 1919 and 1925, the first year for which the BEA data are available, with an acceleration to 5.76 percent per year between 1925 and 1929. Assuming a capital share of 0.3, we can then attribute 0.60 percentage points of the 1.1 percent per year labor productivity growth [(5.00 – 3.01)
* 0.3] to capital deepening, leaving a residual of 0.50 percent per year in distribution for the 1919–1929 period.
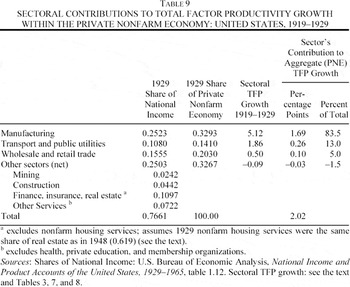
Combining this number with Kendrick's 5.12 percent figure for TFP growth within manufacturing between 1919 and 1929, and the estimate that TFP in wholesale and retail trade rose at about 0.5 percent, we can back out an implied net TFP growth for the remainder of the private nonfarm economy (38 percent of the total in 1929) of –0.19 percent per year (see Table 9).
We can now summarize the main distinctions between the 1919–1929 and the 1929–1941 periods with respect to aggregate TFP growth and its sources. First, TFP growth in the 1920s was almost entirely a story about manufacturing. There was a significant drop in the share of TFP growth in the private nonfarm economy accounted for by manufacturing, from 83 percent in the 1920s to 48 percent in the 1929–1941 period. This is due primarily to a halving of within-sector TFP growth only partially compensated for by the expanding size of the manufacturing sector.
The extraordinary TFP growth in manufacturing in the 1920s was largely driven by floor space savings and improved materials flow associated with newly laid out factories. The rearrangements were made possible by the removal of the straightjacket previously imposed by a mechanical distribution of internal power.51
Devine, “From Shaft to Wires”; David and Wright, “General Purpose Technologies”; and Field, “Origins.”
Small electric motors were also critical on the product side, driving such new consumer products as vacuum cleaners, refrigerators, and washing machines. Other new products associated with the consumer revolution of the 1920s exploited electricity to drive electronics, as in radios, or to provide heat, as in toasters.
Aside from petroleum products, the standout performer at the two digit level was transport equipment, with TFP growth of 8.07 percent annually over the 1919–1929 period (see Table 4). This is hardly surprising, given what we know of the cost trajectory of a Model T Ford over these years—and what brought it about. What is striking about the first column of Table 2 is how high TFP growth rates in manufacturing were across the board during the 1920s.
While acknowledging the drop in depression era manufacturing TFP growth in relation to the 1920s, we should also acknowledge that it was, by any standard of comparison other than the 1920s, world class. Still, in order to generate a 2.31 private nonfarm economy TFP growth in the 1930s, as compared with 2.02 percent during the 1919–1929 period, the economy had to experience accelerating TFP growth in sectors outside of manufacturing. Here the two major loci were wholesale and retail trade, which registered moderate acceleration (almost as fast as manufacturing) within a subsector with a relatively large weight, and transport and public utilities, which registered very rapid gains in a somewhat smaller sector. In both of these sectors public infrastructure investment generated positive externalities in private production which contributed to their high rates of productivity growth.
DISEMBODIED TECHNICAL CHANGE
The story told by the productivity numbers is mirrored in chronologies of major process and product breakthroughs, which all show peaks during the 1930s, particularly its latter half.52
Kleincknecht, Innovation Patterns, p. 66; Mensch, Stalemate, p. 132; and Schmookler, Invention.
But it is helpful to consider some concrete examples of the largely disembodied technical change that raised both capital and labor productivity and was such a prominent feature of the depression years. A canonical instance was perhaps the introduction of new chemical processes that increased the percentage of sugar extracted from beets during refining, raising output while requiring little increase in plant and equipment or labor input. Comparable innovations were common in the mining industry.
53 Weintraub, “Effects,” p. 23.
Another category of improvements involved the pursuit of thermal efficiency. A good example is from the electric power generating industry. In 1941 output of electricity was 86.5 percent above its 1929 level, an achievement associated with an increase in labor productivity of 126 percent and of capital productivity of 73 percent compared with 1929.54
Kendrick, Productivity Trends, table H-VI, p. 590.
Partly this was made possible by the continuing trend towards larger size boilers, for which kilowatt hour costs were lower. But partly it involved the diffusion of topping techniques, which used the exhaust steam from high pressure boilers to heat lower pressure boilers. Topping raised capacity on existing stations by 40 to 90 percent with essentially no increase in fuel costs or labor, and only modest costs in upgrading parts of the plant.
55 Weintraub, “Effects,” p. 22.
Other thermal efficiency initiatives involved low cost, high payoff investments in insulation, or captured exhaust gasses from stacks and used them to preheat air to improve combustion, preheat materials for subsequent fabrication, or generate steam. Innovative efforts pursued ways to make use of solid and liquid byproducts as well as gas. Finding commercial uses for waste was the equivalent of turning industrial excrement into gold, and about as close to manna from heaven as one could get.
Advances in chemistry lengthened the life of equipment or structures. New treatments extended the life of wooden railroad ties from eight to 20 years.56
U.S. Senate, Temporary National Economic Committee, Technology, p. 110.
In the automobile industry, quick-drying lacquers reduced the time needed to paint a car from the more than three weeks it took in the early 1920s to a few hours, with big savings on inventory and storage costs. Stainless steel reduced oxidization on railway cars. Chrome plating lengthened the life of tools and moving parts.
57 Weintraub, “Effects,” p. 23.
Conveyer belts and other initiatives associated with the reconfiguration of factory layout saved labor, but perhaps even more importantly, they saved capital, enabling economies “in floor space, inventories, in storage room, in machinery and auxiliary equipment and in cost of maintenance and repairs and through the elimination of waste, reduction of spoilage and shortening of the time in process.”58
Many such gains had been reaped in the 1920s, but there was still some juice in this fruit for the 1930s. In 1933 Cadillac consolidated its production of drive trains from four floors onto one, leaving the other three available for other uses. In 1934 Packard cut in half its floor space requirements per unit of output, freeing an entire building, and similar improvements were reported by Westinghouse and Western Electric.
59 By rearranging machinery in a linear pattern and changing the way materials were handled the textile industry garnered very high rates of TFP during a period in which the basic spinning and weaving technology remained largely unchanged.
The depression years also experienced a continued trend towards larger units in the case of both equipment and fixed installations. Industrial locomotives sold between 1932 and 1936 averaged 11.4 tons, vs. 7.4 tons for sales in the years 1924–1927. The average capacity of a power shovel rose from 1.73 cubic yards in 1920–1923 to 1.90 in 1924–1927 to 2.51 in 1928–1931 to 3.28 cubic yards in 1932–1936. Because of square–cube relationships, capital and operating costs per unit of output dropped when capacity increased, a phenomenon that could also be observed in electric power generating units as well as in the spiral conveyer screws used to move materials in flour mills.60
Finally, there were new or improved materials. The substitution of plastics for wood or metal parts involved saving in fuel, fabrication, and capital costs. Tungsten carbide blades wore out much less rapidly and reduced down time. In cutting phenol resins (plastics) carbon steel blades had to be removed and resharpened after 60 feet. A carbon alloy blade cut 10,000 feet without refitting, and what previously took a month to accomplish could now be done in a day.
The period was notable for an increasing emphasis, within the limited gross capital formation that did take place, on instrumentation. By facilitating automatic process control, instrumentation lengthened the life of equipment and reduced downtime and maintenance costs. The costs of the instruments were often trivial in comparison with the improvements in both capital and labor productivity they enabled. Example: in the 1920s cracking units in petroleum refining typically had to be cleaned every four to five days. Instrumentation reduced this to one or two months, with obvious savings in labor costs and savings in capital costs reflected in higher utilization rates. Another example: Hand controlled boilers required rebricking every three months; instrument controls eliminated the need to do so entirely.61
CONCLUSION: INTERNATIONAL EXPOSITIONS AND THE CULTURE OF SCIENTIFIC PROGRESS
Such examples can be dismissed as anecdotal. It is when read in the light of the aggregate data on labor and TFP growth that they take on their full force. During the years when Alvin Hansen and others were expounding a theory of secular stagnation, the U.S. economy was, in fact, experiencing a period of technological and organizational creativity that, in the aggregate, remains as yet unmatched. Hansen's colleague at Harvard, Joseph Schumpeter, had a better fix on what was going on. He developed his homage to the power of creative destruction against the backdrop of what has turned out to be the most technologically dynamic epoch of the twentieth century. Schumpeter may have misjudged the terrain on the road to socialism, but his theories more successfully reflected the technological spirit of the age in which he wrote.
The 1939–1940 New York World's Fair took place within the shadow of the Second World War, but it was a paean to modernism, a hopeful celebration of technological and human potential as the country emerged from a decade of double digit unemployment. The most popular exhibit was General Motor's Futurama, designed by Norman Bel Geddes, the patron saint of modernism's aerodynamic aesthetic. Visitors lined up for hours for an opportunity to gaze at vistas of modern infrastructure with cars moving along 14-lane freeways. From everything we can tell, the American public contemplated these vistas with a complete lack of any kind of distancing or ironic sensibility. They had seen enough on the ground already to understand that Bel Geddes's vision of the United States in 1960 would not, by and large, be science fiction.
A quarter century later, at the 1964–1965 New World's Fair at the same site in Flushing Meadows, General Motors tried to replicate its earlier success with a new Futurama, looking forward another quarter century and beyond, to human colonies living on the moon, in Antarctica, the jungle, the desert, and the ocean floor. It was unable to capture the popular imagination, and its forecasts of the future have proved far off the mark.
A final piece of cultural history. When Disneyland opened in 1955, it attempted to carry forward in one of its themed sections the spirit of the 1939–1940 World's Fair.62
“You will actually experience what many of America's foremost men of science and industry predict for the world of tomorrow,” wrote a late 1950s guidebook (Handy, “Tomorrowland,” p. 115).
Tomorrowland was initially the most popular of Disneyland's four areas and had as its centerpiece a TWA rocket poised to transport visitors to the Moon and beyond. Fourteen years later we did in fact go to the moon, albeit in a three stage rocket. But by the 1990s, Tomorrowland had begun to look a bit down at the heels. Disney's Imagineers apparently pulled out their hair trying to develop a new and compelling vision of the future that their audience, with its more jaded and ironic attitude toward new technology, would accept.
They were unable to do so, and in this instance, did not try. Instead, in the updated area that opened in 1998, they aimed at recapturing the visual imagery of 1930s' (and earlier) visions of the future. Disney felt compelled to develop a retro Tomorrowland. The one remnant of the earlier vision was an exhibit called Innoventions, a display area for new products soon to be launched commercially. It represented an island of technological futurism within a sea of nostalgia. What used to be front and center had become a side show.
Is it entirely accidental that what is generally acknowledged to have been the greatest international exposition of the twentieth century took place in New York in 1939 and 1940, as the U.S neared the end of its most technologically dynamic epoch, having opened up a substantial productivity gap between itself and Europe and the rest of the world?63
On the closing of that gap, see Abramovitz, “Catching Up.” My differences with Abramovitz have to do with his acceptance of the conventional wisdom that the gap was largely the result of the war.
After the 1964–1965 New York Fair, Montreal in 1967 and Osaka in 1970 can claim some measure of critical if not always financial success. But who now speaks of or will long remember Spokane (1974), Knoxville (1982), New Orleans (1984), Vancouver (1986) or Seville (1992)?
It may be that we are now on the brink of or possibly even in the midst of an era of technological advance as dramatic and broad based as what took place between 1929 and 1941. Many have suggested and continue to suggest as much, and it is possible that a decade from now the evidence will solidly support the assertion. But a dispassionate look at the data currently available does not yet allow this conclusion.64
As the final version of this manuscript was edited in the Fall of 2005, the U.S. economy still had not reattained full employment. Output per hour in the PNE grew at 3.10 percent per year between second quarter 2000 and second quarter 2005, slightly above the record achieved during the golden age (1948–1973; see Table 1). But growth in hours between 2000:2 and 2005:2 has been negative (–0.5 percent per year), reflecting the disappointing job creation record of the Bush presidency, and a good deal of the increase in output per hour has no doubt been due to capital deepening. Until the economy returns to full employment, and we have more up-to-date capital input numbers, we can only guess at the longer term trend in TFP. As of August 2005, the BEA had not posted capital stock numbers beyond 2002, and the BLS had not posted TFP (multifactor productivity) numbers for the private nonfarm economy beyond that year.
It is easy to demonstrate that IT spearheaded a revival of productivity growth relative to what took place during the dark ages (1973–1989). Showing that recent advance surpasses what took place during the 1930s is much harder. With respect to productivity performance, the depression years and more generally the interwar period remain a tough act to follow.
For comments on earlier versions, thanks to Nick Crafts, Stanley Engerman, Robert Gordon, Robert Solow, Gavin Wright, and anonymous referees. I also thank participants at the conference “Understanding the 1990s: The Economy in Long Run Perspective” (Duke University, 26–27 March 2004), the 2004 World Cliometrics conference (Venice, Italy, 8 July 2004), the 2004 Economic History Association annual meetings (San Jose, CA, 12 September 2004), and seminars at Harvard, Dartmouth, Rutgers, UC Berkeley, the University of Virginia, Indiana University, Ohio State, Stanford, Yale, Michigan, and UCLA.