One of the most significant and widely reported aspects of emancipation after the US Civil War was the movement of African Americans across counties, states, and regions. The 1868 report of Massachusetts Congressman Thomas D. Eliot, Chairman of the Committee on Freedmen's Affairs, was typical in its tone of paternalism, pity, and alarm: “The whole social system of the south was shatered [sic]. . . . Thousands of colored people, suddenly set free, thrown out of employment, without homes, without means of subsistence, crowded into cities and villages to seek charity or sympathy and advice. Others, in great numbers, who had followed our armies were collected in camps or deserted farms” (H.R. Rep. No. 30–40, at 3).Footnote 1
Yet, we know little about these movements except in the most general sense. The Civil War in the American South constituted what historian Yael Sternhell (Reference Sternhell2008: 39) has called “a revolution in motion.” Tens of thousands of men and women took to the railroads and the country roads, moving hundreds of miles to fight in, escape from, or work in the war. In the war's aftermath another round of motion began, as African Americans searched for reliable work, family members, and economic opportunity. Indeed, Sternhell (Reference Sternhell2012: 152) concluded, “African Americans’ new freedom of motion remains the most important and most durable legacy of the Civil War's universe of flight.”Footnote 2
Based largely on the textual evidence in newspapers, letters, and diaries, historians have presented widely varying interpretations about the movements of freedpeople after the war. Leon Litwack's monumental Been in the Storm So Long (Reference Litwack1979) charted the complex negotiations between planters, freedmen, and bureau agents over the meaning of emancipation, and tracked the desire of African Americans to claim freedom by moving when and where they wanted. Yet, some historians have dismissed the idea of a large-scale migration entirely, arguing that white fears of black mobility fueled rumors that made their way into white newspapers, letters, and diaries. These historians have argued that most blacks stayed put or moved nearby, often no further than the adjacent county. Litwack noted that large numbers of African Americans stayed on the plantations, but he also featured black mobility as a visible, tangible, and substantial marker of emancipation (ibid.: 309–10, 386, 410–11, 419; see O'Donovan Reference O'Donovan2007: 120).
Social scientists have also explored aspects of black mobility in the nineteenth century, but no studies have charted the immediate years after emancipation. In a recent assessment of the roots of the Great Migration, economic historians Kenneth Chay and Kaivan Munshi argued that some southern counties produced underlying conditions for collective mobilization and that both the number of black migrants and the spatial concentration of these migrants from these places and across destinations “track together.” They posited that immediately after emancipation, African Americans formed strong social ties and networks in certain places (and not others), and that these persisted into the Great Migration. But Chay and Munshi relied on Litwack and other historians for their evidence about the initial postemancipation character of black mobility, population concentration, and social institutions.Footnote 3
Because of the absence of location-specific data about the movements of African Americans in the years immediately following emancipation, historians have relied heavily on textual accounts. Historian Heather Andrea Williams (Reference Williams2012: 143–53) documented the emotional history of separation and reunification in the postwar South. Reviewing thousands of advertisements and Freedmen's Bureau records, Williams found considerable evidence of black movement, stemming from the desire to reunify families. At the same time, she also documented the lack of respect and the casual disregard that freedmen encountered in the local and state offices of the bureau, where transportation voucher requests were often withheld, and the overriding objective was often to keep black people in place working to produce cotton, rice, sugarcane, and other crops. Assessing the literature on black mobility, historian Kendra T. Field points out that historians have frequently dismissed these movements as “demographically insignificant, regionally specific, or otherwise exceptional” (Field Reference Field2015: 694). Instead, Field has depicted African American movements after Reconstruction into Oklahoma as a first step in a broader transnational migration to Liberia. While using different methods but relying on similar sources, both social scientists and historians have argued for the significance of early migrants—those who prefigure a broader phenomenon only visible later.Footnote 4
Recent interpretations of the movements of refugees, freedmen, soldiers, and civilians during and after the Civil War have stressed the high degree of contingency and complexity that surrounded these moves. The most complete assessment of mobility can be found in the two most recently published volumes of Freedom: A Documentary History of Emancipation, 1861–1867. Hahn et al. (Reference Hahn, Miller, O'Donovan, Rodrigue and Rowland2008) and Hayden et al. (Reference Hayden, Kaye, Masur, Miller, O'Donovan, Rowland and West2013) conclude that the peak movement of freedpeople occurred in the winter of 1866–67 and argue that the local offices of the Freedmen's Bureau played an important role in the flow of movement, affecting “the trajectory, volume, and pace of migration” (ibid.: 798).
A wide range of factors played a role in shaping the individual decision to leave a place, seek out distant relatives, or take a job. The availability of transportation networks, especially railroads, may have been less significant than the birthplaces and family connections of mobile populations, the attitudes of the Freedmen's Bureau officers, and the rumors about potential employment opportunities down the road. In her study of mobility in the Confederate South, Sternhell (Reference Sternhell2012: 169) concluded, “Postemancipation black mobility was a complex and varied phenomenon, encompassing an untold number of individuals who used mobility in the service of many different priorities and goals.”Footnote 5
The scale of the movements by freedmen and women can be glimpsed in the aggregate records of the Freedmen's Bureau. Although the bureau never compiled a definitive number of labor contracts or tracked labor movement, bureau records indicated that more than 9,000 former slaves came through the Washington, D.C., office and were transported to the North with labor contracts between 1865 and 1867 (Bureau of Refugees, Freedmen, and Abandoned Lands M1913). In Louisville, Kentucky, the bureau issued 400 passes to former slaves for transportation in May 1865, but the same office issued 2,571 passes one month later in June 1865 (Bureau of Refugees, Freedmen, and Abandoned Lands M1904). All together between May 1865 and September 1867, the Freedmen's Bureau issued transportation vouchers for more than 29,000 freedmen, the vast majority of these in the year between September 1866 and 1867, and most of them to individuals deemed a public charge (H.R. Rep. No. 30-40, at 10; Howard Reference Howard1869: 21).
The bureau offices, furthermore, organized labor contracts on a much larger scale. In one state alone the bureau negotiated 50,000 contracts in this period (Howard Reference Howard1869: 9). General O. O. Howard considered the negotiation of these contracts to have been “a school in which he [the freedman] learned the first practical business lessons of life” (ibid.). Officers made it clear to former slaveholders that the bureau had the authority to negotiate contracts that transported freedpeople “to other points where the freedmen could get better wages” (Executive Documents of the House 1866: 327). So, while some of the contracts were local, others purposefully transported thousands of African Americans out of and across the South. Thousands of local contracts were signed in every state, hundreds in each district (ibid.: 253). Yet the bureau never reported a detailed aggregate tabulation of either the number or extent of the contracts signed between employers and freedpeople.Footnote 6
These early or “first wave” African American migrants are the subject of this study. Building on work undertaken in a National Endowment for the Humanities “Digging into Data” research project, we attempt here to document and assess the movements of African Americans in the immediate postwar years, both within and out of the South, and, in effect, to map the motion taking place after the war. We undertake two methodologies to reconstruct these movements, one using contemporaneous records, the other using later individual census data to infer mobility patterns. Both allow us to begin to document the scale and intensity of African American mobility in the period between 1865 and 1867.
First, we compiled thousands of Freedmen's Bureau labor contracts from railroad gateway cities in the Upper South and modeled the spatial and temporal patterns of movement of African Americans beginning in the summer of 1865. In addition, we reconstituted the 1861 railroad network and computed rates of travel for each of the major Freedmen's Bureau offices in the Upper South. These maps provide an indication of the possibilities for freedmen's movement and the relative spatio-temporal distances of key places on the railroad network in the aftermath of the war when nearly all parts of the network reopened. Second, we used 1880 census birthplace, age, and location data to reconstruct and interpolate African American migration from the South into a northern border state—Ohio—and a Deep South state—Arkansas—during this period.Footnote 7
While the Freedmen's Bureau records indicate certain kinds of movements, our census methodology shows that there was more movement out of the South than accounted for in the Freedmen's Bureau labor records or previously accounted for in the historiography. Further, we observe two different types of movement: short-term migration based on one-year contracts, perhaps returning to the point of origin; and another movement not always mediated through the Freedmen's Bureau that was longer term, but also characterized by an eventual return to the point of origin.
We seek first and foremost to chart the process of emancipation over time and across space, detecting spatial patterns on an otherwise highly variable individual experience. No study has used the Freedmen's Bureau labor contracts to trace African American labor movements, and no study has deployed the 1880 individual census data to examine African American migration based on birthplace cohorts.Footnote 8
Emancipation inaugurated migration patterns of black southerners in particular, traceable ways. Large numbers of migrants flowed through the South's rapidly reconstituted rail network, many more people than we had thought went northward, and more moved to Arkansas and the plantation frontier than we would have guessed.
Mobility through the Freedmen's Bureau Offices
Historians are finding that an increasingly high level of personal mobility characterized the entire Civil War era. Displacement and migration, more than violence and destruction, may have typified the common experience of the war for all southerners, whether black or white, soldier or civilian, male or female. A few examples are instructive. Stephen Ash's A Year in the South: 1865 (Reference Ash2004) follows four southerners as they traversed the last year of war and the first year of emancipation. Each of them faced dislocation and disorientation. Former slave Louis Hughes traveled on foot and by train from Alabama to Memphis, Tennessee, in 1865, and he found a city he hardly recognized with thousands of freedmen in the streets. John Robertson, a white Tennessean, headed west in the summer of 1865 from Knoxville, where hundreds of blacks came having left slavery. Traveling through Chattanooga and Memphis, he encountered thousands of African Americans at the depots and on the roads. Both places were part of the great unmooring during the Civil War as thousands of southerners, white and black, moved to new places, took to the road, or returned home.Footnote 9
Contemporary newspaper accounts confirm the idea that large numbers of freedmen and women could be found on the South's roads and railroads. In June 1865, the New York Times reported from Georgia, “Within the past few days we have had several reports from the country of the most discouraging character, so far as many of the planters are concerned. A large proportion of these, located along the railroad lines, have been deserted by their field hands, leaving none behind except the very old and helpless young” (June 12, 1865). Between Columbia and Charleston, South Carolina, in early 1867 “all along the line of the railroad,” the New York Times (January 16, 1867) reported, huge “camps of negroes who are thus gathered along the road waiting for transportation to Florida.” Thousands left the upper and middle districts of South Carolina in “families.” In other parts of the South, black freedmen traveled to new places for work and to reunite with family. As many as a thousand freedpeople a week were moving through Atlanta on the railroads headed out west. The Freedmen's Bureau in Texas reported in 1866 that 125,000 freedpeople had been moved by slaveholders to Texas for “safekeeping” during the war, and these men, women, and children were moving back east along the old San Antonio Road to reunite with their families (Executive Documents of the House 1866: 313). But many of the newspaper accounts were heavily judgmental, either criticizing freedpeople for moving or depicting them in pejorative terms as incapable and dependent.Footnote 10
Rather than using these anecdotal, often distorted accounts, we explore sources with spatial information and inquire into the scale, direction, and character of the movement of freedpeople after the war. Only a handful of places along the South's border were linked by railroads to networks of lines into the Northern states. Alexandria, Virginia; Memphis, Tennessee; Chattanooga, Tennessee; St. Louis, Missouri; and Louisville, Kentucky, gave access to Baltimore, Maryland; Philadelphia, Pennsylvania; Cincinnati, Ohio; and Chicago, Illinois. These highly networked points in the Upper South and along the border served as railroad gateways to the North, but each was bordered by a major river or sat a considerable distance from the border between North and South. The Freedmen's Bureau set up field offices and issued labor contracts in all of the railroad centers and gateway cities in the Upper South, including Alexandria, Virginia; Washington, D.C.; Petersburg, Virginia; Louisville, Kentucky; Chattanooga, Tennessee; and Memphis, Tennessee. Each of these rail hubs, however, possessed different characteristics. Louisville, for example, ranked first among southern cities in the square miles accessible in one day's travel (192,538 sq. miles), a large footprint that extended into the north across the Ohio River. Alexandria and Petersburg, by contrast, afforded better connectivity into the South. Chattanooga possessed a large territory accessible in one day's travel by rail (more than 146,000 sq. miles), while Memphis's connectivity ranked well below all the others in the distance one could travel in one day by rail (Thomas et al. Reference Thomas, Nash and Shepard2016).
Despite Memphis's relatively low connectivity, however, its rail lines provided unimpeded access to the cotton rich lands in the Arkansas Delta region. Memphis's proximity was enhanced by the eastern portion of the Memphis and Little Rock Railroad that crossed Crittenden and St. Francis counties from Hopefield (opposite Memphis) to Madison in St. Francis County.
Accessible through Memphis's railroads, these counties in Arkansas along the Mississippi River pulled African American laborers from all over the Upper South's Freedmen's Bureau offices because of a combination of factors. Lands known to be very fertile and suitable for cotton had been extensively abandoned during the war. There were large reductions in the number of African American laborers available because of economic dislocation, migration, and death, compared to the antebellum plantation period (though many ex-slaves in remote areas remained on their plantations). During the war, the abandonment of rich cotton lands, the early transfer of control to Union forces, and the promise of fertile soil attracted northern planter entrepreneurs, often ex-Union Army men, looking to make money in cotton and perhaps demonstrate the superiority of free labor. After the war, a mix of business-minded opportunists and idealists, including even some ex-Confederate officers, attempted to reopen these plantations. But they had to have enough farm labor on the land to do the work, and the Freedmen's Bureau offices across the Upper South participated in assembling labor contracts to serve these plantations.
Transportation across much of the Upper South, especially in Tennessee, was restored relatively quickly. The US Military Railroads spent millions of dollars in labor and material at the end of the Civil War to rebuild destroyed tracks and repair bridges in Tennessee. Then in 1865, the US Military Railroads turned over the repaired facilities to southern railroad companies. Far from impassable, the railroad network from these bureau offices functioned at reliable levels as early as the summer and fall of 1865. Much of the network was operational across the South by early 1866 (Thomas Reference Thomas2011: 183–86).
Nearly all long-distance labor contracts issued by the Freedmen's Bureau included a transportation voucher supplied either by the bureau or the employer. Labor contracts took several different forms, but nearly all specified arrangements for transportation. As an example, the Freedmen's Bureau office in Lexington, Kentucky, organized a contract for Sam Sanders, Cora Beall, Laura Johnson, Susan Smith, Sally Hedge, and Mary Johnson to work for Van Fossen & Co. “on a cotton farm, twelve (12) miles above Lake Providence in Louisiana” (Bureau of Refugees, Freedmen, and Abandoned Lands, M999, M1902, M1904, M1911, M1913). The contract stipulated that if the “parties hiring themselves desire to return to Kentucky or to go elsewhere, they shall be at liberty to do so when the crop is secured.” Van Fossen paid for all lodging and expenses en route and loaned freedmen “the cost of transportation the amount to be deducted from the year's wages.” In Alexandria, Virginia, the office used printed “Articles of Agreement” specifying the terms of the contract. For local contracts, the employers sent a wagon or paid for transportation by stagecoach. Otherwise, transportation was by rail or steamship (ibid.).
Moreover, the Alexandria office printed a circular designed to encourage long-distance contracts and requested that it be read in churches and Sunday schools. The bureau announced in March 1866 that there were “more men, women and children in this city than can find lucrative employment” and that “good homes and high wages ($15 per month for men and from $5 to $6 for women) can be had by calling at this office and making contracts to go to Mississippi and Arkansas to work for northern men who will make and provide homes for the whole family and will give the children a chance to get a good education” (ibid.).
Not all migration through these bureau offices was tied to a labor contract. Because the bureau issued transportation vouchers for anyone qualifying as “indigent,” requests came from employers and freedpeople alike. To gain a voucher, freedpeople had to show that they had some viable means of support at their ultimate destination. The Alexandria office transported the Dade family to Lancaster, Ohio, without an accompanying labor contract with the assurance that they had the skills to find work upon their arrival. Other freedmen used the Alexandria office to gain transportation into Ohio. In a typical request, the superintendent of the Alexandria office wrote his superior officer, “I have the honor to request that transportation may be furnished Sylvia Fields, Freedwoman, from Alexandria Va to Chicago Ill. She is old and infirm and dependent on the Bureau here for support. She has a son in Chicago who will support her if she can be given the transportation asked for” (ibid.).
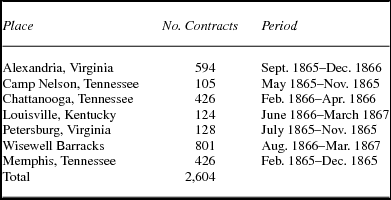
Based on a detailed database of every labor contract from these sites (table 1), we find different patterns of work placement over time and across space for the “first wave” of African American mobility after emancipation.Footnote 11
Freedmen's Bureau offices

Note: The Freedmen's Bureau labor contracts for each office are organized by state and office and are available on microfilm. For finding aids, see National Archives and Records Administration, www.archives.gov/research/african-americans/freedmens-bureau. For the data used in this study, see Bureau of Refugees, Freedmen, and Abandoned Lands M999, M1902, M1904, M1911, M1913.
The prospects for employment outside of the South depended on the Freedmen's Bureau office and the pool of employers who solicited the office. Perhaps not surprisingly, the Washington, D.C., offices saw a greater variety of northern opportunities. Most of these freedpeople traveled up the Atlantic coast by rail to Pennsylvania, New Jersey, New York, and the states in New England. By contrast, there were relatively few freedmen hired into Ohio, Indiana, and the Midwest from the western offices in Chattanooga, Louisville, or Memphis, despite their proximity to these northern states. Instead, these offices, some of the least well-networked rail hubs in the South, offered contracts more locally circumscribed or directed into the Deep South.
For workers being hired in large numbers to locations in the Deep South, the transportation costs were substantial. Between November 1866 and February 1867, the Freedmen's Bureau transported 687 freedpeople on the Georgia Railroad with vouchers that cost $2,308 at roughly two cents per passenger mile. Several of the vouchers were for very large groups, including 90 freedpeople traveling from Washington, D.C., to Atlanta, 105 freedpeople from Charlotte to Columbia, and 154 freedpeople from Augusta to Atlanta. The latter voucher totaled $526.68.Footnote 12
The incomplete and partial records of the bureau's railroad transportation vouchers indicate that the volume and the timing of freedpeople's mobility varied considerably across the South. The Virginia Central Railroad between March and July 1867 transported just 45 freedpeople 2,582 passenger miles. The longest journey was 136 miles from Richmond to Staunton, Virginia. Similarly, the Orange and Alexandria Railroad took freedpeople from Washington, D.C., 178 miles to Lynchburg, Virginia, but otherwise most of its vouchers were for much shorter distances. By contrast, at the height of the contract season around January 1, 1867, the Georgia Railroad transported 687 freedpeople 121,079 passenger miles.
These records also indicate that the Freedmen's Bureau often arranged transportation by rail or steamboat even for short distances. In Memphis, as in Virginia, the bureau issued rail passes for quite local movement within Arkansas in the Little Rock area, presumably on the western third of the Memphis and Little Rock Railroad (the central portion was not completed until 1871). Rather than transportation by foot or mule, freedpeople often traveled by steam if the contract took them out of their immediate county.
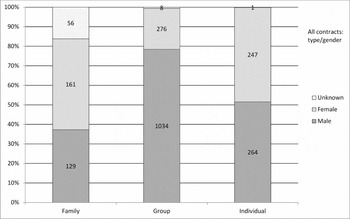
Many freedmen and women took out labor contracts in groups, defined here as five or more individuals who were not clearly part of a family. The average age of all labor contracted from the Upper South Freedmen's Bureau offices was 22 years old; the average pay per month was approximately $12.00. Contracts for farmers often specified that the planter would provide quarters, “healthy rations,” fuel, and “all necessary attendants and supplies in case of sickness.” Contracts usually withheld 25 percent of each month's wages until the end of the year. Laborers, however, contracted either by the month or the day, sometimes for as much as $1.25 per day for periods of two to nine months. They were provided quarters but not rations. In many cases, groups comprising dozens of men, women, and children were contracted to a single employer. In a few instances, the Washington, D.C., bureau negotiated group contracts for as many as 200 farm laborers, and these too included men, women, and children.
Not surprisingly, men constituted the largest proportion of group laborers (figure 1). Men and women, however, were equally likely to sign an individual labor contract at a Freedmen's Bureau office. The average distance between these bureau offices and the work destination was 340 miles. The longest distance was 1,465 miles.
Proportion of family, group, and individual Freedmen's Bureau Labor contracts by gender.

Each bureau office orchestrated labor contracts independently and in widely varying contexts. Alexandria, Virginia, possessed ample railroad connections to the North, but issued its labor contracts almost exclusively for large groups to work in Arkansas, Mississippi, and Tennessee. The dominant pattern out of Alexandria was for contracts to the cotton frontier. Of the Upper South Freedmen's Bureau offices, Alexandria issued contracts placing workers the greatest distance away, with destinations more than 950 miles away on average, and these were organized by just a handful of employers. Geoff Van Beek and Co., in Phillips County, Arkansas, hired dozens of men out of Alexandria to work as “field hands.”
Alexandria became an important funnel point in the war, where thousands of African Americans looked for work with the US Army Quartermaster's office, the US Military Railroads, the hospitals, and the businesses serving the war operations. The quartermaster employed more than 1,500 freedmen in Alexandria, and the railroads at least another 1,500, while dockworkers, draymen, and hostlers numbered in the hundreds. Thousands of free blacks had lived in Alexandria before the war erupted, but tens of thousands of African American refugees and freedpeople made their way into the city during the war. When the conflict ended, many of them sought work through the Freedmen's Bureau. The office operated as a conduit for hundreds of freedmen and women who moved out to the cotton frontier.
The movement of long-distance laborers from Alexandria to Arkansas allowed local planters there to bid down and compete with local freedmen who in 1865 had been demanding higher wages (New York Times, July 27, 1865). Similar contracts in 1867 from Wisewell Barracks also took men to Arkansas.
The Camp Nelson, Kentucky, Freedmen's Bureau office, by contrast, placed families, groups, and individuals in contracts nearly all within 200 miles of Lexington, most of them in Kentucky. These proximate moves were not intensively local, however, as dozens of men and women spread across seven counties.
In Petersburg, Virginia, a different pattern unfolded. A large portion of freedmen took labor contracts locally, while a significant minority moved northward to Maryland and Baltimore. This migration may have been related to particular employers who were looking for comparable skills available in Petersburg's tobacco factories, railroad shops, or plantations, but the skills and job categories varied widely. Farm hands, house servants, laborers, wood cutters, cooks, nurses, housekeepers, washerwomen, and waiters all found employment through Petersburg.
In the bureau office at Wisewell Barracks in Washington, D.C., dozens of freedmen and women signed contracts for work in the North. Indeed, out of the bureau offices studied, Wisewell produced the greatest spatial distribution of worker contracts. During two years of its operations, Wisewell served as a gateway for African Americans moving through the Freedmen's Bureau to Ohio, Pennsylvania, and the North. These individuals also entered the widest array of occupations, including farmer, domestic, gardener, groom, shoemaker, waitress, barber, waiter, mechanic, coachmen, cotton hand, tobacco worker, and woodcutter. A large group contract took some freedmen to Arkansas, but most individuals were contracted for work across the North—in Glastonbury, Hartford, South Windsor, and surrounding towns in Connecticut, as well as towns in Massachusetts, New Jersey, and New York. The D.C. office, moreover, was the only gateway to the far west. On November 29, 1866, Mary Jane Paine, aged 44, signed a contract in Washington, D.C., to work for D. J. McCunn as a domestic in Nebraska City, Nebraska. And in January 1867, Charles Brown, aged 25, went to work for Lt. Spencer of the US Army in Omaha Territory, Nebraska.
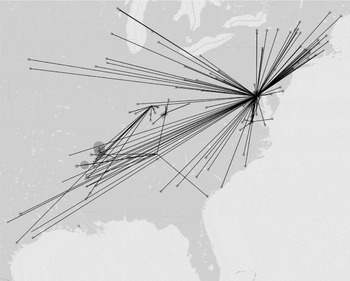
Taken as a whole, the labor contracts issued from these bureau offices in the Upper South sent the largest proportion of freedmen and women into the interior and Deep South (figure 2). Only Wisewell Barracks served as a conduit for Northern Freedmen's Aid Societies to organize and orchestrate the placement of workers in the North. Indeed, leading Republicans applied to hire freedmen from Wisewell. Abolitionist Samuel C. Fessenden applied for a cook to work for him in Stamford, Connecticut. And Miss Eliza Hancock, daughter of General Winfield Scott Hancock, sought a freed family to serve her at the East Capital Street Barracks and travel with her to Philadelphia (Bureau M1902: 18).
The Freedmen's Bureau offices in the Upper South. Over 2,600 contracts are shown here indicating their point of origin and destination. An interactive map accompanies this article and features a dynamic presentation of these data that shows each individual contract and office's activity over time and across space on a day-by-day basis. The data may also be queried and downloaded. See http://railroads.unl.edu/mobility-after-emancipation.

Solicitous requests from potential employers poured into the Freedmen's Bureau offices in Washington, D.C., from all corners of the North and the South. The local probate judge in Toledo, Ohio, wrote the officers at Wisewell Barracks that he wanted free “men and women of color” to work on his farm. “I want honest steady reliable men + women and I will do well by them,” he explained, “they shall have the same wages I pay other hands.” A judge from West Chester, Pennsylvania, requested house servants and cooks who have “the reputation of being neat + trustworthy.” One Ohio farmer wanted “a good intelligent mulatto boy not less than 18 or 19 years old, one that will be a good farm hand, one that can milk preferred.” Most of all, he wanted one with “good moral habits.” He would pay $10 per month or more and send him to school and “furnish his books,” as well provide room and board (ibid.).
In this way, the bureau acted as a labor broker, advertising its supply of freed laborers in newspapers, matching employers and employees, and moving freedpeople wherever there was demand. As we can see, however, requests for labor and the contracts that followed often came with implied expectations about morality and behavior, setting up potential conflicts over terms and expectations.
Indeed, bureau officers, employers, and freedpeople had different, sometimes competing, ideas about the obligations and inherent expectations in these contracts. Freedpeople preferred to work for strangers rather than their former masters. Bureau officers reported in some parts of the South that the demand for labor exceeded the supply and “the freedmen show preference for northern men” (Executive Documents of the House 1866: 253, 299). In Alabama, for example, there were more than 5,000 northern men setting up farms looking for freedmen labor. To the extent possible, freedpeople used the bureau to make choices about who they would work for and under what conditions. One striking pattern seems clear from the aggregate data: Of the contracts with explanatory comments, only 5 percent of them indicated that these individuals were going to work for their “former owner” or former “master.” An equal number were going to “join” their husband or family. Combining personal mobility and decisive clarity, freedpeople used the bureau to the extent that they could as a blunt but effective instrument to help them define the terms of their freedom.
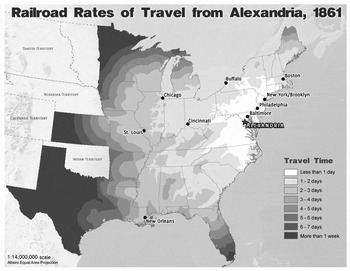
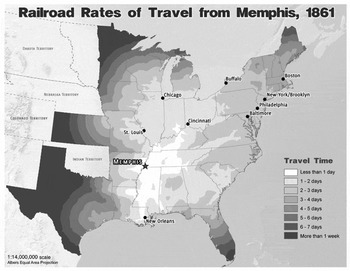
A critical factor in African American mobility through the Freedmen's Bureau offices may have been the relative rates of travel from each place for anyone originating there. Alexandria, Virginia, proved remarkably networked both to the major population centers in the North and, as significant, to the cotton frontier South (figure 3). Alexandria's proximity to Arkansas by rail, for example, was little different from Nashville's or Memphis's: 2–3 days. However, the latter places were a day's travel less proximate to Northern states.
Rates of travel from Alexandria, Virginia. To assess the relative position of each Freedmen's Bureau office, we calculated the travel time to all points on the railroad network from each place. Assuming an average speed of 25 miles per hour along railroad lines, travel times were calculated from an origin city to all train depots in the United States in 1861. Then, all known cities were connected to their nearest train depot and, assuming an average speed of three miles per hour for other land transportation, travel times were estimated between all towns and their closest train stations. Travel times from origin to station were added to the travel times from towns to their nearest train depots to generate overall travel times for all cities and towns in 1861, from each origin point. Finally, an inverse distance weighted regression calculation was used to interpolate travel time estimates for all areas. For more on this method see Thomas et al. (2016).

The Memphis office of the Freedmen's Bureau also sent laborers to Arkansas, but these went to plantations just 38 miles upriver and to one main employer, Dr. F. G. McGavock. One of the most prominent men in the county, an ex-Confederate, McGavock allegedly brought in Irish immigrant women from Castle Garden, New York, during the Civil War to plant cotton and work the fields because black labor was so scarce. Years after the war, he tried Chinese labor. But in its immediate aftermath, McGavock used the Freedmen's Bureau to obtain black labor in large numbers (Presley Reference Presley1889: 528–29).
In Memphis and several other Freedmen's Bureau offices, labor brokers gained special inside access and served as middlemen between the bureaucracy and the cotton plantations. These agents were accused of malfeasance and misrepresentation. One affidavit from Phillips County, Arkansas, showed the extent of the collusion at work through the bureau: “I contracted to work for C. A. Norton (at Alex Va) who represented himself as a proprietor of a Plantation in Arkansas. I was then brought to Laconia Landing Ark and put to work on a Plantation which proves to be owned by a man by the name of Geo T. Fournoy. Norton left there the next day and I have not seen him since.” The conditions, he testified, were similar to slavery: no medical care, overcrowded housing, and sickness and disease. When the men tried to leave, they were tracked and hunted down with dogs, and forced to return to work (Hayden et al. Reference Hayden, Kaye, Masur, Miller, O'Donovan, Rowland and West2013: 825).
In 1866, the army investigated the Freedmen's Bureau, an inquiry commissioned by President Andrew Johnson and designed to discredit the bureau. General James B. Steedman and General J. S. Fullerton concluded that freedmen in Mississippi and Arkansas “were compelled, by orders from officers of the Bureau, to enter into contracts within limited periods, which enabled all who wanted hands to get them at low wages” (Steedman and Fullerton Reference Steedman and Fullerton1866: 1). The Steedman-Fullerton investigation suggested that the bureau was an “unnecessary and offensive interference” in the labor arrangements of the South, artificially and at times fraudulently holding down wages, engendering animosity between employees and employers, and enabling collusion and corruption on the part of planters and bureau officers (Hayden et al. Reference Hayden, Kaye, Masur, Miller, O'Donovan, Rowland and West2013: 22–24).
Undeterred by these criticisms, the freedmen continued to support the bureau and to use it to make claims against unfair practices. But clearly not all bureau agents had their best interests in mind. In January 1867, at the end of the 1866 contract year, complaints from Arkansas reached the Freedmen's Bureau office in Alexandria, Virginia. The freedmen demanded unpaid wages due them from Geoff Van Beek & Co. The bureau officials’ responses, however, were defensive and dismissive. The Helena, Arkansas, bureau officer wrote to his superior in Little Rock that the Van Beek firm was “composed of three northern gentlemen, two of whom had been officers in the Union Army.” He then argued that the freedmen hired from Alexandria in 1866 were “the worst set of hands among those they brought from Alexandria.” Arkansas officials accused the Alexandria freedmen of “drinking to excess every chance they could get” and implied that their idleness had caused the Van Beek firm to fail. There was no way for the freedmen to collect back wages because Van Beek had “dissolved and the parties left here last month for the North totally broken up having lost some $15,000” (ibid.: 866–69).
In other ways, the bureau orchestrated labor contracts with an eye toward supplying cheap labor for plantations. The vast majority of labor contracts out of Memphis were local and agricultural, so much so that the preprinted form used in this office presupposed a “plantation” placement. In addition, the Memphis records contained the only concentration of sharecropping contracts out of these Upper South offices, most of them in nearby Shelby County. Unlike other offices, where at least a few contracts were signed for distant places, the farthest destination from Memphis was to Tippah County, Mississippi, only 92 miles away (figure 4).
Rates of travel from Memphis, Tennessee.

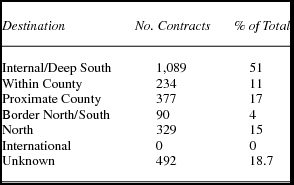
Overall, Freedmen's Bureau offices in the Upper South drew up contracts for groups, families, and individuals, and they sent freedmen and women to work at sites near and far (table 2). Most contracts sent laborers into the interior or Deep South from these border states. Moreover, 91 percent of the contracts to the Deep South, regardless of their point of origin, were group contracts. However, the vast majority of contracts within the county of the bureau office or locally proximate were family or individual-based contracts. For those going to the North, 47 percent were group contracts, while 51 percent were family or individual based.
Known labor contract destinations of freedmen, 1865–67
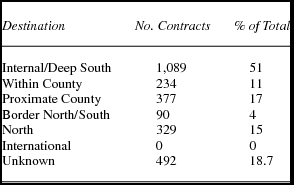
In sum, the movement from the Upper South railroad centers appeared to some contemporaries to have been chaotic and disruptive, but it was purposeful and in some cases highly orchestrated. In the postwar environment, the bureau's senior officers sought to use the contracts as a tool for educating both freedmen and former slaveholders. But they remained oblivious to the effects of the labor mobility inherent in the contracts. They idealized face-to-face negotiation and the drama of both parties’ coming to terms with free labor. Bureau officers did not recognize, or even document very well, the highly variable, spatially contingent nature of the contracts their offices orchestrated. Contracts took freedpeople into the interior of the South rather than out of the South or to the North. If freedmen stayed close to home, they were part of a nuclear family or on their own. Although many of these bureau offices were positioned on railroad lines with proximity to the North, just 15 percent of the contracts carried freedmen across the border. Instead, except for Wisewell Barracks, the bureau contracts from the Upper South redistributed the large numbers of freedpeople into the interior and Deep South.
African American Mobility to the North: Ohio
The movements across and out of the South indicate that African Americans faced significant limitations in certain industries and places, especially in northern industrial labor markets. African Americans were virtually shut out of the railroad industry in large parts of the North. Skilled black railroad workers in Petersburg or Alexandria, Virginia, would find no employment northward in the shop trades or as trainmen. Although African Americans made up nearly 50 percent of the railroad workers in Virginia in 1880, in Ohio, by contrast, more than 91 percent of railroad workers were white. Pennsylvania and Maryland railroads were equally discriminatory.Footnote 13
Nevertheless, between 1860 and 1870, the black population in Ohio nearly doubled, jumping from 36,000 to 63,000. In the cluster of counties around Dayton and Springfield, Ohio, the black population tripled. More than half of the black residents in Ohio were born in the South, most of them in Virginia and Kentucky. Some fled slavery either before or during the war. Others left immediately after emancipation to move north. In 1862, the Democratic critics of the war won many Ohio voters to their party with alarmist cries of a black invasion from the South. In response to these widespread fears, the Ohio House of Representatives conducted a detailed census in 1863 counting every black resident in the state to determine his or her birthplace (Adams Reference Adams2003; Gerber Reference Gerber1976: 52–62; Jackson Reference Jackson1980).
We hypothesized that African American mobility out of Virginia might move along recently developed rail lines into Ohio, using the Baltimore and Ohio Railroad. Although the Freedmen's Bureau labor contracts demonstrated little migration into Ohio from any of the Upper South railroad centers, African Americans moved on their own. Some freedpeople received transportation vouchers through the Alexandria Freedmen's Bureau office, while others struck independent deals with labor brokers and through informal channels with employers. Based on the aggregate census data, it appears likely that thousands of blacks left the Upper South and moved to northwestern Ohio, but we have few ways to document this movement because only aggregate data are available for the 1870 census. Using the individual-level digital data from the 1880 census, however, we have reconstructed the age cohorts of Ohio in ways that clearly document substantial migration.
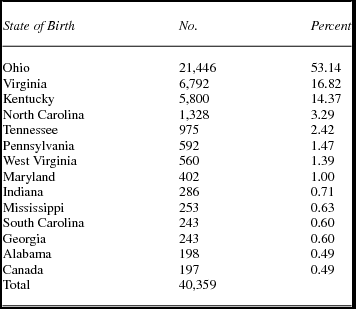
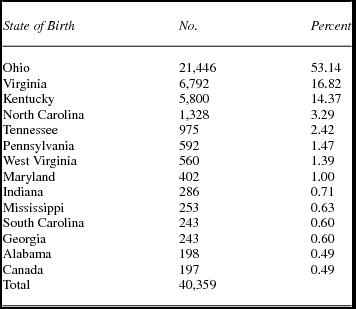
According to the 1880 counts, there were 40,359 male “negroes and mulattos” resident in Ohio at that date. The figures in table 3 show the numbers and percentages of these African Americans originating from states/countries that contributed approximately 200 or more individuals, in terms of place of birth. Below this cut-off point, the counts from individual states fall off rapidly to very low or negligible numbers. While a slight majority was born in Ohio, the first striking observation is that the two states of Virginia and Kentucky contributed more than 30 percent of the relevant population, significantly more than all other source states combined. The situation for females was very similar to that of the males.
States and country birthplaces of Ohio male African Americans in 1880
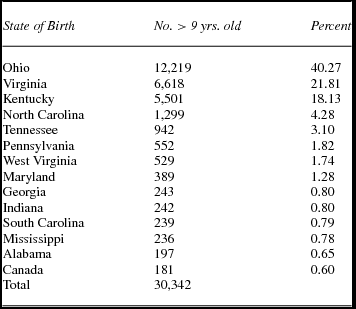
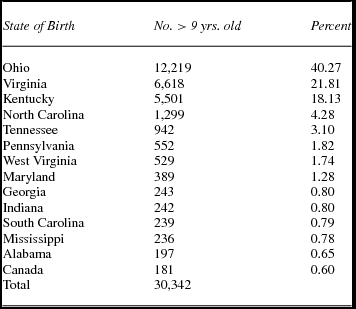
Almost exactly three-quarters of the male African American population (30,342 individuals) were more than 10 years old in 1880 (see table 4). While the overall pattern of states of origin is generally similar to that of African Americans in Ohio as a whole, there are two points worthy of note. The first is that the percentage contribution from persons born within the state is significantly lower and that of Virginia and Kentucky correspondingly higher, indicating that the rate of natural increase of the incoming population group has already had numerically important results by 1880. Second, hardly any of the in-migrants from the distant southern states were less than 10 years old, indicating at a minimum that young children had not been part of this migration stream during the 1870s, though they could have been in the period 1865–70. Judging from the Freedmen's Bureau labor contracts, a more likely corollary might be that the migrants were mainly young men of an age where they could be expected to leave home and support themselves.
States and country birthplaces of Ohio male African Americans more than 10 years old in 1880
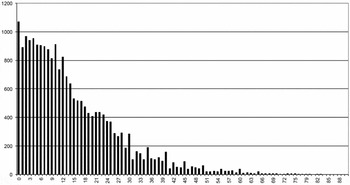
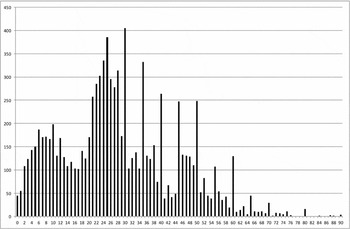
The benefits of our individual-level data for 1880 become apparent when we examine the postemancipation generation of children (see figure 5). This clearly shows the postemancipation generation of children and young people under the age of 16 starting to make their demographic presence felt. A second group, aged 16–30, grew up in antebellum Ohio or during the Civil War years, the sons of free men and women or escaped slaves. Long-standing male Ohio-born African American residents older than 30 years of age are, however, very in limited in number.
Age distribution of male African Americans born in Ohio, 1880.

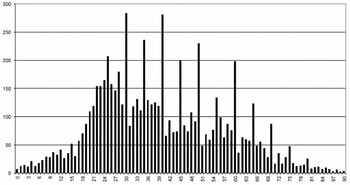
Like the migrants from the distant Southern states, of the African Americans in Ohio in 1880 who were born in Virginia, very few were young children (see figure 6). As might be expected, the in-migrants are concentrated in the young adult age range, that is, 18–30. A comparison with the equivalent data for Kentucky (not shown) indicates that the peak in this age group is significantly more pronounced than in the Virginia case. This means that some individuals at the lower end of the age range could have been young children if they migrated just after the Civil War in 1865–67. While the number of in-migrants in their thirties is broadly comparable between the two states, in the later age decades the numbers from Virginia are approximately double those from Kentucky.
Age distribution of Ohio male African Americans born in Virginia, 1880.

We argue that this implies quite clearly that the in-migrants from Virginia involve family groups covering multiple generations, because many of these individuals were too old to have the search for employment opportunities as a primary motivation for migration. In contrast, the Kentucky data strongly suggest that the latter was indeed the motivation for many of these migrants, as their age distribution is concentrated in the years when individuals have the greatest propensity to migrate under normal circumstances. Interestingly, most African Americans over the age of 40 who were living in Ohio in 1880 were born outside the state.
The first wave of migrants across and out of the South demonstrated the possibilities of migration. A cohort of Virginia-born African American families moved to parts of Ohio in the period 1865–67, possibly in concert with or through the Wisewell Barracks and the Alexandria Freedmen's Bureau. When we cross-reference these aggregated data with the Freedmen's Bureau data, we see exactly the pattern described in the preceding text. In Melvin, Ohio, Richard Batty contracted through the Wisewell Freedmen's Bureau office to hire Joseph Whitney, aged 45, and Matilda Diggs, aged 30, Jacob Diggs, aged 25, Priscilla Diggs, aged 20, Joshua Diggs, aged 17, Charles Diggs, aged 16, and Mary Diggs, aged 8. In Bucyrus, Ohio, Mrs. J. Monett hired Clem and Mary Johnson, aged 27 and 23, respectively, and Jarvis and Mary Collins, aged 26 and 18, respectively. All told, 15 individuals took labor contracts into Ohio from the Freedmen's Bureau offices studied here, each of the appropriate age cohort.
The freedpeople moving to Ohio in the immediate aftermath of the war, we conclude, whether in the limited numbers through the Freedmen's Bureau or in larger numbers outside of those offices, constituted a visible and significant family-based migration where young men and women sought viable employment outside of the South.
African American Mobility to the Southwest: Arkansas
At first sight, it may appear unexpected or even deeply ironic that many of the Freedmen's Bureau contracts arranged both at Alexandria and Wisewell Barracks were destined for plantation counties in Arkansas bordering the Mississippi River. In 1859, this same state had passed legislation to re-enslave all free Negroes if they did not leave the state by the beginning of 1860. As a result, large numbers had departed by riverboat just before the end of 1859 for destinations such as Cincinnati and Seymour, Iowa (Cleveland Morning Leader 1860; Lancaster Intelligencer Reference Intelligencer1860). These initial departures were followed in the early years of the war by slaveholders who abandoned their plantations in the rich cotton lands of the Arkansas Delta and took their slaves with them to Texas. When Union forces took control of the northern and eastern parts of the state in 1862–63, large numbers of freed slaves deserted their former plantations for the comparative safety of refugee camps and “home farms,” which were near military outposts, such as Helena, in Phillips County (Boulton Reference Boulton2006: 74; Eaton Reference Eaton1865: 8–9). The minority who remained in place were decimated by disease or want, and lived in daily fear of the depredations of Confederate raiding parties, especially in outlying districts far from the Union strongholds.
While the collapse of cotton production dealt a blow to the Confederate treasury, it also deprived the Union of tax revenues and much-needed raw material for military clothing manufacture. Furthermore, the burgeoning growth of refugee camps placed substantial logistical and financial demands on the federal government to feed and clothe the freedmen and their families (Mellen Reference Mellen1864: 5). To relieve these pressures, which fell directly on the military authorities, procedures were swiftly established to enable loyal citizens, including both civilians from the North and former Union soldiers, to lease abandoned plantations and employ freedmen and their families at specified monthly wages in areas where the army could provide the necessary protection. Provision was also made for freedmen to occupy small tracts of land and work them on their own account (Randall Reference Randall1913).
Despite the destruction wrought by Army Worm in September 1864, and the resulting loss of four-fifths of the limited cotton crop, the leasing system still produced enough of the staple for working plantations or smallholders to cover costs and, in some cases, earn a small profit.Footnote 14 In March 1865, by Act of Congress, control of the lands formerly in the hands of the military or Treasury agents was handed over to the Freedmen's Bureau. The latter agency largely continued the leasing system as a source of revenue, despite the military's contention that it gave preferential treatment to “large capitalists” (Eaton Reference Eaton1865: 6, 73; Randall Reference Randall1913).
At the same time on the other side of the South, in Alexandria, Virginia, northern occupation resulted in an increasingly experimental attempt by US Treasury and War Department officials to seize properties and convert them to free labor. The first efforts at this policy unfolded on the railroads and developed around what eventually became the US Military Railroads. But Alexandria's federal officials also confiscated large numbers of homes and farms and harbored an especially aggressive interpretation of the Confiscation Acts. Unimpeded by local resistance for the entire war, and occupied by ideology-minded federal officials, Alexandria acted as the vanguard of free labor policies to transform the South. By 1865, as we have seen already, Alexandria's Freedmen's Bureau had become the conduit for free labor contracting to northern-run plantations in cotton producing Arkansas (Thomas et al. Reference Thomas, Nash and Shepard2016).
It was into this highly unsettled, if not chaotic, environment that groups of more than 670 freedmen were sent, sometimes accompanied by their families, both from the Alexandria and D.C. offices and from offices in adjoining states such as Tennessee. The Alexandria office managed a transportation request for 50 men, 50 women, and 20 children to be sent from Alexandria to Helena, Arkansas, one of the largest group voucher requests it processed. The proportion of labor contracts to Arkansas from the Upper South was indeed substantial, accounting for nearly a quarter of all the contracts issued in this period. No other destination state was as significant.
As with other groups and destinations, however, questions arise as to whether these movements were short or long term, whether they mirrored wider patterns of migration or the quest for family reunification, or whether they were dwarfed by other factors arising from wartime or immediate postwar circumstances. One of these specific circumstances was the concentration, for safety reasons, of newly emancipated rural slaves in the garrison towns of Little Rock, Pine Bluff, and Helena. Another was the return to their old plantations of former slaves who had been removed from the sphere of Union influence during the war.
While individual movements are impossible to track in large numbers, census data offer a means of charting some of the resulting net migration effects in the aggregate. For example, the “colored” (negro and mulatto) population of Little Rock rose fivefold to 5,274 individuals between 1860 and 1870 and from 22.9 percent in 1860 to 42.6 percent of a much larger overall city population by the later date. The equivalent figures for Helena indicate a doubling of numbers to 1,109 individuals, while the proportion of the growing total town population increased from 34 percent to 49.3 percent (US Bureau of the Census 1872: 87, table III). In contrast, the colored population in Planters Township, a rural plantation area in Phillips County, only increased from 885 to 936 during the decade in question.Footnote 15
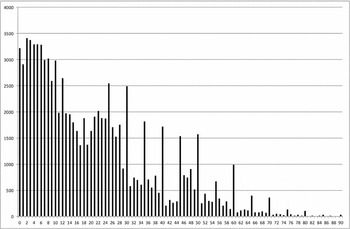
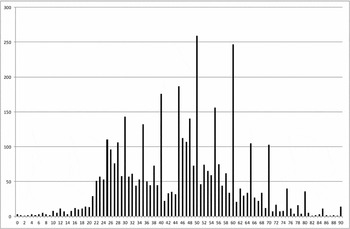
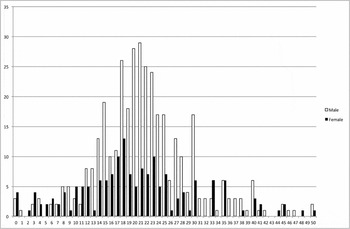
The effects of the free labor migration into Arkansas were substantial and persistent. There were noticeably fewer negro males older than 30 years in 1880 than might have been expected, but a large concentration of children, either born in the state or part of incoming family groups (figures 7–9). A secondary subpeak in the 20–28 age range is indicative of the group with the greatest propensity for migration. However, further disaggregation of the data by state of birth reveals quite different patterns among subsets of the population. In the case of colored males living in Arkansas but born in Virginia, hardly any (figure 8) were under the age of 20, implying a minimal net migration of family groups since the war. Subpeaks of those in their twenties and late forties/early fifties probably reflected recent plantation migrant workers and either returning former slaves or freedmen who remained in the state during the war, having been brought there originally from Virginia in the antebellum period. For those born in Tennessee (figure 9), the picture is different again because there were significant numbers of children born in the latter state in the 1870s who were in Arkansas by 1880, but still not of normal working age. As with the Virginia born, there is a peak group in the twenties, and a number in the thirties age group, many, no doubt, parents of the children just mentioned. The older age groups are proportionately less well represented than for the Virginia born. Overall, these patterns suggest significant migration, both of young adults and young families southwestward from Tennessee and Virginia into Arkansas in the immediate postwar years.
Age distribution of Arkansas male African Americans, 1880.

Age distribution of Arkansas male African Americans born in Virginia, 1880.

Age distribution of Arkansas male African Americans born in Tennessee, 1880.

One further aspect of the age frequencies shown in figure 9 is the relative dearth of older teenage males in the 15–19 range, who would have been born during the war. The same pattern is observed for females. Several factors may have contributed to this, including reductions in birth rates resulting from the general social upheaval of the period or protracted absences of freedmen who had joined the Union Army, higher rates of infant mortality, and possibly some recent out-migration.
It is valuable to compare this statewide picture in 1880 with the age distributions of individuals sent to Arkansas by the Freedmen's Bureau in 1865–87 (figure 10). While not all the relevant records in the labor contract data set have ages present, these are available for 170 of the 179 females and 374 of the 475 males. With nearly three times as many males as females dispatched to the state, the differences in the age distributions are also noteworthy. Males are mainly concentrated in the 18–25 age range, yet a relatively higher proportion of females are in the 15–19 group. There are a small number of families with children, though some groups may have included otherwise unaccompanied young orphans.
Freedmen's Bureau labor contracts to Arkansas, 1865–57, from selected upper South offices, age and sex distribution.

In sum, very few people older than 40 moved to Arkansas under the auspices of the bureau. While the rationale for sending able-bodied farm hands to the plantations is clear, it is interesting to speculate whether there was an additional, if largely unspoken motivation to sending potentially marriageable young women into situations in which there may have been a significant gender imbalance immediately after the war.
Indeed, the Freedmen's Bureau labor contract data confirm many of these patterns. Strikingly, only two places in the South stood out as locations where women were sent to do agricultural labor in higher proportions than elsewhere: Mississippi County, Arkansas, and Shelby County, Tennessee. In the former, one employer hired all the women out of the Memphis office. In the latter, dozens of employers hired women for agricultural work out of Memphis. The average age of these women was 19 years old. As previously mentioned, large numbers of somewhat older men were contracted for agricultural work in Arkansas from the bureau offices in Alexandria, Virginia, and Washington, D.C.Footnote 16
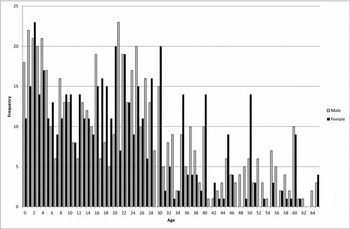
Although the numbers involved are not large, the following analysis of Planters Township in Phillips County, Arkansas, in 1870 lends some credence to the finding of gendered mobility in a broader context. Figure 11 shows the resulting age frequencies for both males and females, although the picture is somewhat complicated by the greater tendency for female ages to be concentrated on the expected five-yearly intervals, especially in the older generations. Using five-year age bands to minimize these effects reveals that significant male-female differences were confined to the 15–19, 40–44, and 55–59 age ranges. The greatest disparity was in the first of these bands, which has 57 females to 37 males, but in the older bands, the position was reversed to give an “excess” of males. Almost all these individuals were farm laborers.
Planter's Township, Phillips County, Arkansas, 1870 African American male and female age distribution.

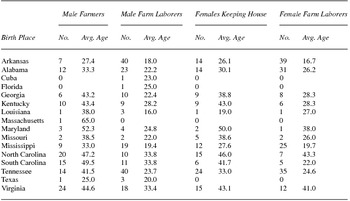
Taking a broader view across the age spectrum, the social hierarchy was very simple: Males were either farmers or farm laborers, while females were either responsible for “keeping house,” mainly as wives, or were farm laborers. Comparing the birthplaces of the younger than and older than 30 groups (15–29 and 30–69) reveals several important differences. For the males, young farmers had been born in states across the Old and New South, but rarely came from Tennessee or Virginia. In contrast, older farmers were predominantly natives of the latter two states or the Carolinas. A similar picture emerges for older farm laborers, though these were few. The main birthplaces of younger farm laborers were Arkansas and Tennessee, with significant representation from Alabama, Mississippi, and Virginia. For the women, the younger farm laborers came from the same states as their male counterparts, except for Virginia, while the older group came largely from Alabama, North Carolina, Tennessee, and Virginia. Young housewives/housekeepers were mainly local or from Tennessee and Mississippi, whereas the older group were largely from Tennessee, Virginia, and North Carolina.Footnote 17
A noticeable feature of family composition, apparent from the manuscript schedules, is that many farmers were substantially older than their wives. This finding only partially emerges from the overall average ages of 42.2 and 36.1 years for the two occupational groups of “farmer” and “keeping house,” though the latter does not imply a marriage relationship within the household, in every case.
With a much more detailed breakdown of birthplaces and average ages by occupational grouping, a broad picture emerges where individuals born in states more distant from Arkansas tend to be older than those born in more proximal states or in Arkansas (table 5). Despite the differing average age levels, this finding is reasonably consistent between occupational groupings.
Birthplaces and average ages of specified occupational groupings of the colored population of Planters Township, Phillips County, Arkansas. Calculated from the 1870 Census schedules.

In conclusion, the population structure of Arkansas in the immediate postbellum period reflected a complex mix of processes, including the adverse effects of the war and multiple streams of in-, out-, and return migration to and from other parts of the Old and New South. The relative dearth of individuals in the 15–19 age range in the 1880 census at state level is mirrored at a much more local scale in the lack of children in the 5–9 range in Planters Township a decade earlier. However, in 1870 there is also a marked shortage of 15- to 19-year-olds, born well before the war, leaving a noticeable gap in the younger rural work force. This shortfall would have started to become apparent during the period of the Freedmen's Bureau operation, though there is evidence of planters crying out for labor even before the end of hostilities (Eaton Reference Eaton1865: 66). The age distribution of freedmen and women sent to Arkansas shows a response to this need for plantation labor, heavily concentrated in the 15–30 age range, and the type of required labor is confirmed by the bureau records. That said, the numbers of workers dispatched by the bureau to Arkansas appear to have been relatively limited, compared to the overall numbers of plantation hands in the state as a whole. Incoming workers would certainly have made a valuable contribution if concentrated in specific townships, but at the county and state level, this would have been less easy to discern among migration flows unrelated to the bureau's activities.
Conclusion
In the immediate aftermath of the war, a first wave of African American movement took place, one with profound and enduring effects. The relative immobility of the generations from 1880 to 1910 has largely obscured the earlier surge of mobility and the scope, direction, and purpose of these earlier movements. In his landmark study of the South's transition from slavery to free labor, economic historian Gavin Wright (Reference Wright1986: 76–78, 85, 64–65) emphasized the isolation of the Southern labor market as the decisive factor in the South's distinctive regional development from the Civil War to the New Deal. According to Wright, low wages, low skill industries, limited immigration, minimal educational opportunities, and the dominance of the landed planters after the Civil War, combined to create a self-contained labor market structured primarily around cotton agriculture. Wright considered the Southern labor market “economically immobile,” and he and others have shown a flow of movement from the old low-wage Southeast to the higher-wage Southwest. Furthermore, Wright's analysis noted that when blacks moved in the period after the Civil War, they were two and a half times more likely to move to another Southern state than to the North or the West.
We document in this research the first wave of mobility after emancipation in the period between 1865 and 1867. The patterns established in this period, both through the Freedmen's Bureau offices and independent of them, may have established networks and early leaders who influenced subsequent generations. This research has identified the different spatial patterns of these first migrants and the significance of mobility in the initial aftermath of emancipation. As Wright and others have demonstrated, migrants based subsequent moves on “trust” and “accurate information” through kinship networks.
Although micropatterns like these shaped the experience of counties and towns across the South, they were largely invisible to many Southern whites who dismissed these movements and sought to prevent them. Interviewed in April 1867 by the New York Herald, Robert E. Lee contributed to the fear and misunderstanding of black mobility. Lee emphasized that whites in the South were recovering from the war, crawling slowly but steadily out of poverty, loss, and want. But he elaborated on the nobility of the white struggle by telling a story that was intended to reveal what he was unwilling to say directly. Lee explained that the mother of one student at Washington College had been forced to withdraw her son because she could no longer afford the tuition. In a letter to Lee, she revealed that of “all the negroes they had had, every one had deserted her save one.” Lee explained to the Herald reporter that she lived “on the line of some railroad by which the negroes in its vicinity had nearly all emigrated to other States.” This led Lee to a related idea he hoped to impress upon the Herald’s correspondent. Prefacing his remarks with the caveat that he was “strongly attached” to “the colored population,” Lee pointed out that the freedpeople were congregating along the railroads in the towns and cities and avoiding hard work on the farms of the South (Chicago Tribune 1867).
Lee and others closely observed the independent movement of freedpeople after the war, and the importance of the railroads to the postemancipation lives of former slaves, but they misunderstood their meaning. Grossly misinterpreting the goals, desires, and logic behind the actions of African Americans, Lee and other white southerners hoped and expected that local black labor would remained trapped and under their control.
The patterns described here were visible at the time but not properly understood. For freedmen, the ability to move provided one of the most important measures of emancipation, and the consequences of their actions lasted for generations. Furthermore, freedpeople's movements took shape around the institutions and networks available to them. Treated by the bureau's senior officers as a supply of generic labor to be moved to where it was demanded or as subjects in a grand humanitarian experiment of education and uplift, freedpeople crafted for themselves a narrow window of mobility. Regardless of its impermanence, postemancipation movement was a substantial and influential phenomenon.
The Freedmen's Bureau labor contracts from each office in the Upper South developed distinctive spatial patterns. Of the contracts issued from these offices, the majority moved African Americans from the border South toward the interior South, possibly reversing a migration of African Americans toward the Union Army posts during the war, while a large minority kept labor locally circumscribed. One office, Alexandria, acted to transfer free labor on a large scale into the Deep South; and another, Wisewell Barracks, funneled freedpeople into the North. Between 15 and 20 percent of the contracts took African Americans out of the South into the North.
Of additional significance, in numbers larger than previously realized, African Americans moved out of the South to Ohio in the years between 1865 and 1867. Some of these men and women qualified for transportation vouchers from the Freedmen's Bureau; others signed labor contracts that took them to Ohio. But many others moved on their own volition. Rather than an unemployed and undifferentiated mass trapped in the South and crowding the South's cities, the first wave of freedmen and women took decisive steps in local circumstances to secure their future.