Planning for pediatric mass critical care must be based on a foundation of information about existing resources so that they can be organized effectively in a public health emergency. Unfortunately, national information about existing pediatric emergency and critical care resources is limited.
Children are not miniature adults. They have unique physical, physiological, and emotional needs, and when ill or injured, require specialized care and equipment. Because of these unique needs, there may be more children than expected in mass critical care scenarios. Pediatric needs may predominate in an epidemic involving pregnant or postpartum women, a disaster or epidemic affecting schools or child-related activities, a pathogen that mainly infects children, or if children are intentional targets of terrorism.Reference Bravata, McDonald and Owens1Reference Graham, Shirm, Liggin, Aitken and Dick2Reference Louie, Acosta, Jamieson and Honein3
Evidence demonstrates that access to risk-appropriate care reduces mortality and morbidity.Reference Lasswell, Barfield, Rochat and Blackmon4 However, in spite of the evidence that specialized pediatric services are beneficial,Reference Pollack, Alexander, Clarke, Ruttimann, Tesselaar and Bachulis5Reference Tilford, Simpson, Green, Lensing and Fiser6Reference Osler, Vane, Tepas, Rogers, Shackford and Badger7Reference Densmore, Lim, Oldham and Guice8Reference Petrosyan, Guner, Emami and Ford9 gaps in service locationsReference Hartman, Watson and Linde-Zwirble10Reference Kanter11 still exist and often interfere with use of existing pediatric critical care resources. Effective use of resources across entire regions is essential to maximize pediatric population outcomes. In a major public health emergency, regions defined on the basis of jurisdictional decision-making authority may need to be larger for pediatric than adult services and require more overlap in preparation for mass casualty events.
Our study uses geospatial analyses to describe the current state of pediatric critical care resources and to plan for future regionalization of these resources. It provides a visual and analytic overview of existing hospital resources to serve as the basis for the regionalization of these resources in preparation for disasters.
METHODS
Pediatric hospitals and pediatric and general medical/surgical hospitals with specialized critical care units were targeted for the analysis. The specialized units include pediatric intensive care units (PICU), pediatric cardiac ICUs (PCICU), level I and II trauma and pediatric trauma centers, and general and pediatric burn centers. The term “unit” used in this study is defined as records with quantifiable numbers of “staffed beds” for that subspecialty. According to documentation of the American Hospital Association (AHA) Annual Hospital Survey Database,12 “staffed beds” are beds that are set up for patient care in a dedicated subspecialty care unit; that provide subspecialty expertise and facilities for the support of vital functions; and that use the skill of medical nursing and other staff experienced in the management of these problems.
The lack of standardized information regarding the capabilities of the staff and available technology in any one PICU precluded our ability to evaluate the PICU level of care. Therefore, all PICUs were treated as critical care units in this study, even though some may be very small and offer as little additional care as increased observation for moderately ill children.Reference Lorch, Myers and Carr13
The project was conducted in three main steps: preparation of the geospatial layer of the pediatric population (children aged 0-17 years) using dasymetric mapping methods; preparation of the geospatial layer for each resource zone including the identification, verification, and location of hospital facilities with the target resources; and the proximity analysis of the pediatric population within these zones.
It should be noted that pediatric populations may vary in these scenarios due to the expertise available in any one unit. For example, some PCICUs may serve an older population—beyond the ages defined in this study—if they have a performance record for specific congenital cardiac lesions and have followed up the same patient for years. With the improved life expectancy of some rare childhood conditions, it is possible that a small percentage of adults with these conditions may still use pediatric resources. This may or may not change with health reform and family insurance until age 26 years.14
The traditional methodological approach to a proximity analysis is to use a geographic information system (GIS) overlay function, in which spatial buffers of a defined radius are placed around a point and then superimposed on a distribution map of the pediatric population to determine the number of persons living within these radii. In addition, populations of children not living within these radii can be determined, thus representing unserved populations. By comparing the population living within the radii to the total population, it is possible to estimate the proportion of persons with access to each type of specialized unit.
The limitation of this traditional approach is that population distribution maps have an inherent lack of spatial precision. Annual population estimates obtained from most agencies including the US Census15 are not available in administrative units small enough to overcome this lack of spatial precision. Population numbers assigned to administrative units such as states and counties are assumed to be homogeneously distributed throughout the entire area. This assumption is not valid for nonresidential areas; this is especially problematic for rural counties, which tend to have large unpopulated areas. Furthermore, because large areas of the United States west of the Mississippi River are rural,16 this lack of precision in population distribution can introduce a regional bias in GIS-derived estimates of unserved/served populations. Therefore, in this analysis the underlying population distribution map was refined to remove as much of this potential source of bias as possible. Dasymetric distributions—defined as the redistribution of regionally aggregated population statistics into smaller area units to reveal a more realistic spatial population distribution—are preferable for proximity studies because of this ability to realistically place population over geography.
The GIS software used to accomplish the dasymetric redistribution, create the hospital proximity zones, and the proximity analysis for this project was ArcGIS version 9.3 from ESRI®.
To refine the location of the pediatric population, a dasymetric map of the pediatric population was created. Dasymetric mapping is the process of transforming data from one spatial aggregation—usually mapped as a choropleth map, in which the entire land area is shaded according to one overall value for the area—into a map that is a more accurate depiction of the magnitude and spatial extent of the data.Reference Mennis17 In this study, county-level populations were redistributed and restricted to residential areas within each county. This process involves the use of additional information about each county—information that allows differentiation between residential and nonresidential areas—to make the resulting redistribution more meaningful. Although the field of public health still relies heavily on choropleth (thematic) maps, dasymetric maps are becoming more prevalent in the developing fields of public health preparedness and sustainable development.
Lists of hospitals with the target pediatric specialty in the continental United States were acquired from national and international accrediting agencies. Each list was either geocoded using Centrus Desktop, where actual addresses were available, or were linked with the 2010 Homeland Security Infrastructure Program (HISP) Gold data set18 to create an accurately located spatial layer of hospitals for each of the five specialties.
A zonal radius of 50 miles was chosen because it is an approximation for the “golden” hour. The golden hour is referred to by most trauma specialists as the need to get severely injured persons from the accident scene to a trauma center within an hour to achieve an optimal recovery outcome.Reference Stroud, Prodhan, Moss and Anand19Reference Lerner and Moscati2021 One hundred miles is twice that distance, and appears to be the farthest distance most people are willing to travel to get any type of specialized medical care.22Reference Yantzi, Rosenberg, Burke and Harrison23Reference Mobley and Frech24 Most medical providers agree that 100 miles is too far to travel for any type of critical medical care.
The hospital proximity zones were then split by the state boundaries, so the populations within the zones could be summarized by state.
The national coverage by zone for each type of specialty was mapped to visualize the extent of confluence (or lack of confluence) of the zones over the population both at the 50-mile radius and 100-mile radius. The population proportions were also mapped by state to evaluate variability in access from state to state.
The Appendix contains a detailed description of the processes used for this study including the dasymetric redistribution of the pediatric population; acquisition, verification, and linkage of each critical care resource list and the calculations used.252627Reference Moritz282930
RESULTS
Pediatric Hospitals
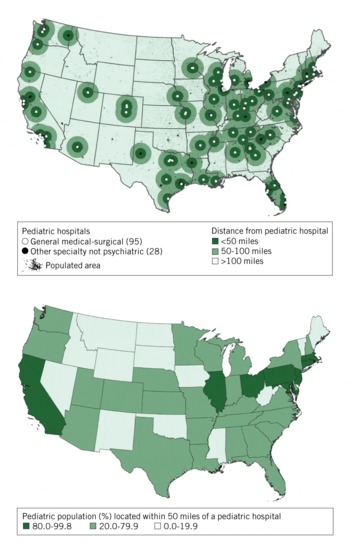
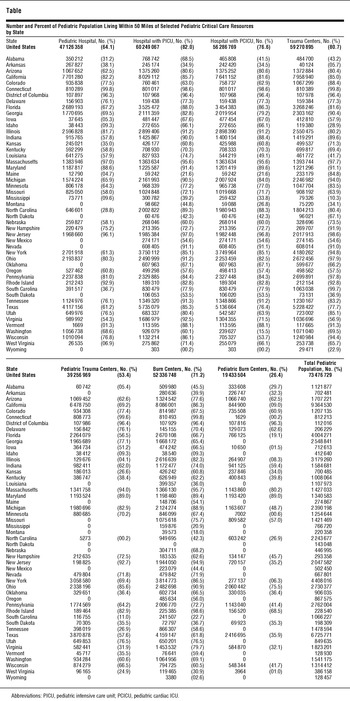
Nationally, 64.1% of the pediatric population living in the continental United States (73.5 million children in 2008) lives within 50 miles of a pediatric hospital (Table, Figure 1). In 10 states (District of Columbia, California, Illinois, Ohio, Pennsylvania, Maryland, New Jersey, Massachusetts, Connecticut, and Rhode Island), 80% or more of the pediatric population lives within 50 miles of a pediatric hospital; and in 13 states, less than 20% of the pediatric population lives within 50 miles of a pediatric hospital. The percent of the pediatric population living within 50 miles of a pediatric hospital ranges, by state, from less than 1% to greater than 99% (Table). In 7 of the 13 states with less than 20% of the pediatric population living within 50 miles of a pediatric hospital, none of the pediatric population lives within 50 miles of a pediatric hospital (Table).
Location of Pediatric Hospitals and Proximity of Pediatric Population (%) to Those Hospitals.

Number and Percent of Pediatric Population Living Within 50 Miles of Selected Pediatric Critical Care Resources by State

Hospitals with a PICU
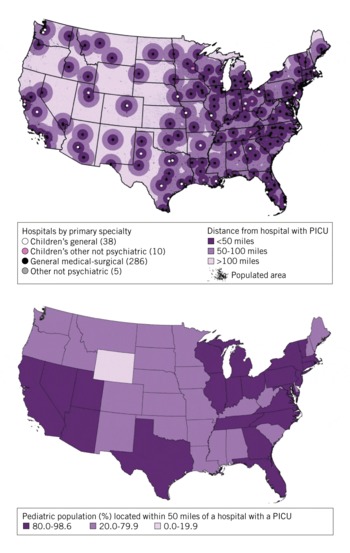
Nationally, 82.0% of the pediatric population lives within 50 miles of a hospital that has a PICU (Table, Figure 2). In 24 states, 80% or more of the pediatric population lives within 50 miles of a hospital with a PICU; and in only 1 state (Wyoming) does less than 20% of the pediatric population live within 50 miles of a hospital with a PICU. The range by state is from less than 1% to 98.6% (Table).
Location of Hospitals with Pediatric Intensive Care Units (PICU) and Proximity of Pediatric Population (%) to Those Hospitals.

Hospitals with a PCICU
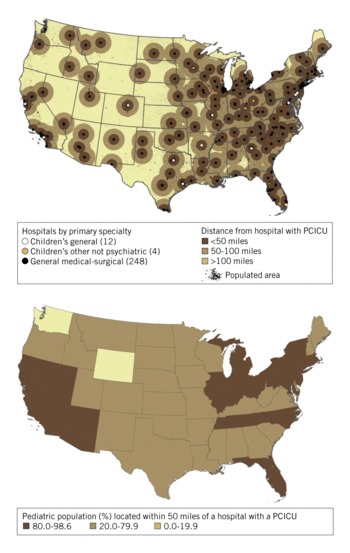
Nationally, 76.6% of the pediatric population lives within 50 miles of a hospital that has a PCICU (Table, Figure 3). In 19 states, 80% or more of the pediatric population lives within 50 miles of a hospital with a PCICU; in only 2 states (Washington and Wyoming), does less than 20% of the pediatric population live within 50 miles of a hospital with a PCICU. The range by state is from less than 1% to 98.6% for hospitals with PCICUs (Table).
Location of Hospitals with Pediatric Cardiac Intensive Care Units (PCICU) and Proximity of Pediatric Population (%) to Those Hospitals.

Hospitals with a Level I or Level II Trauma Unit or Pediatric Trauma Unit
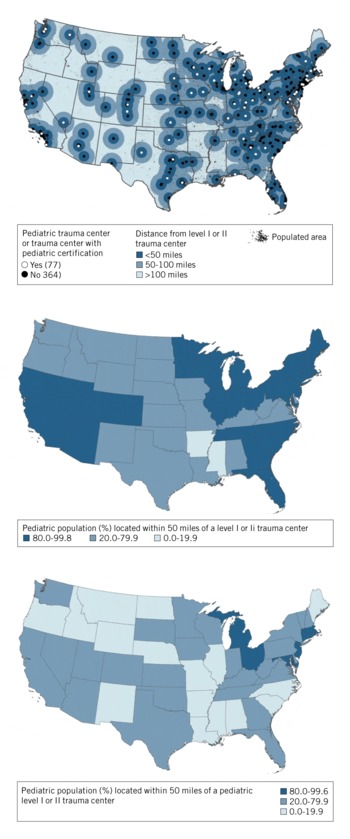
Nationally, 80.7% of the pediatric population lives within 50 miles of any level I or II trauma center; but only 53.4% live within 50 miles of a pediatric trauma center (Table, Figure 4). In 26 states more than 80% of the pediatric population lives within 50 miles of any trauma center; but in 2 states (Arkansas and Mississippi), less than 20% of the pediatric population lives within 50 miles of any trauma center. The range by state is from 5.7% to greater than 99% for all trauma centers.
Location of Level I and II General and Pediatric Trauma Centers and Proximity of Pediatric Population (%) to Those Centers.

For pediatric trauma centers, there are 8 states (District of Columbia, Michigan, Ohio, Massachusetts, Connecticut, Rhode Island, New Jersey, and Maryland) where more than 80% of the pediatric population lives within 50 miles of a pediatric trauma center; and in 16 states, 20% or less of the pediatric population lives within 50 miles of a pediatric trauma center. The range is from less than 1% to greater than 99% (Table). In 11 of the 16 states with less than 20% of the pediatric population living within 50 miles of a pediatric trauma center, none of the pediatric population lives within 50 miles of a pediatric trauma center (Table).
Hospitals with a Burn Center
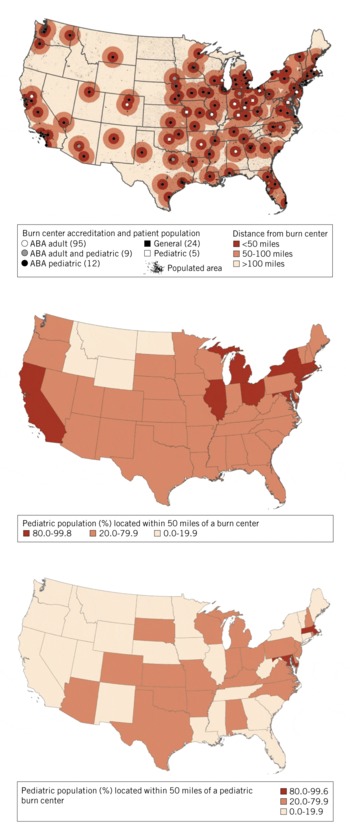
Nationally, 71.2% of the pediatric population lives within 50 miles of any burn center; but only 26.4% lives within 50 miles of a pediatric burn center (Table, Figure 5). Only 11 states (District of Columbia, California, Illinois, Michigan, Ohio, New York, Massachusetts, Connecticut, Rhode Island, New Jersey, and Maryland) have 80% or more of the pediatric population living within 50 miles of any burn center, and in 4 states (Idaho, Montana, Wyoming and North Dakota) less than 20% of the pediatric population lives within 50 miles of any burn center. The range by state is from less than 1% to 99.8%.
Location of General and Pediatric Burn Centers and Proximity of Pediatric Population (%) to Those Centers. ABA Indicates American Burn Association.

In only 3 states (District of Columbia, Massachusetts, and Maryland) does more than 80% of the pediatric population live within 50 miles of a pediatric burn center; in 25 states, 20% or less of the pediatric population lives within 50 miles of a pediatric burn center. The range by state is from less than 1% to 96.3% (Table). In 17 of the 25 states with less than 20% of the pediatric population living within 50 miles of a pediatric burn center, none of the pediatric population lives within 50 miles of a pediatric burn center (Table).
COMMENT
Although many US states provide adequate geographic coverage for most of their pediatric population—based on location of the population—for general pediatric, PICU, and PCICU care, coverage for pediatric trauma and burn care is less equally distributed. In particular, western mountain states represent the geographic region with the least coverage for each of the five pediatric critical care services.
Historically, as many as 30% of hospitalized victims of all ages in public health emergencies have required intensive care.Reference Chang and Klitzner31Reference Aharonson-Daniel, Waisman, Dannon and Peleg3233 Critical care needs projected by the Department of Homeland Security National Planning Scenarios could exceed the entire national ICU capacity.Reference Peleg, Aharonson-Daniel and Stein34
Disaster planning and response to a mass casualty incident involving the pediatric population pose unique demands on medical and public health communities. Children, as a recognized vulnerable population, are often overrepresented as victims in public health emergencies compared to other residential populations. Paired with the fact that children have innate physiologic and social vulnerabilities, this compromised distribution of care contributes to their morbidity and mortality.Reference Burkle, Williams and Kissoon35 Pediatric needs may predominate in emergencies involving a pathogen targeting infants, children, or pregnant women.36 An accident involving schools or other pediatric-specific activities, or terrorism specifically targeting children would result in surges of children disproportionate to the overall population.Reference Bravata, McDonald and Owens1Reference Markenson and Reynolds37 Although exact disease-specific data are often lacking, planners should anticipate a disproportionate number of children needing intensive care is likely, including children with chronic health conditions and special health care needs.
As it can be difficult to visualize the difference among regions using independent small-scale maps (state and local), this study uses dasymetric mapping to illustrate potential gaps and challenges in pediatric critical care resources across the nation. These facts demonstrate the potential utility of our dasymetric methodology and usefulness of having a more realistic understanding of the pediatric population distribution and accessibility to critical care. This method serves many purposes such as refining and expanding the methodology of preparedness and response in disaster planning.
It is clear from the maps that most pediatric critical care resources are located in highly urbanized environments, often with large distances between them. This geographic and economic reality can challenge pediatric regionalized systems in a disaster in which transport may not be possible or inappropriate.Reference Kanter and Dexter38 To accomplish critical care for mass casualty disasters or pandemics, coordination is needed from the community to tertiary care. Current research in pediatric disasters preparedness and rural medicine has focused on strengthening the capabilities of communities without local pediatric resources by keeping patients in local hospitals and applying pediatric medicine via telemedicine or robotics.Reference Marcin, Ellis, Mawis, Nagrampa, Nesbitt and Dimand39Reference Spooner and Gotlieb40Reference Marcin, Schepps, Page, Struve, Nagrampa and Dimand41 However, depending on the disaster, the communication resources needed for telemedicine and robotics may not be available; therefore, reliance on this option needs to be tempered with adequate alternate resources on site. In any case, close cooperation, agreements, and unique delivery systems will be needed to provide appropriate pediatric emergency mass critical care. Each state and region must review current emergency operations and devise a plan that is most appropriate to address the population-based needs of children in large-scale disasters. This planning includes not only thinking beyond the need to share resources across state lines but also the consideration of sharing resources across borders.36
This study supports the steady streams of reports and articles that highlight the increasing concern of health care policy makers, planners, administrators, and medical consumers regarding the need to improve access to pediatric intensive capabilities supporting the care of critically ill and injured children. Our study focuses on the pediatric population's proximity to care as an indicator for measuring accessibility to critical care resources. However, this research does not provide information on the number of functional beds with sufficient staff, space, and other regional inventories of equipment and supplies, or transportation needs to and from resources. In addition, because PICUs are not evaluated on a scale based on technology and staff capabilities as are NICUs and trauma centers, it is impossible to separate out the subspecialty PICUs from nonsubspecialty PICUs. Nor does it provide information regarding regions that are currently engaged in collaboration for regionalization of pediatric critical care resources such as those building on or creating pediatric telemedicine forums that bring together individuals with expertise in pediatric and neonatal medicine, pediatric emergency and critical care medicine, pediatric surgery, and emergency management that consider planning issues and serve as a medical resource once a disaster incident begins. Likewise no information is provided regarding those areas in which jurisdictional rules may not permit ease in facilitating the use of regional resources.
Finally, this study focuses on pediatric resources. Recent experience with the H1N1 influenza pandemic indicates that conditions involving pregnant women may also result in a surge of severely ill newborns needing critical care.Reference Louie, Acosta, Jamieson and Honein3 Less attention has been given to planning for perinatal critical care in public health emergencies. Data are available regarding perinatal issues of the mother and her newborn infant; however, the authors have elected to address neonatal resources and maternal obstetrics capacity separately.
CONCLUSIONS
This geospatial analysis describes the current state of pediatric critical care resources and supplies a set of data for regionalization of these resources. It provides a visual and analytic overview of existing gaps in local pediatric hospital resources. It also highlights the use of dasymetric mapping as a tool for public health preparedness planning. Dasymetric mapping for population density studies is preferable over other methods because of its ability to place the population data in a more precise geographic location.
Disclaimer: The findings and conclusions in this report are those of the authors and do not necessarily represent the official position of the Centers for Disease Control and Prevention.