Introduction
Polycystic ovary syndrome (PCOS) is known as one of the most renowned causes of infertility in women’s populations due to anovulation, which occurs in more than 15% of females in the reproductive course (Ong et al., Reference Ong, Cheng, Jin, Lao, Johnson, Tan and Qu2019; Homburg et al., Reference Homburg and Crawford2014). This disease is characterized by heterogeneous clinical signs, including irregular menstruation, hyperandrogenism, hirsutism, obesity, metabolic disorders, cardiovascular diseases and infertility (Paradisi et al., Reference Paradisi, Steinberg, Shepard, Hook and Baron2003; Zhu et al., Reference Zhu, Cui and Goodarzi2021). Although the disease’s clinical parameters may differ from one person to another, the diagnosis is confirmed by at least two clinical criteria, comprising an increase in androgen secretion and anovulation (the main indicators of the disease), as well as the presence of multiple ovarian cysts (Ong et al., Reference Ong, Peng, Jin and Qu2017). Hyperandrogenism is evidenced by seborrhea/acne and hirsutism, whereas chronic anovulation is determined by amenorrhoea/oligomenorrhea and lower fertility. PCOS is linked with some metabolic conditions, for instance, insulin resistance, obesity and dyslipidaemia (Ainehchi et al., Reference Ainehchi, Khaki, Ouladsahebmadarek, Hammadeh, Farzadi, Farshbaf-Khalili and Shokoohi2020). Also, inflammation, oxidative stress and perturbation of the hypothalamic-pituitary-gonadal axis (luteinizing hormone (LH)/follicle-stimulating hormone (FSH)) may have a role in PCOS pathogenesis (Soltani et al., Reference Soltani, Moghimian, Abtahi-Evari, Esmaeili, Mahdipour and Shokoohi2023; Roshanaee et al., Reference Roshanaee, Abtahi-Eivary, Shokoohi, Fani, Mahmoudian and Moghimian2022). There are various approaches in order to stimulate ovulation in affected cases, such as using clomiphene citrate, letrozole, gonadotropins, laparoscopic surgery and assisted reproductive techniques; however, there are no effective therapeutic methods to treat or control the disease yet (Mariani et al., Reference Mariani and Bellver2018). One of the therapeutic ways against PCOS is utilizing mesenchymal stem cells (MSCs), which have a fundamental role in regenerative medicine (Jafarzadeh et al., Reference Jafarzadeh, Nazarian, Ghaffari Novin, Shams Mofarahe, Eini and Piryaei2018; Han et al., Reference Han, Li, Zhang, Han, Chang and Ding2019). MSCs are described as pluripotent stem cells with multi-directional differentiation and self-renewal capacity, which have several sources, for instance, umbilical cord, adipose tissue and bone marrow (Bahmanpour et al., Reference Bahmanpour, Khozani and Tazangi2019; ArefNezhad et al., Reference ArefNezhad, Rezaei-Tazangi, Roghani-Shahraki, Goleij, Zare, Motedayyen and Aghazadeh2023). According to reports, transplantation of MSCs can inhibit granulosa cell apoptosis, improve ovarian function and repair structural ovarian defects in animal models (Yan et al., Reference Yan, Guo, Yuan, Shao, Zhang, Wang and Du2019). Recently, it has been stated that the administration of human adipose-derived MSCs in animal models of ovarian defects can lead to increased fertility and improved ovarian function (Pouryousefi-Koodehi et al., Reference Pouryousefi-Koodehi, Shayegan, Hashemi, Arefnezhad, Roghani-Shahraki, Motedayyen and Rezaei-Tazangi2022). Adipose tissue is known as a tissue rich in MSCs that has several advantages, including easy separation, availability and the ability to differentiate into different cell lines (Rezaei-Tazangi et al., Reference Rezaei-Tazangi, Samadi, Azandeh, Khoshnood and Mahmoudvand2021). Nevertheless, using these cells can have some limitations, such as immune issues and tumorigenesis. A suitable approach for solving these problems is using cells-originated conditioned medium (CM) (Yamaguchi et al., Reference Yamaguchi, Shibata, Yamamoto, Nishikawa, Hibi, Tanigawa and Yamamoto2015; Asadi-Golshan et al., Reference Asadi-Golshan, Razban, Mirzaei, Rahmanian, Khajeh, Mostafavi-Pour and Dehghani2021). In this line, it has been declared that the use of CM derived from MSCs can improve oocyte differentiation and have therapeutic effects on ovarian injuries and defects (Zand et al., Reference Zand, Fathi, Nasrabadi, Atrabi, Spears and Akbarinejad2018; He et al., Reference He, Chen, Yang, Hou, Ma and Xu2018). Based on published papers, CM derived from human adipose tissue mesenchymal stem cells (ATMSCs) contains different cytokines and growth factors, such as fibroblast growth factor (FGF), transforming growth factor β (TGF-β) and epidermal growth factor (EGF), that have a positive effect on low oocyte quality (Kalhori et al., Reference Kalhori, Azadbakht, Mehranjani and Shariatzadeh2018; Noverina et al., Reference Noverina, Widowati, Ayuningtyas, Kurniawan, Afifah, Laksmitawati and Wirakusumah2019). Platelet-rich plasma (PRP), as another platelet-rich blood product, also contains significant amounts of growth factors in platelet granules, such as TGF-β, hepatic growth factor (HGF) and vascular endothelial growth factor (VEGF) (Farimani et al., Reference Farimani, Heshmati, Poorolajal and Bahmanzadeh2019; Hesari et al., Reference Hesari, Keshvarinia, Kabiri, Rad, Parivar, Hoseinpoor and Hanaee-Ahvaz2020). PRP is effective in increasing the stability and size of preantral follicles in vitro (Hosseini et al., Reference Hosseini, Shirazi, Naderi, Shams-Esfandabadi, Boroujeni, Sarvari and Akhondi2017). In addition, this type of plasma plays a role in regulating hormonal reactions and the formation of follicles (Anvari et al., Reference Anvari, Dehgan and Razi2019). Given that the CM and PRP contain large amounts of growth factor, they can affect ovulation, folliculogenesis and hormonal release in this syndrome. One of the reliable methods for examining ovarian tissue sections is stereological methods (Myers et al., Reference Myers, Britt, Wreford, Ebling and Kerr2004). For this reason, this study aimed to investigate the effects of PRP and CM originated from human adipose tissue-derived MSCs on the PCOS rat model through stereological methods for the first time.
Methods and materials
Ethics
The supervision on all experimental procedures regarding animals were performed by Ethics Committee of Shiraz University of Medical Sciences (IR.SUMS.REC.1399.496).
Experimental pattern
Forty adult female Wistar rats were randomly divided into five groups: A) control group (n = 8), oral administration of normal saline (0.9% NaCl, 200 μl); B) negative control (Letrozole [LTZ]) group (n = 8), oral administration of letrozole (1 mg/kg) dissolved in normal saline (2 ml/kg); C) letrozole and CM (LTZ-CM) group (n = 8), 200 μl of CM after PCOS induction, intraperitoneal injection (IP) injection equally in four areas of the abdominal space (9, 12, 3 and 6 o’clock) (Darlan et al., Reference Darlan, Trisnasi, Putra, Amalina and Husain2024); D) letrozole and PRP (LTZ-PRP) group (n = 8), 200 μl of PRP after PCOS induction, IP injection equally in four areas of the abdominal space (9, 12, 3 and 6 o’clock) (Aboutalebi et al., Reference Aboutalebi, Alipour and Ebrahimzadeh-Bideskan2022); E) letrozole and PRP + CM (LTZ-PRP + CM) (n = 8), 200 μl CM and PRP after PCOS induction, IP injection equally in four areas of the abdominal space (9, 12, 3 and 6 o’clock). PRP and CM were injected 1 and 14 days after the induction of the disease. Twenty-eight days after PCOS induction, the weight and body mass index (BMI) of the animals were determined, and then, all animals were anaesthetized with ether (Merck, Germany). Next, blood samples were obtained from the hearts of the animals to measure serum testosterone levels. Subsequently, the animals were killed ethically with CO2 after 28 days, and their ovaries were excised and fixed in 10% formalin and at room temperature for some days.
Vaginal smear
Using this method, the oestrus cycle of rats was identified. For this purpose, the non-staining method was used (Abdulghani et al., Reference Abdulghani, Alshehade, Kamran and Alshawsh2022). To prepare the smear, rats were first taken and a normal saline (0.9% NaCl) drop was drained into the vaginal surface using a dropper (Figure 1). The contents of the vagina were then pulled out again with a dropper. Next, the contents of the vaginal canal were placed on a slide and immediately before the contents of the slide were dried, they were examined by a light microscope (CHS, Olympus, Japan) without using a slide with a magnification of 400×. In the pro-oestrous phase, nucleated epithelial cells are predominantly observed, and in the oestrus cycle, cornified epithelial cells are identified. In the metestrus cycle, three types of nucleated epithelial cells, cornified epithelial cells and leukocytes are recognized. Also, the presence of leukocyte cells predominantly indicates the diestrus cycle (Patel et al., Reference Patel and Shah2018).
Vaginal smear and a sample of the oestrus cycle of studied animals.

PCOS induction
PCOS was induced in animals (Figure 2) through oral administration of letrozole tablets (Novartis, Switzerland) (1 mg/kg) soluble in normal saline (2 ml/kg) daily for 21 days (Noorafshan et al., Reference Noorafshan, Ahmadi, Mesbah and Karbalay-Doust2013), and then, the induction was approved by vaginal smear and irregular oestrus cycles (Tohma et al., Reference Tohma, Onalan, Tepeoglu, Bayraktar, Colak, Ozcimen and Zeyneloglu2019).
Isolation of the right ovary from the letrozole group indicating the histopathological features of an ovary with many ovarian cysts.

Obtaining platelet-rich plasma
Five healthy male Wistar rats were used for blood sampling and PRP. All animal blood was drained through cardiac puncture and transferred to test tubes containing 3.2% sodium citrate (Merck, Germany). The collected blood samples were centrifuged (TDZ-5WS, Selecta lab, China) at 400 g for 10 minutes. After this stage, the tubes contained three distinct parts; the upper part was the plasma, and the middle part was the Buffy coat. Also, the lower part was red blood cells. Buffy coat and plasma were transferred to another tube and centrifuged at 800g for 10 minutes. After this step, the upper two-thirds, which is Platelet-poor-plasma (PPP), was discarded. The lower one-third PRP. The PRP was then divided into small units for later use and preserved at −20 °C.
Preparing human adipose tissue-derived mesenchymal stem cells
In this study, following obtaining written consent from healthy donors, in order to isolate MSCs, adipose tissue was collected from the superficial layer of the abdomen during liposuction surgery at Motahari Hospital, Tehran, Iran. Isolation of human ATMSCs was carried out based on the protocol of Dubois et al (Dubois et al., Reference Dubois, Floyd, Zvonic, Kilroy, Wu, Carling and Gimble2008). Before starting the separation process, the adipose tissue was heated in a water bath at 37 °C. Then, all separation steps under the hood were performed under sterile conditions. Adipose tissue was transferred to a tube, comprising 1% penicillin/streptomycin (Invitrogen, Massachusetts, USA), soluble in phosphate buffered saline (PBS). The sample was washed several times with PBS to remove blood and attached connective tissue. The adipose tissue sample was then divided into small pieces using sterile scissors and transferred to a tube containing 0.1% collagenase type 1 (Sigma, St. Louis, USA) and 1% bovine serum albumin (BSA) (dissolved in hot PBS). The sample was then kept in a water bath for 30 minutes to ensure complete digestion. After tissue digestion, the tube was centrifuged at 1200 rpm for 5 minutes at room temperature. After removing the supernatant, the plate was exposed to 1% BSA/PBS solution and centrifuged at 1200 rpm. After centrifugation, the plate was exposed to the medium containing DMEM, 10% foetal bovine serum (FBS) and 1% penicillin/streptomycin. Then, they were transferred to tissue culture flasks (5000 cells/cm2) and stored in humid medium (5% CO2, 98% humidity, 37 ° C). After colony formation, the media was changed every two days until complete elimination of RBCs and debridement and the confluence of more than 80% of the flask.
Characterization of human adipose tissue-derived mesenchymal stem cells
The flow cytometry method was performed to confirm the isolation of human adipose tissue-derived MSCs and the absence of haematopoietic stem cells. In this method, the lack of expression of specific surface markers of haematopoietic stem cells (CD34 and CD45) and the expression of specific surface markers on adipose MSCs (CD44 and CD90) in isolated cells were considered according to Ghaneialvar et al. Protocol (Ghaneialvar et al., Reference Ghaneialvar, Soltani, Rahmani, Lotfi and Soleimani2018). In brief, third passage cells were incubated and conjugated with specific monoclonal antibodies and (FITC) Isothiocyanate Fluorescein or (PE) Phycoerythrin, respectively, in 250 ml PBS (half an hour at room temperature in darkness). Primer antibodies of CD34, CD45, CD44 and CD90 were utilized and diluted in 4 mL PBS. The diluted cells were centrifuged and then resuspended in a solution, including 2% formaldehyde and 600 mL of PBS, and finally assessed by flow cytometer (BD Bioscience). The obtained data were analysed by FlowJo software (FlowJo LLC, AshlandOR, USA).
Preparing conditioned medium obtained from human adipose tissue-derived mesenchymal stem cells
To obtain CM, MSCs (104 cells/cm2) (Noverina et al., Reference Noverina, Widowati, Ayuningtyas, Kurniawan, Afifah, Laksmitawati and Wirakusumah2019) were cultured in DMEM medium without FBS after the third to fifth passage. Next, the cell culture medium was removed and centrifuged at 1500 rpm for 5 minutes. The supernatant was centrifuged for a second time at 3000 rpm for 3 minutes and used without dilution (Yang et al., Reference Yang, Lei, Ouyang, Ren, Li, Hu and Huang2014).
Hormone assessment
At the end of the experiment, rats were anaesthetized using ether (Merck, Germany), and a 2 cc blood sample from the hearts of animals was taken to measure serum testosterone levels using a 2.5 cc syringe. Blood samples were poured into test tubes and subsequently centrifuged at 3500 rpm for 10 minutes (Hettich, Germany). With the help of a sampler, the blood samples were poured into 2.5 ml microtubes. Then, blood samples were stored in the freezer (− 20 ° C). Blood tests were performed using the standard ELISA kit (Diagnostics Biochem Canada, Ontario, Canada).
Evaluation of weight and body mass index of animals
In order to evaluate the impact of treatments on the weight and BMI of animals, the weight and length of the animals were measured on the last day of the experiment. To weigh the rats, a digital scale (Germany-scaltec) with an accuracy of 0.01 g was used. The distance from the tail root to the nose of the rats was also measured using a ruler.
Histological and stereological methods
After paraffinizing the samples, the ovaries were sectioned serially, 5 μm (volume estimation) and 25 μm (number estimation), and the H&E staining was performed. Then, ovarian volume (OV) as well as the volume of ovarian cortex and medulla, oocytes in different phases, ovarian cysts and the corpus luteum and number of antral, preantral and atretic follicles and granulosa cells were estimated using a light microscope (CHS, Olympus, Japan) by stereological techniques. Different types of follicles were detected based on their characteristics as follows:
-
1. Primordial follicle: An oocyte enclosed by a single layer of (squamous) follicular cells.
-
2. Primary follicle: An oocyte enclosed by one or multiple layers of cuboidal follicular cells.
-
3. Secondary follicle: Recognized by the existence of a single and large fluid-filled space (antral cavity).
-
4. Atretic follicles: In these follicles, the granulosa cells undergo cell death apoptosis and then the oocyte is degenerated (Soltani et al., Reference Soltani, Moghimian, Abtahi-Evari, Esmaeili, Mahdipour and Shokoohi2023). Also, the corpus luteum and the ovarian cysts are identified using the observation of a compilation of luteal cells surrounded by fibroblasts originated from the theca externa and fluid-filled cystic follicles with a thin granulosa cell layer, respectively (Irving-Rodgers et al., Reference Irving-Rodgers, Roger, Luck and Rodgers2006; Mobeen et al., Reference Mobeen and Apostol2020).
Estimating ovarian volume and the volume of ovarian cortex and medulla, ovarian cyst and corpus luteum
First, for capturing images, a 16-megapixel camera (5388 * 2988) with an image sensor (Sony Exmor RS IMX240) was connected to a microscope (Nikon Eclipse 200). The Cavalieri technique was used to estimate OV. For this purpose, data related to images were entered into the NIH Image J 64-bit (Fiji) software. After that, the software was calibrated with a Zeiss micrometre (10 μm per unit accuracy). According to the Cavalieri approach, the point-counting grid is used to estimate the volume (Figure 3). These grids consist of organized points with equal distances. Because these points have no dimension, cross grids containing two dimensions were used. In this method, the top right corner of the cross is conventionally assigned to the point. If the other three corners do not collide, the top and right corners are counted. The grids were randomly superimposed on the images of tissue sections, and the number of points that collided with the ovarian section surface area was counted. The distance between two points in the point network is measured on the X and Y axes. To estimate the volume of the ovary and the cortex and the medulla parts of the ovary, the Cavalieri technique was used based on the following formula.
Estimation of volume parameters in the ovarian tissue stained by haematoxylin and eosin using the Cavalier’s approach (magnification: 40x). Scale bar=800 µm.

V = ∑A × T
∑A = ∑P × (a/p)
In this formula, ∑P is the total number of points counted on the ovarian tissue, and a/p is the area or territory around each cross (a (p) = X
 $\underline \Delta $
× Y
 $\underline \Delta $
).
X
 $\underline \Delta $
is the distance between two points on the X-axis (400 μm). Y
 $\underline \Delta $
is the distance between two points on the Y-axis (400 μm). In the above formula, T is the distance between tissue sections. The distance of all serial sections was counted, and its mean was placed in the above formula. After staining, the sections were placed side by side, and based on the number of sections, between 8 and 12 sections were selected. After counting the points on the sections, and using the following formula, the volume of the ovaries was estimated. To estimate the volume of the cortex and medulla parts of the ovary, the volume ratio was estimated based on the following formula.
Vv medulla = ΣP medulla/ΣP total
Vv cortex = ΣP cortex/ΣP total
Similarly, the volume of ovarian cyst and corpus luteum was estimated based on the following formula.
Vv cyst = ΣP cyst/ΣP total
Vv corpus luteum = ΣP corpus luteum/ΣP total
On average, 206 ± 56 points per animal were counted.
Estimating the volume of oocytes in the phases of preantral, preantral and atretic
In order to estimate oocyte volume (preantral, antral and atretic), at first, the distance between the centre of the nucleus and the peripheral area of the oocyte (Ln) was estimated. In the end, using the following formula, the oocyte volume was estimated.
VN=: 4π/3. (Ln3)
Estimating the number of follicles (preantral, antral and atretic) and granulosa cells
In the time of follicle number counting, identifying the type of follicle is crucial. Three types of follicles can be observed, which include the preantral, antral and atretic follicles (Dehghani et al., Reference Dehghani, Aboutalebi, Esmaeilpour, Panjehshahin and Bordbar2018). The follicle number was estimated by the optical disector method based on 25 µm-thick sections (Figure 4). An unbiased counting frame was used to count the number of follicles per unit volume. The frame consists of two thick or forbidden sides and two thin or allowed sides. Oocytes that were inside the frame or in contact with the allowed sides were counted, and those that were outside the frame or in contact with the forbidden sides were not counted. The tool for counting these cells was a disector. Initially, the image-related data were entered into the NIH Image J 64-bit software. Next, the software was calibrated with a Zeiss micrometre (10 micrometres per unit accuracy) with high power magnification. In order to prevent the effects of possible artefacts of the upper and lower surfaces of the sections on counting, only 15 μm of the middle of the tissue sections was selected as the height of the dissector for counting. For counting, slides were placed on the microscope stand equipped with a microcator. The images of tissue sections (60X object lens for counting follicles and 100X for counting granulosa cells) were transferred to the monitor screen by a Sony video camera. Then, the counting frame with an area of 40000 μm for follicles and 400 μm for granulosa cells was placed on the image using Image J software. Finally, the following formula was used to estimate the number of follicles and granulosa cells. The following formula was used to estimate the mean numerical density of follicles.
Estimation of number parameters in the ovarian tissue stained by haematoxylin and eosin using the optical disector method (magnification: 200x). Scale bar=10 µm.

Nv=[ΣQ/a(f)×h × ΣP].
In the mentioned formula, ‘ΣQ’ is referred to as total number of counted cells, ‘h’ is the thickness of the tissue sections assumed for counting, ‘a/f’ is regarding the frame area in the tissue scale, and ‘ΣP’ is the total number of points placed on the chosen fields. To count the number of granulosa cells, the following formula was used. In this formula, ‘ΣQ’ was the total
number of granulosa cells, ‘a/f’ was the area per counting frame (in the present study, it was 400 mm2 for granulosa cells), ‘ΣP’ was the total counted frames per animal for granulosa cells, and ‘h’ was the disector height measured by the microcator. The total ovarian follicle number was estimated through the following formula (Charleston et al., 2013).
N = Nv×V
In the above formula, ‘NV’ was the number density of ovarian follicles and ‘V’ was the OV.
Statistics
Statistical analyses were accomplished by GraphPad Prism software version 9. The findings were considered as mean ± standard deviation, and p < 0.05 was assumed significant statistically. The ANOVA and post-hoc Tukey tests were used for statistical analysis.
Results
Flow cytometry findings
In the current investigation, the lack of expression of specific surface markers of CD34 and CD45 and the expression of specific surface markers of CD44 and CD90 in isolated cells were approved (Figure 5).
Characterization of human adipose tissue-derived mesenchymal stem cells by the flow cytometry method based on non-expression of specific surface markers of haematopoietic stem cells (CD34 and CD45) and expression of surface markers of human adipose-derived mesenchymal stem cells (CD44 and CD90).

Findings of body weight, body mass index and ovarian weight of animals
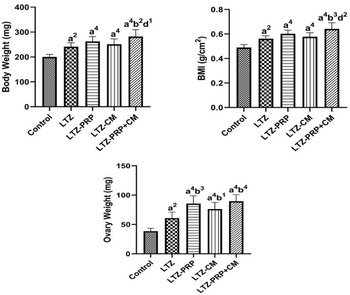
Body weight (BW), BMI and ovarian weight (OW) of animals in the LTZ group were significantly higher than those of the control group (P < 0.01). BW and BMI of the LTZ-PRP- and LTZ-CM-treated groups were significantly increased compared to the control group (P < 0.0001). OW in the LTZ-PRP group was dramatically elevated compared to the control and LTZ groups (LTZ-PRP vs. Control, P < 0.0001; LTZ-PRP vs. LTZ, P < 0.001). The OW of the LTZ-CM group was significantly increased compared to control and LTZ groups (LTZ-CM vs. Control, P < 0.0001; LTZ-CM vs. LTZ, P < 0.05). Also, the BW of the LTZ-PRP + CM group was dramatically increased in comparison with control, LTZ and LTZ-CM groups (LTZ-PRP + CM vs. Control, P < 0.0001; LTZ-PRP + CM vs. LTZ, P < 0.01; LTZ-PRP + CM vs. LTZ-CM, P < 0.05). The BMI of the LTZ-PRP + CM group was considerably elevated compared to control, LTZ and LTZ-CM groups (LTZ-PRP + CM vs. Control, P < 0.0001; LTZ-PRP + CM vs. LTZ, P < 0.001; LTZ-PRP + CM vs. LTZ-CM, P < 0.01). The OW of the LTZ-PRP + CM group was significantly higher than that of control and LTZ groups (LTZ-PRP + CM vs. Control, P < 0.0001; LTZ-PRP + CM vs. LTZ, P < 0.0001). Plus, there were no statistically significant differences in the BW and BMI of the LTZ-PRP group compared to the LTZ and LTZ-CM groups. There were no significant differences in terms of BW and BMI between the LTZ-PRP + CM and LTZ-PRP groups. Also, there were no significant differences between the treatment groups in terms of OW (Figure 6).
Comparison of mean body weight, ovarian weight and the body mass index of animals between control group and groups receiving letrozole (LTZ), letrozole and PRP (LTZ-PRP), letrozole and CM (LTZ-CM) and letrozole and PRP + CM (LTZ-PRP + CM). 1, P < 0.05; 2, P < 0.01; 3, P < 0.001; 4, P < 0.0001. a, versus the control group; b, versus the letrozole group (PCOS); c, versus the PRP group; d, versus the CM group. The data were expressed as the mean ± standard deviation (SD).

Findings of volume of ovarian cortex and medulla and ovarian volume of animals
The cortex volume (CV) and OV of the LTZ group were significantly increased compared to the control group (P < 0.05). There was no significant difference in terms of the medulla volume (MV) between the LTZ and control groups. The CV of the LTZ-PRP group was significantly elevated compared to control, LTZ, and LTZ-CM groups (LTZ-PRP vs. Control, P < 0.0001; LTZ-PRP vs. LTZ, P < 0.0001; LTZ-PRP vs. LTZ-CM, P < 0.001). Besides, the MV of the LTZ-PRP group was significantly increased compared to the control group (P < 0.01). OV in the LTZ-PRP group was also increased significantly compared to control, LTZ, and LTZ-CM groups (LTZ-PRP vs. Control, P < 0.0001; LTZ-PRP vs. LTZ, P < 0.0001; LTZ-PRP vs. LTZ-CM, P < 0.01). The CV of the LTZ-CM group was dramatically higher than that of the control group (P < 0.0001). OV in the LTZ-CM group was considerably elevated compared to the control group (P < 0.001). Moreover, CV in the LTZ-PRP + CM group was increased significantly compared to control, LTZ, and LTZ-CM groups (LTZ-PRP + CM vs. Control, P < 0.0001; LTZ-PRP + CM vs. LTZ, P < 0.0001; LTZ-PRP + CM vs. LTZ-CM, P < 0.001). Also, the MV of the LTZ-PRP + CM group was remarkably increased compared to the LTZ and control groups (LTZ-PRP + CM vs. Control, P < 0.0001; LTZ-PRP + CM vs. LTZ, P < 0.05). OV was elevated significantly in the LTZ-PRP + CM group compared to control, LTZ, and LTZ-CM groups (LTZ-PRP + CM vs. Control, P < 0.0001; LTZ-PRP + CM vs. LTZ; P < 0.0001; LTZ- PRP + CM vs. LTZ-CM, P < 0.001). Furthermore, there were no significant differences in CV and OV between the LTZ-CM group and the LTZ group. Also, there were no significant differences between the LTZ-PRP + CM and LTZ-PRP groups in terms of these two indices. Plus, no significant difference was observed in the MV of treatment groups (Figure 7).
Comparison of mean volume of ovarian cortex and medulla and ovarian volume of animals between control group and groups receiving letrozole (LTZ), letrozole and PRP (LTZ-PRP), letrozole and CM (LTZ-CM) and letrozole and PRP + CM (LTZ-PRP + CM). 1, P < 0.05; 2, P < 0.01; 3, P < 0.001; 4, P < 0.0001. a, versus the control group; b, versus the letrozole group (PCOS); c, versus the PRP group; d, versus the CM group. The data were expressed as the mean ± standard deviation (SD).

Findings of the testosterone levels of animals
Serum testosterone level (STL) of animals in the LTZ group was significantly increased compared to the control group (P < 0.01). STL in the LTZ-PRP group was increased significantly compared to control, LTZ, and LTZ-CM groups (LTZ-PRP vs. Control, P < 0.0001; LTZ-PRP vs. LTZ, P < 0.0001; LTZ-PRP vs. LTZ-CM, P < 0.001). The level of this hormone in the LTZ-CM group was dramatically elevated compared to the control group (P < 0.0001). Also, the STL in the LTZ-PRP + CM group was considerably higher than that of the control, LTZ, and LTZ-CM groups (P < 0.0001). Moreover, there was no significant difference in STL between LTZ-CM and LTZ groups (Figure 8).
Comparison of the serum testosterone levels of animals between control group and groups receiving letrozole (LTZ), letrozole and PRP (LTZ-PRP), letrozole and CM (LTZ-CM) and letrozole and PRP + CM (LTZ-PRP + CM). 1, P < 0.05; 2, P < 0.01; 3, P < 0.001; 4, P < 0.0001. a, versus the control group; b, versus the letrozole group (PCOS); c, versus the PRP group; d, versus the CM group. The data were expressed as the mean ± standard deviation (SD).

Findings of the number of preantral, antral, atretic follicles and granulosa cell number
The preantral follicle number (PFN), antral follicle number (AFN) and granulosa cell number (GCN) in the LTZ group were remarkably decreased compared to the control group (P < 0.0001). Also, in terms of the AtFN, there was no difference between the control and LTZ groups. The PFN in the LTZ-PRP group showed a significant decrease and increase compared to control and LTZ groups, respectively (LTZ-PRP vs. Control, P < 0.0001; LTZ-PRP vs. LTZ, P < 0.05). The AFN in the LTZ-PRP group revealed a significant reduction and increment in comparison with the control and LTZ groups, respectively (LTZ-PRP vs. Control, P < 0.01; LTZ-PRP vs. LTZ, P < 0.0001). The AtFN in the LTZ-PRP group was significantly elevated compared to control, LTZ, and LTZ-CM groups (LTZ-PRP vs. Control, P < 0.0001; LTZ-PRP vs. LTZ, P < 0.0001; LTZ-PRP vs. LTZ-CM, P < 0.001). Also, the GCN in the LTZ-PRP group was considerably decreased and increased compared to the control and LTZ groups, respectively (P < 0.0001). The PFN and AFN in the LTZ-CM group compared to control and LTZ groups were significantly reduced and elevated, respectively (LTZ-CM vs. Control, P < 0.0001; LTZ-CM vs. LTZ, P < 0.01). The AtFN in the LTZ-CM group was also increased significantly compared to the control and LTZ groups (P < 0.001). Moreover, the GCN in the LTZ-CM group was dramatically decreased and increased compared to control and LTZ groups (LTZ-CM vs. Control, P < 0.0001; LTZ-CM vs. LTZ, P < 0.001). In addition, the PFN in the LTZ-PRP + CM group was significantly diminished and increased compared to the control and LTZ groups, respectively (P < 0.001). The AFN in the LTZ-PRP + CM group was remarkably decreased and increased compared to control and LTZ groups, respectively (LTZ-PRP + CM vs. Control, P < 0.001; LTZ-PRP + CM vs. LTZ, P < 0.0001). Also, the AtFN in the LTZ-PRP + CM group was considerably elevated compared to control, LTZ and LTZ-CM groups (P < 0.0001). The GCN in the LTZ-PRP + CM group was dramatically decreased and increased compared to control and LTZ groups, respectively (P < 0.0001). There were no significant differences in terms of PFN, AFN, and GCN in treatment groups. In addition, there was no significant difference between the LTZ-PRP + CM and LTZ-PRP groups in terms of this index (Figure 9).
Comparison of mean numbers of preantral, antral and atretic follicles, and granulosa cell number of animals between control group and groups receiving letrozole (LTZ), letrozole and PRP (LTZ-PRP), letrozole and CM (LTZ-CM) and letrozole and PRP + CM (LTZ-PRP + CM). 1, P < 0.05; 2, P < 0.01; 3, P < 0.001; 4, P < 0.0001. a, versus the control group; b, versus the letrozole group (PCOS); c, versus the PRP group; d, versus the CM group. The data were expressed as the mean ± standard deviation (SD).

Findings of the volume of oocytes in the phases of preantral, antra and atretic, corpus luteum and ovarian cyst of animals
The preantral oocyte volume (POV) in the LTZ group was significantly reduced compared to the control group (P < 0.001). The antral oocyte volume (AOV), atretic oocyte volume (AtOV) and corpus luteum volume (CLV) were also decreased considerably in the LTZ group compared to the control group (P < 0.0001). The ovarian cyst volume (OCV) in the LTZ group was dramatically increased compared to the control group (P < 0.0001). The POV in treatment groups was significantly reduced in comparison with the control group (LTZ-PRP vs. Control, P < 0.001; LTZ-CM vs. Control, P < 0.01; LTZ-PRP + CM vs. Control, P < 0.05). AOV and CLV in treatment groups were dramatically diminished in comparison with the control group (P < 0.0001). The AtOV in treatment groups was significantly reduced compared to the control group (LTZ-PRP vs. Control, P < 0.01; LTZ-CM vs. Control, P < 0.0001; LTZ-PRP + CM vs. Control, P < 0.001). Also, the OCV in treatment groups was remarkably increased compared to the control group (P < 0.0001). Furthermore, there was no significant difference between the treatment and LTZ groups in terms of the mentioned indices (Figure 10).
Comparison of mean volume of oocytes (preantral, antral and atretic), and the volume of ovarian cyst and corpus luteum of animals between control group and groups receiving letrozole (LTZ), letrozole and PRP (LTZ-PRP), letrozole and CM (LTZ-CM) and letrozole and PRP + CM (LTZ-PRP + CM). 1, P < 0.05; 2, P < 0.01; 3, P < 0.001; 4, P < 0.0001. a, versus the control group; b, versus the letrozole group (PCOS); c, versus the PRP group; d, versus the CM group. The data were expressed as the mean ± standard deviation (SD).

Discussion
PCOS, as a complex endocrine condition, is the main cause of infertility in women’s populations, and despite multiple efforts, it has not been recommended an effective method for disease treatment (De Leo et al., Reference De Leo, Musacchio, Cappelli, Massaro, Morgante and Petraglia2016; Paris et al., Reference Paris, Alexopoulos, Hu, Shah, Aflatounian, Edwards and Walters2021). Recently, stem cell therapy based on CM derived from MSCs has acquired great attention for improving ovarian reserve and fertility, likely in light of the operation of growth factors and cytokines (Hong et al., Reference Hong, Yan, Xin, Hao, Liu, Wang and Yang2020; Akbari et al., Reference Akbari, Eftekhar Vaghefi, Shahedi, Habibzadeh, Mirshekari, Ganjizadegan and Nematollahi-Mahani2017). Plus, PRP, as another source of cytokines and growth factors, is a therapeutic candidate for some ovarian damages, like premature ovarian failure (POF), and is involved in the development of primordial follicles, oestrogen stimulation and oogenesis (Dehghani et al., Reference Dehghani, Aboutalebi, Esmaeilpour, Panjehshahin and Bordbar2018; Atkinson et al., Reference Atkinson, Martin and Sturmey2021). Hence, in this study, the influences of PRP and CM obtained from adipose tissue-derived MSCs on a PCOS rat model were investigated by stereological methods. In the present study, the administration of letrozole manifested the features of a PCOS model by a considerable increase in BW, BMI and STL, and a decrease in the PFN, AFN and GCN compared to the control group, and several works supported these findings (Rajan et al., Reference Rajan, M and Balaji2017; Ullah et al., Reference Ullah, Jahan, Razak, Pirzada, Ullah, Almajwal and Afsar2017; Kafali et al., Reference Kafali, Iriadam, Ozardalı and Demir2004; Pandey et al., Reference Pandey, Singh, Singh, Krishna, Pandey and Tripathi2016; Noorafshan et al., Reference Noorafshan, Ahmadi, Mesbah and Karbalay-Doust2013). Letrozole causes hyperglycaemia, which is associated with insulin resistance and hyperlipidaemia, justifying increased BW, OW and BMI (Baptiste et al., Reference Baptiste, Battista, Trottier and Baillargeon2010; Reddy et al., Reference Reddy, Begum, Mutha and Bakshi2016). One of the main features of PCOS is impaired hormonal feedback mechanisms influencing the hypothalamic-pituitary-ovarian axis. This disorder gives rise to elevated androgen levels and a hormonal imbalance in gonadotropins (i.e. FSH and LH), which play a functional role in the typical symptoms and fertility issues related to this disease (Soltani et al., Reference Soltani, Moghimian, Abtahi-Evari, Esmaeili, Mahdipour and Shokoohi2023; Mohammadi et al., Reference Mohammadi, Hosseinianvari, Ghazalian, Fani, Mahmudian, Brazvan and Moghimian2022; Khodaeifar et al., Reference Khodaeifar, Fazljou, Khaki, Torbati, Madarek, Khaki and Dalili2019). Regarding this point, our results revealed that letrozole inhibits the function of the aromatase enzyme, which leads to the production of oestrogen (Noorafshan et al., Reference Noorafshan, Ahmadi, Mesbah and Karbalay-Doust2013). This enzyme is responsible for converting androgens such as testosterone to oestrogen (De Ronde et al., Reference De Ronde and de Jong2011). Therefore, inhibition of this enzyme increases the STL released by theca cells, which can in turn lead to atresia or abnormal growth of follicles and diminished granulosa cell layers (Noorafshan et al., Reference Noorafshan, Ahmadi, Mesbah and Karbalay-Doust2013; Reddy et al., Reference Reddy, Begum, Mutha and Bakshi2016). In our research, letrozole elevated the OV, CV, MV and OCV compared to healthy animals. These occurrences can be due to the development of ovarian cysts, a thickened ovarian capsule, and the hyperplasia of theca interna cells (Kafali et al., Reference Kafali, Iriadam, Ozardalı and Demir2004). In our study, CLV and the volume of oocytes in different phases also decreased significantly in the LTZ-treated group compared to the healthy group. The corpus luteum controls reproductive cycles and prepares the uterus for implantation in case fertilization occurs. As a result of the absence or reduction of the corpus luteum, no ovulation or reduction of ovulation occurs (Jahan et al., Reference Jahan, Abid, Khalid, Afsar, Shaheen, Almajwal and Razak2018). It has been demonstrated that excess androgens stimulate reactive oxygen species (ROS), which are associated with oocyte quality deterioration (Ye et al., Reference Ye, Xie, Song and Zhou2021; Rafiee et al., Reference Rafiee, Rezaee-Tazangi, Zeidooni, Alidadi and Khorsandi2021). In the LTZ-PRP group, we observed that STL, OW, CV and OV were increased dramatically than the LTZ group. Scientific evidence has shown that some growth factors of PRP, like EGF, FGF and HGF, are associated with hyperandrogenism through inhibition of the aromatase enzyme (Liu et al., Reference Liu, Huang and Lin2021; Hirshfield et al., Reference Hirshfield2013). Also, there is a direct relationship between increased visceral fat and increased serum Tumor Necrosis Factor (TNF-α) level (Mohammadi et al., Reference Mohammadi, Kayedpoor, Karimzadeh-Bardei and Nabiuni2017; Behnoush et al., Reference Behnoush, Maleki, Arzhangzadeh, Khalaji, Pezeshki, Vaziri and Hernandez2024). It is stated that adipose tissue dysfunction in PCOS cases can cause the release of inflammatory mediators (e.g. some interleukins, TGF-β, monocyte chemo-attractant protein-1[MCP-1], and vascular cell adhesion molecule 1 [VCAM1]), which can affect insulin signalling (Bril et al., 2024). These inflammatory conditions may also occur as a result of increased secretion of androgens, especially testosterone (Shabbir et al., Reference Shabbir, Khurram, Moorthi, Eissa, Kamal and Butler2023). Plus, documents suggested that growth factors in PRP are involved in promoting angiogenesis and collagen formation (Qian et al., Reference Qian, Han, Chen, Song, Zhao, Ouyang and Fan2017). So, growth factors related to PRP can affect the weight and volume parameters of the ovary by regulating angiogenesis, collagen synthesis and visceral fat surrounding this organ. In this group, we found that PFN, AFN, AtFN and the GCN were considerably elevated in comparison with the LTZ group. In line with our investigation, Sugiura et al. reflected that EGF and its receptors exert a functional role in FSH function, and FSH in turn is considered an important endocrine factor that regulates granulosa cell proliferation and follicular maturation (Emori et al., Reference Emori and Sugiura2014). IGF and VEGF have been revealed to play a pivotal role in follicle development (Druckmann et al., 2022; Geva et al., Reference Geva and Jaffe2000). Also, in this direction, Ding et al. reported that EGF could increase the PFN and AFN in animal models with POF (Ding et al., Reference Ding, Zou, Wu, Lu, Qian, Li and Huang2020). Another key player disturbing follicular development in PCOS is inflammation, which acts by changing the ovarian microenvironment. It is well-documented that increased levels of pro-inflammatory cytokines are associated with theca cell hyperplasia (Fox et al., Reference Fox, Zhang, Moeller, Garzo, Chang and Duleba2021; Salmabadi et al., Reference Salmabadi, Kouchesfahani, Parivar and Karimzadeh2017; Xiang et al., Reference Xiang, Wang, Ding, Xu, Liu, Huang and Ge2023). In the LTZ-CM group, OW, number of follicles in the mentioned phases, and GCN were increased significantly. Owing to the fact that a large number of growth factors of PRP are similar to those in CM, such as EGF, FGF and VEGF. Thus, these results were somewhat predictable. However, some differences in the results of PRP and CM are related to the method of their extraction. The present study also indicated that the administration of PRP + CM caused a significant increase in BW, BMI, OV, CV, MV, STL and the number of follicles and granulosa cells compared to the LTZ group. These findings implicated that in the PRP + CM combination, PRP effects on the mentioned parameters are more prominent than CM. In addition, there was no significant difference between the treatment groups and the LTZ group in terms of the volume of oocytes, CLV and OCV. Cell size mechanisms have not been completely uncovered yet, but internal and external factors are involved (Hafen et al., Reference Hafen and Stocker2003; Lloyd et al., Reference Lloyd2013). Also, it has been demonstrated that some growth factors, like EGF, induce DNA synthesis, but do not change the cell size (Dong et al., Reference Dong, Albertini, Nishimori, Kumar, Lu and Matzuk1996; Comish et al., Reference Comish, Drumond, Kinnell, Anderson, Matin, Meistrich and Shetty2014). Therefore, it seems that these two sources rich in growth factors had no impact on the volume parameters of CLV, OCV and oocyte volume in polycystic ovaries.
Conclusion
The results of our study indicated that PRP and CM + PRP combination elevated dramatically parameters related to the weight and volume of the cortex and ovary, and the number of granulosa cells and follicles in different stages in comparison with the PCOS group. On the whole, it seems that PRP, CM and RP + CM are not an effective method with minimum side effects against this disease. However, more researches are needed to identify the exact effects of PRP and CM on PCOS models.
Data availability
The experimental data used to support the findings of this study are available from the corresponding author upon request.
Acknowledgments
This paper is part of a MS.C thesis written by Reza Arefnezhad.
Author contributions
Conception and design: Farzaneh Dehghani, Reza Arefnezhad. Data acquisition: Reza Arefnezhad, Nader Tanideh, Fatemeh Karimi, Fereshteh Aliakbari. Data analysis and interpretation of data: Reza Arefnezhad, Farzaneh Dehghani. Drafting of the manuscript: Farzaneh Dehghani. Critical revisions Reza Arefnezhad, Gholamreza Mohseni, Tahereh Esmaeilpour. Final approval: all authors.
Funding
Not applicable.
Competing interests
The authors declare no conflict of interests.
Ethical standards
The project was approved based on the guidelines of the Animal Care and Ethics Committee of the Shiraz University of Medical Sciences Shiraz, Iran (approval No. IR.SUMS.REC.1399.496).